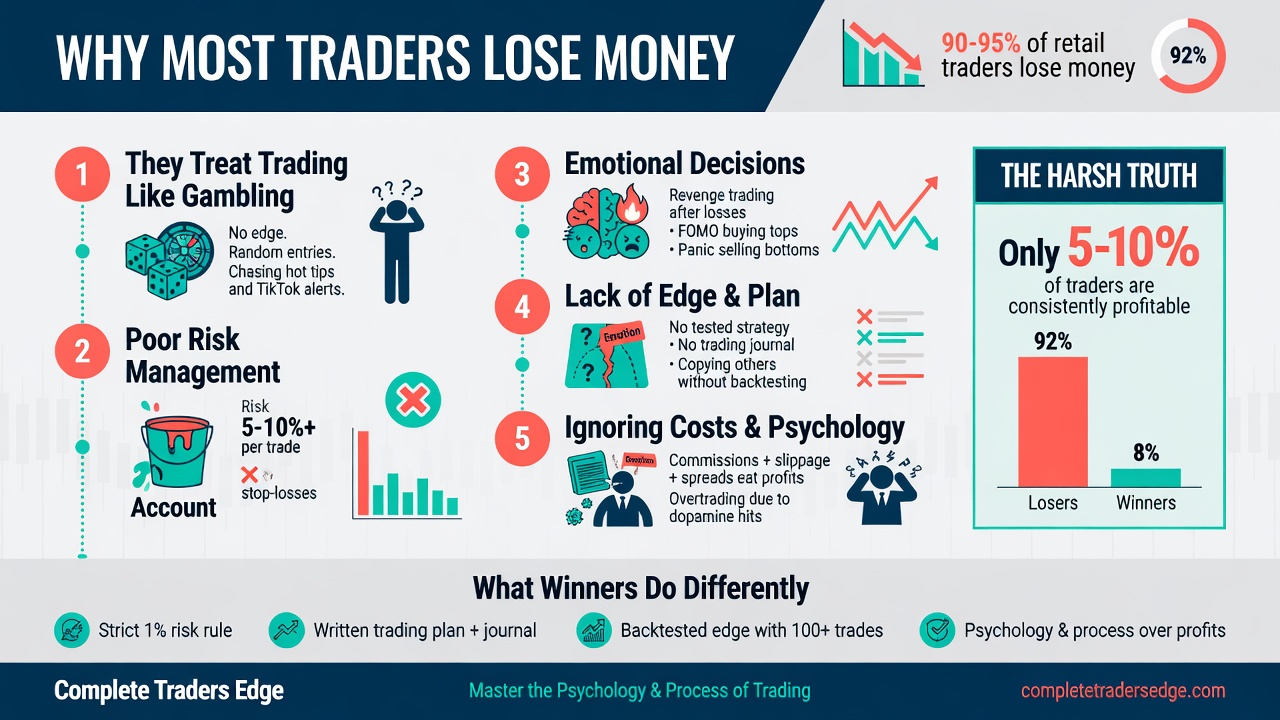
Most traders don’t blow their accounts because they picked the wrong indicator. They don’t fail because markets are rigged against them. They fail because nobody told them the truth about what trading actually requires — and they never stopped long enough to figure it out themselves.
The 90% failure rate in trading is one of the most quoted statistics in finance. But that number is almost always used to scare people away, not to help them understand why it happens and, more importantly, how to be in the other 10%.
This guide breaks down every major reason traders lose money — from the psychological traps to the technical mistakes to the structural blind spots nobody talks about. More importantly, it gives you a clear, actionable path for fixing each one. This is the article most trading educators don’t want to write, because it means admitting the full picture.
The Real Failure Rate: You Are Not Alone
Related tool: the free Edge Companion app tracks exactly this — a daily Mind · Method · Money check-in and trade journal that shows whether your state actually predicts your results.
Before we get into the reasons, let’s anchor this with real numbers. Studies consistently show that between 70% and 90% of retail traders lose money over any 12-month period. Broker disclosures in regulated markets (EU, UK, Australia) are required to publish these figures. Most show between 74% and 89% of retail CFD accounts lose money.
But here is the part nobody says out loud: this is not unique to trading.
| Field | Start with ambition | Still active 5 years in | Reach professional level |
|---|---|---|---|
| Trading (retail) | 100% | ~20-30% | ~5-10% |
| Law (graduates) | 100% | ~55% practising | ~15-20% senior/partner |
| Medicine (graduates) | 100% | ~70% still clinical | ~30% reach specialist level |
| Engineering | 100% | ~50% in engineering roles | ~20% senior/chartered |
| Entrepreneurship | 100% | ~50% survive year 5 | ~10% scale profitably |
| Music (aspiring artists) | 100% | ~10% still performing | ~1-2% make a living from it |
| Acting | 100% | ~20% still auditioning | ~2% earn sustainable income |
| Professional sport | 100% | ~5% reach semi-pro | <1% earn a living |
The difference between trading and every other profession on that list? The others have long, structured onboarding processes. Medical school is 6 years before you see a patient alone. Law requires supervised practice. Engineering has mentored apprenticeships. Trading has a brokerage account you can open in 15 minutes.
The barrier to entry is almost zero. The barrier to excellence is the same as any other field. That mismatch is where the failure rate comes from, not from some fundamental impossibility of profiting from markets.
The 90% figure doesn’t mean trading is a scam. It means most people start trading the same way someone would try to perform surgery after watching a few YouTube videos. The craft is learnable. But it requires the same commitment you would give any serious profession.
Reason 1: Trading Without a Defined Edge
An edge is simple to define: it is a repeatable pattern where, over a large sample of trades, your winners are bigger than your losers often enough to produce a profit after costs.
Most traders never establish one. They watch a few videos, learn about support and resistance, and start taking trades based on what “looks good” on the chart. This is pattern recognition without statistical validation. Every trade is a guess dressed up as analysis.
A real edge has three components:
- A specific entry trigger — not “when price looks weak” but a defined set of conditions that must all be present before you consider a trade.
- A proven R:R structure — your average win must be measurably larger than your average loss. A minimum 1:2 Risk-to-Reward ratio means you only need to be right 34% of the time to break even, before costs.
- A sample size that proves it — 30 trades proves nothing. 200 trades in similar market conditions begins to show whether your edge is real.
Without these three things, you are not trading an edge. You are gambling with extra steps.
Reason 2: No Risk Management Framework
Risk management is the single most cited concept in trading education. It is also the most frequently ignored in practice. There is a reason for this disconnect: understanding risk management intellectually is easy. Applying it when you are down 3% on a trade and convinced the move is “about to reverse” is something else entirely.
The core rule is straightforward: risk no more than 1% of your account on any single trade. On a $10,000 account, that is $100 per trade. On a $50,000 account, that is $500. This is not a number chosen arbitrarily. It is chosen because it allows you to take 20 consecutive losing trades and still have 82% of your capital intact.
| Risk per trade | After 10 losses | After 20 losses | After 30 losses |
|---|---|---|---|
| 1% per trade | 90.4% remaining | 81.8% remaining | 74.0% remaining |
| 2% per trade | 81.7% remaining | 66.8% remaining | 54.5% remaining |
| 5% per trade | 59.9% remaining | 35.8% remaining | 21.5% remaining |
| 10% per trade | 34.9% remaining | 12.2% remaining | 4.2% remaining |
The maths here are unforgiving. A trader risking 10% per trade is effectively finished after a 20-trade losing streak, even if their strategy is otherwise valid. The 1% trader can survive the same streak with 82 cents of every dollar intact, which gives them the psychological and financial capital to continue.
Reason 3: Treating Psychology as an Afterthought
Every serious trading educator eventually arrives at the same conclusion: the market is not the problem. You are. Not because you are uniquely flawed, but because trading activates specific psychological responses that are hardwired into the human brain and work directly against disciplined execution.
The big three are loss aversion, recency bias and the need for certainty.
Loss aversion means you feel losses approximately twice as intensely as you feel equivalent gains. In a trading context, this means you will naturally hold losing trades too long and cut winning trades too short.
Recency bias means you weight recent events far more heavily than a statistically valid sample. After three winning trades, you feel invincible. After three losing trades, you feel your strategy is broken. Both reactions are driven by a sample size of three, which is statistically meaningless.
The need for certainty means most traders cannot accept the fundamental truth of trading: any individual trade can go against you, even when you do everything right. Mark Douglas described this precisely in Trading in the Zone. The edge only shows up over hundreds of trades, not ten.
These patterns produce the four most expensive behaviours in trading:
- Revenge trading — taking impulsive trades to immediately recover a loss, usually at larger size and with lower quality setups.
- FOMO entries — entering trades because price is moving and you fear missing it, rather than because your setup criteria are met.
- Moving stop losses — shifting your stop to give a losing trade “more room,” which systematically destroys your R:R over time.
- Overtrading — taking too many trades, usually driven by boredom or the need to feel active, which increases transaction costs and lowers average trade quality.
The fix is not willpower. It is process. When your pre-trade checklist, position size and stop loss are decided before you enter the trade, there is significantly less room for emotion to intervene at the worst moment.
Reason 4: No Trading Plan
A trading plan is not a document you write once and frame on the wall. It is an operational manual that governs every decision you make while markets are open. Most traders don’t have one.
| Category | What your plan must define |
|---|---|
| Market selection | Which instruments you trade and why. Gold, BTC, NQ, ES — not “whatever is moving today.” |
| Timeframes | HTF for bias (Daily + 4H), entry timeframes (1H + 15M). Defined, fixed, non-negotiable. |
| Entry criteria | The exact conditions required for a valid setup. If you cannot write them in 3 sentences, they are not specific enough. |
| Risk rules | Max risk per trade (1%), daily loss limit (2-3%), weekly loss limit (5%). |
| Trade management | Where you move your stop loss and under what conditions. When and how you take partial profits. |
| News rules | Specific rules for red-folder news events — reduce size, avoid entry, or stand aside entirely. |
| End-of-day routine | When you stop trading for the day and what your review process looks like. |
Reason 5: Mistaking Activity for Progress
Beginning traders often equate the number of trades they take with how seriously they are pursuing their goals. Being in a trade feels like working. Sitting in cash feels like falling behind. This instinct is almost perfectly wrong.
Professional traders are selective to a degree that would feel uncomfortable to most beginners. They may take two or three trades per week on a specific instrument they know deeply. They wait for high-probability confluences: a key level on the higher timeframe, a liquidity sweep, a structural shift on the entry timeframe, all aligning at a logical place in the price delivery cycle.
Overtrading has a compounding cost beyond just transaction fees. Every low-quality trade dilutes your statistical sample and muddles your edge data. Fewer trades, taken only when your full setup criteria are met, is almost always the right direction for a trader who is struggling with consistency.
Reason 6: Learning Without Context
The trading education space is enormous and largely unregulated. YouTube, Twitter, Discord, courses and paid groups all offer conflicting advice, often from people whose primary income is selling education rather than trading profitably themselves. The result: traders accumulate tactics without ever building a coherent framework.
They learn Fibonacci. Then Order Blocks. Then VWAP. Then Elliott Wave. Each concept in isolation makes sense. Combined without a unifying framework, they produce paralysis. The chart becomes a mess of competing signals.
The solution is to build a framework first — a philosophy about how and why markets move — then layer individual tools onto that framework where they add genuine clarity. Markets move because of liquidity. Large institutional participants operate in areas of concentrated liquidity: below recent lows where retail stop losses cluster, above recent highs where breakout buyers enter, at Fair Value Gaps where price moved fast and left an imbalance. Understanding this dynamic is the framework. Order Blocks, FVGs, Kill Zones and liquidity sweeps are tools that help you identify where this activity is likely to occur.
Reason 7: Undercapitalisation and Unrealistic Expectations
A common scenario: someone opens a $500 account and sets a goal of making $500 per month. To achieve this, they need to return 100% monthly. To do that, they need to risk large percentages per trade. Large risk leads to large drawdowns. Large drawdowns destroy the account. The trader concludes trading doesn’t work.
The account size was the problem, not the strategy.
Professional traders typically target between 2% and 5% monthly return on capital with controlled risk. On a $10,000 account, this produces $200 to $500 per month. On a $100,000 account, it produces $2,000 to $5,000 per month. The strategy is the same. The income is determined by the capital base.
Reason 8: No Feedback Loop
Without a structured trading journal, you cannot identify your actual patterns. You might believe you are good at Gold trades but struggling with BTC, without the data to confirm it. You might be consistently placing your stop loss in a location where liquidity tends to be swept first — and without recording every trade, you will never know.
A basic journal entry should capture: the instrument, date and session, the setup type, entry and exit prices, planned and actual R:R, and a brief note on what happened. Review this data weekly. Look for patterns in your losses, not just your wins. The journal is not just a record. It is a mirror.
Reason 9: Confusing a Demo Account With the Real Thing
Demo trading does not reproduce the psychological experience of real trading. When no real money is at risk, the fear and greed responses that drive most trading mistakes simply do not activate. You will be more patient, more disciplined and more willing to follow your rules on a demo account than when the numbers represent real money you worked for.
The transition from demo to live should be made at the smallest possible account size — enough that the losses feel real, but not enough that they are financially destabilising. A $500 to $1,000 live account used exclusively for process practice builds the psychological muscle that demo trading never can.
Reason 10: Quitting Before the Edge Has Time to Work
Traders develop a strategy, take 15 to 20 trades, have a losing streak and conclude the strategy doesn’t work. They switch, repeat, and call trading a scam after six months of this cycle.
A losing streak of 5 to 10 trades is not evidence that your strategy is broken. It is normal variance within any statistical edge. Even a strategy with a 55% win rate will produce sequences of 7 or 8 consecutive losses in a large enough sample. If your risk management is in place, those losses are manageable. Minimum sample size for meaningful edge assessment: 50 trades, ideally 100 or more, all taken under similar market conditions.
The Mind · Method · Money Framework
Every reason traders fail maps back to one of three pillars.
| Pillar | What it covers | Failure symptoms |
|---|---|---|
| Mind | Psychology, discipline, habits, emotional regulation, process over outcome | Revenge trades, FOMO entries, rule-breaking, inconsistency |
| Method | Technical framework, edge identification, market structure, entry criteria, confluences | Random entries, no defined setup, overcomplicating analysis |
| Money | Risk management, position sizing, drawdown control, account growth, capital allocation | Blown accounts, oversizing, no daily loss limits, unrealistic expectations |
Most traders obsess over Method and neglect Mind and Money entirely. They spend hundreds of hours learning setups and entry patterns, then lose their accounts because they size up emotionally after a winning streak (Money failure) or revenge-trade after a loss (Mind failure). The technical knowledge becomes irrelevant when the other two pillars are missing.
The traders who survive and eventually thrive are the ones who recognise that all three pillars must develop in parallel. You cannot trade your way to discipline. You cannot psychology your way to a profitable strategy. You cannot manage risk in a strategy that has no edge. They build together or they fall together.
What Separates the 10% Who Succeed
- They treat trading as a business. They track every trade, review their performance weekly, and make decisions based on data rather than how they feel.
- They accept losses as a cost of doing business. A losing trade executed according to plan is not a failure. It is an expected outcome within a statistical distribution.
- They have a defined process and follow it. Not sometimes. Not when it is convenient. On every trade, in every session, regardless of recent results.
- They size correctly. They never risk more than they can afford to lose on a single trade. Their position sizes are calculated, not guessed.
- They are patient. They wait for their full setup criteria to be present before entering. They would rather miss a trade than take one that doesn’t meet their standards.
- They invest in their own development. They read, study, journal and actively seek to understand their own weaknesses.
Your Action Plan: What to Fix First
Step 1 — Establish your risk rules first. Before you take another live trade, define your maximum risk per trade (1%), your daily loss limit (2%) and what happens when you hit those limits. Write these down. Make them non-negotiable.
Step 2 — Start a journal today. A spreadsheet with date, instrument, setup type, entry, stop, target, outcome and a brief note is enough. Commit to recording every trade for 60 days without exception.
Step 3 — Define your setup in writing. Be specific. “Price respects support” is not specific. “Price sweeps the prior session low on the 15-minute chart, forms a bullish Order Block, then closes back above the sweep level” is specific. If you cannot write it precisely, you do not yet have a defined edge.
Step 4 — Reduce your position size and trade count simultaneously. Fewer trades, smaller size, more focus on process than outcome.
Step 5 — Review weekly, not daily. Block 30 minutes every Sunday to review the week’s trades, grade your process compliance, and identify one specific thing to improve the following week.
Frequently Asked Questions
What is the real failure rate for retail traders?
Studies and regulated broker disclosures consistently show between 74% and 89% of retail traders lose money over any 12-month period. The important context is that high failure rates apply to most other high-performance fields too — the difference is that trading has an extremely low barrier to entry, which attracts many underprepared participants.
Can you actually fix a losing streak or is it just variance?
Both things are true simultaneously, which is what makes losing streaks so difficult to navigate. Some are pure variance — your edge is working correctly but you are in a statistical cold patch. Others indicate a genuine strategy problem. The way to tell the difference is your journal. If your trades comply with your rules and the setups look the same as your profitable periods, it is likely variance. If you are deviating from your plan, something needs adjusting.
Is psychology really more important than strategy?
It is not a competition between the two — but psychology is more frequently the proximate cause of account losses than strategy failure. Most traders who blow accounts do not lack a viable strategy. They lack the psychological infrastructure to execute it consistently under pressure. A mediocre strategy executed with excellent discipline will outperform an excellent strategy executed with poor discipline almost every time.
How many trades do I need before I can tell if my strategy works?
A minimum of 50 trades taken under similar market conditions gives you a rough initial signal. A sample of 100 or more is more reliable. The important qualifier is “similar market conditions” — 100 trades across a trending market, a range, and a high-volatility event are measuring three different things.
Why do traders keep switching strategies instead of sticking with one?
Strategy switching is almost always driven by a short losing streak triggering the conclusion that the strategy is broken. This is recency bias. Any strategy with a genuine edge will produce losing streaks of 5 to 10 trades with regular frequency. Traders who switch at the first losing streak never stay with any approach long enough to discover whether it has a real edge.
▶ ▶ ▶ Continue Reading
Take the next step in your development
The Complete Trader’s Edge
Everything in this article — and the complete system — is in the book
70 chapters covering Mind, Method and Money in full. From understanding your psychology to building a rule-based strategy to managing risk like a professional. Available on Amazon in Kindle, paperback and full-colour editions.
 The Complete Trader's Edge
The full Mind · Method · Money framework. 70 chapters.
View on Amazon →
The Complete Trader's Edge
The full Mind · Method · Money framework. 70 chapters.
View on Amazon →
 Market Mayhem
400 years of bubbles, crashes, and the pattern that keeps repeating.
Buy on Amazon →
Market Mayhem
400 years of bubbles, crashes, and the pattern that keeps repeating.
Buy on Amazon →
 Greatest Companies
How the world's greatest companies were built — and what traders learn from them.
View on Amazon →
Greatest Companies
How the world's greatest companies were built — and what traders learn from them.
View on Amazon →