Fibonacci retracements, extensions, and the golden pocket — the mathematical framework institutions use to map pullbacks and set price targets.
Fibonacci levels are among the most widely watched technical tools in every market. Banks, hedge funds, and algorithmic trading systems all reference them. This is not because Fibonacci numbers have mystical properties. It is because enough institutional participants use them that they become self-fulfilling. When a large enough portion of the market watches the same level, orders cluster there, and price reacts.
This guide covers what Fibonacci actually measures, how to draw retracements and extensions correctly, where the highest-probability reaction zones sit, and how to combine Fibonacci with price action and ICT concepts for professional-grade entries.
What Fibonacci Measures
The Fibonacci sequence is a series of numbers where each number is the sum of the two preceding ones: 0, 1, 1, 2, 3, 5, 8, 13, 21, 34, 55, 89, 144. As the sequence progresses, the ratio between consecutive numbers converges on 1.618, known as the golden ratio. The inverse of this ratio is 0.618.
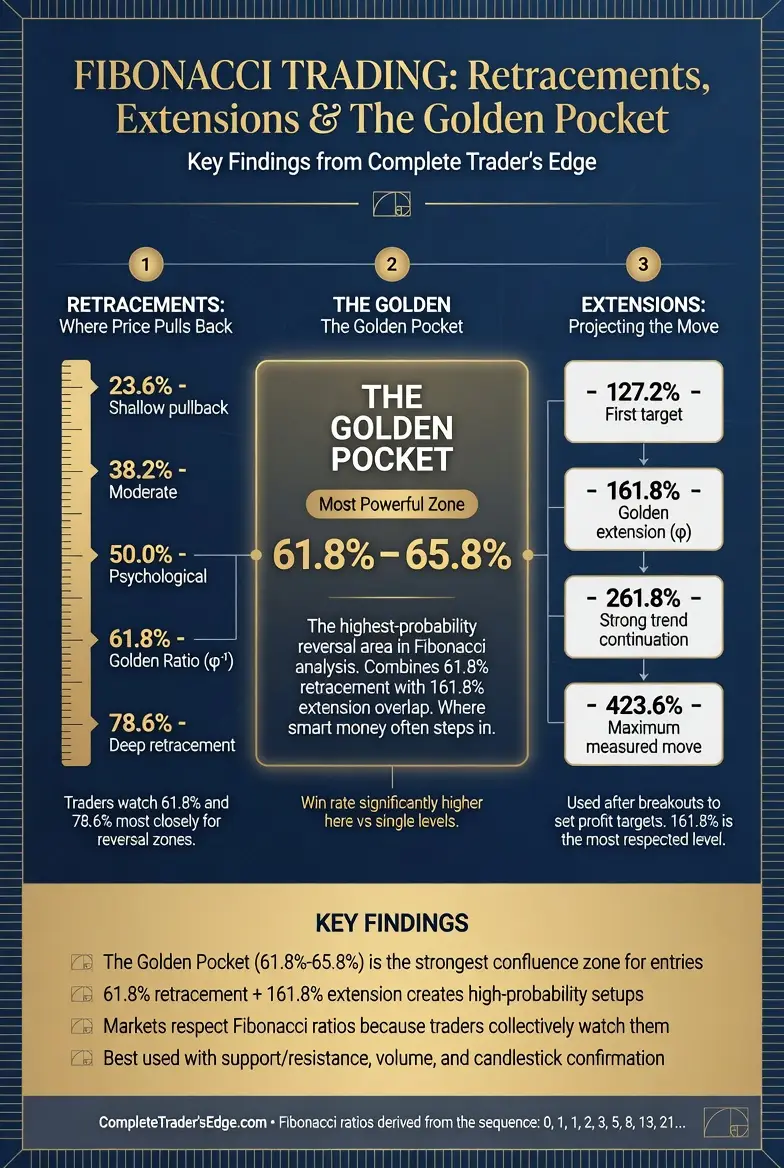
In trading, we do not use the sequence itself. We use the ratios derived from it. The key Fibonacci retracement levels are 23.6%, 38.2%, 50%, 61.8%, and 78.6%. The key extension levels are 127.2%, 161.8%, 200%, and 261.8%. Each represents a proportional relationship between a price move and its subsequent pullback or projection.
How to Draw Fibonacci Retracements Correctly
The single most common mistake traders make with Fibonacci is drawing it incorrectly. The retracement tool measures from a swing low to a swing high in an uptrend, or from a swing high to a swing low in a downtrend. The direction matters. In an uptrend, you are measuring the pullback from the high back toward the low. In a downtrend, you are measuring the pullback from the low back toward the high.
Use significant swing points, not minor fluctuations. The best Fibonacci levels come from clean, impulsive moves with clear swing highs and lows. If the swing points are ambiguous, the levels will be unreliable. Multi-timeframe confirmation strengthens any Fibonacci level. A 61.8% retracement on the 4-hour chart that aligns with a 38.2% retracement from the daily chart creates a powerful confluence zone.
The Key Retracement Levels
The 38.2% retracement is the shallowest significant level. Strong trends often retrace only this far before continuing. If price barely reaches 38.2% before reversing, the underlying momentum is powerful.
The 50% retracement is not technically a Fibonacci number, but it is universally watched. It represents the midpoint of the move, where the market is evenly split between continuation and reversal.
The 61.8% retracement is the golden ratio itself and the most important single Fibonacci level. More institutional algorithms reference 61.8% than any other retracement level. When price pulls back to 61.8% and holds, it is a high-probability signal that the original trend will resume.
The Golden Pocket: 61.8% to 78.6%
The zone between the 61.8% and 78.6% retracement is known as the golden pocket. This is the highest-probability reversal zone in Fibonacci analysis. In the ICT framework, the golden pocket often aligns with order blocks and fair value gaps, creating a dense area of institutional interest.
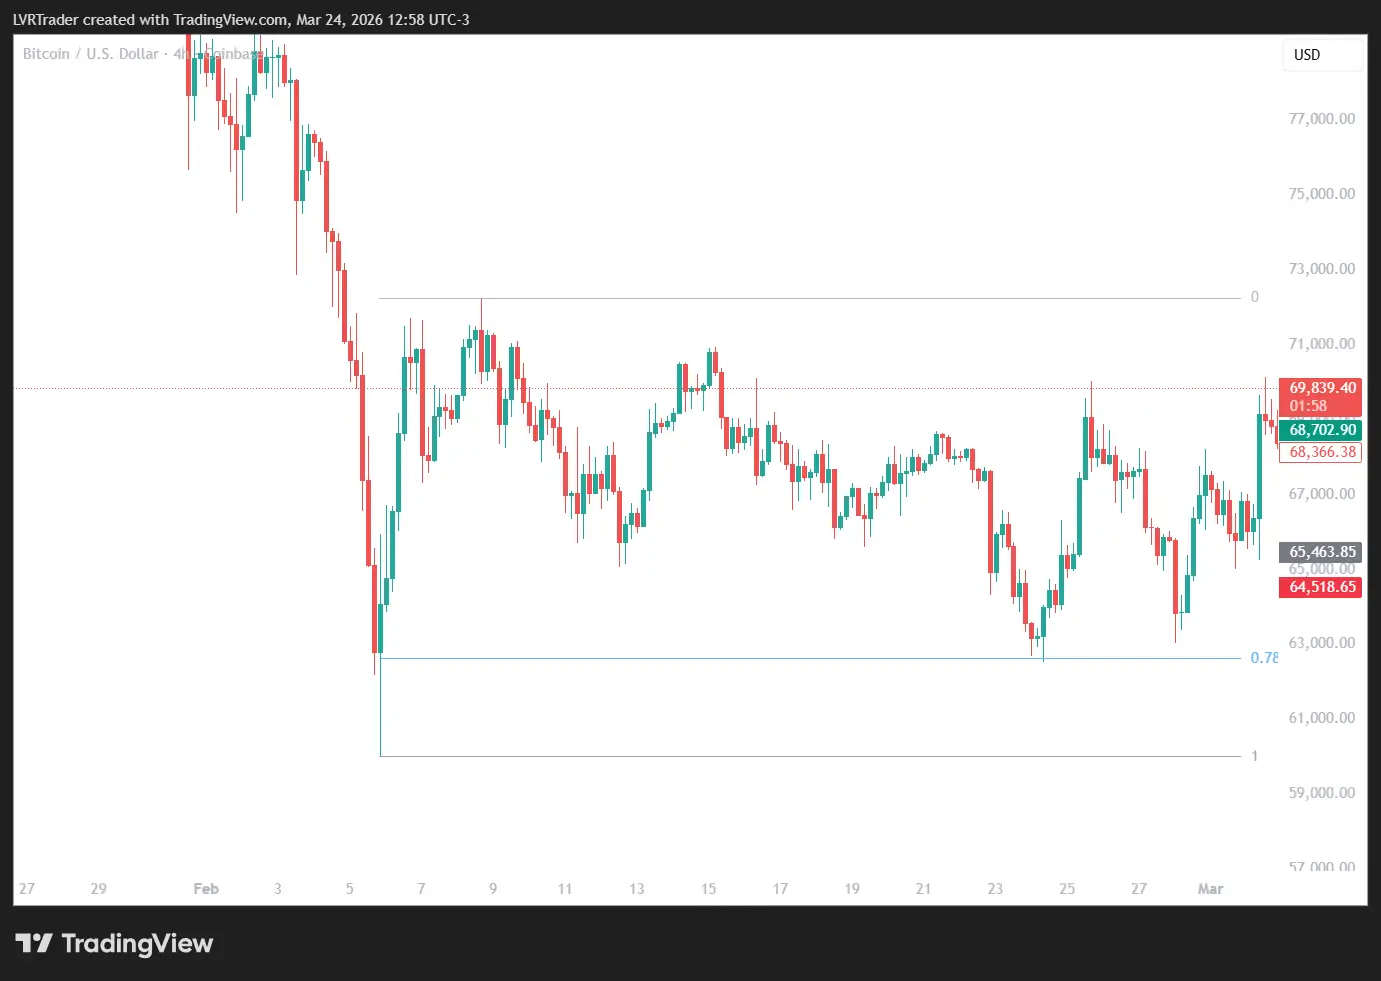
The golden pocket works because it represents the deepest reasonable pullback before a trend loses its structural validity. A move that retraces beyond 78.6% is statistically more likely to reverse entirely than to continue in the original direction. The golden pocket is therefore the last stand for trend continuation.
Fibonacci Extensions: Setting Price Targets
While retracements measure pullbacks, extensions project where price is likely to travel once the trend resumes. The most important extension levels are 127.2%, 161.8%, and 200%.
After a pullback to a key retracement level, the 127.2% extension is the first target. If momentum is strong, 161.8% becomes the primary target. The 200% extension represents a measured move equal to the original impulse leg.
Extensions work best when combined with other structural levels. A 161.8% extension that aligns with a previous swing high or a volume profile point of control creates a high-confidence target zone where you should be taking profits, not entering new positions.
Fibonacci + ICT Concepts: The Professional Combination
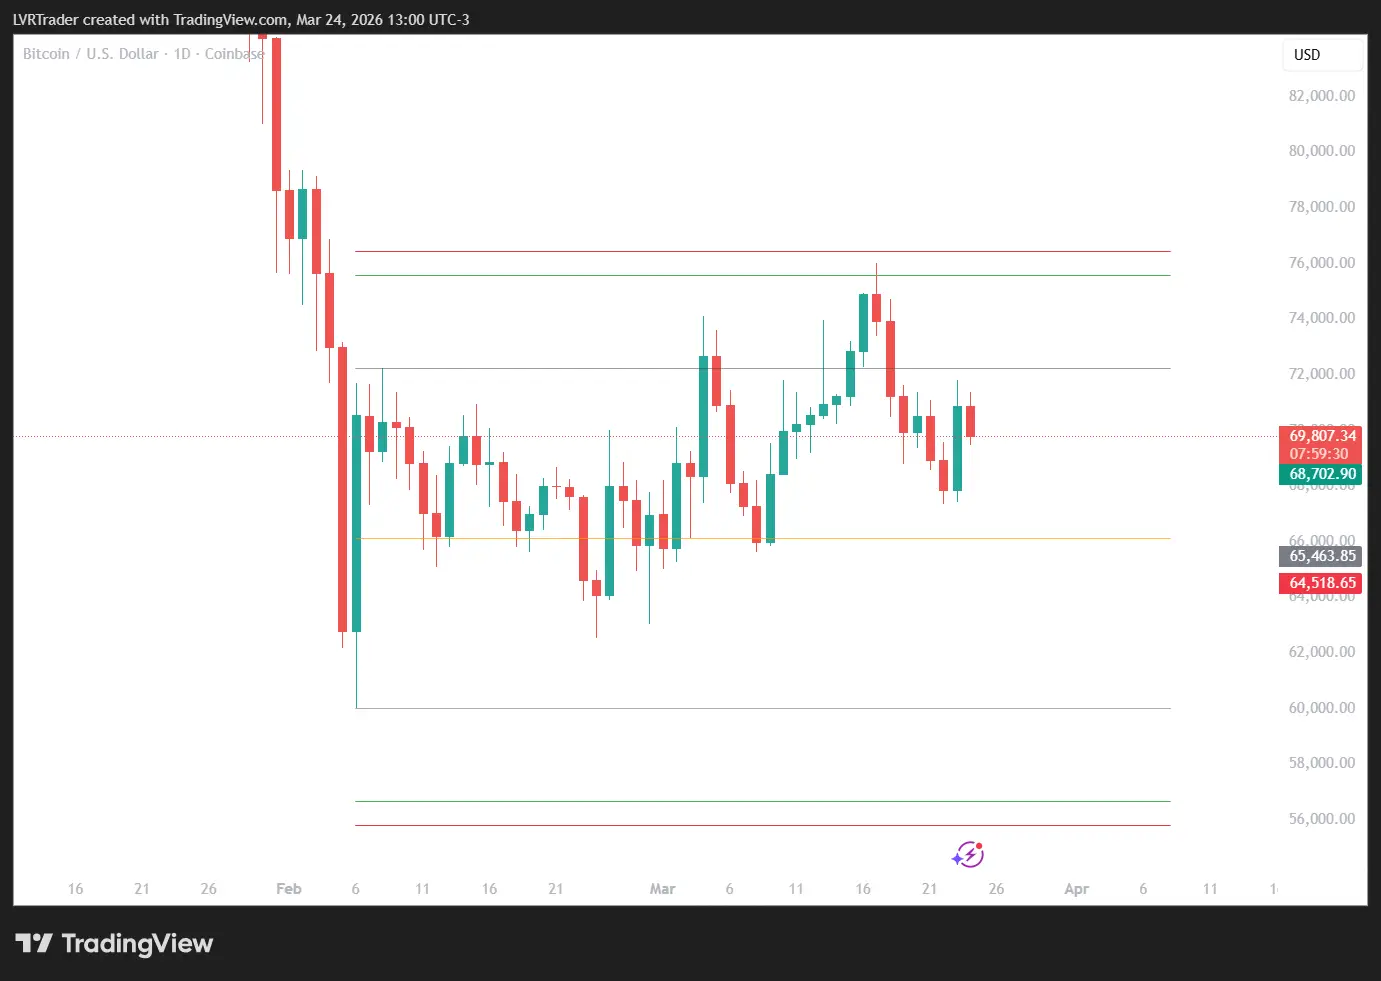
Fibonacci levels become significantly more powerful when combined with ICT concepts. The most effective combinations include a golden pocket retracement that aligns with a bullish order block, a 61.8% retracement that fills into a fair value gap, and an extension target that coincides with a liquidity pool above equal highs or below equal lows.
The ICT Optimal Trade Entry sits between the 62% and 79% retracement of the most recent dealing range. This is functionally equivalent to the golden pocket. When you see an OTE zone that contains an order block and sits inside a fair value gap, you have one of the highest-probability setups available in technical analysis.
Common Fibonacci Mistakes
The most common mistake is using Fibonacci levels in isolation. A 61.8% retracement without confluence from price action, market structure, or volume is just a number on a chart. Always require at least one additional confirmation factor before acting on a Fibonacci level.
The second mistake is drawing Fibonacci on insignificant moves. Minor swings produce unreliable levels. Focus on the most recent significant impulse move that is clearly visible on your analysis timeframe.
The third mistake is ignoring the trend context. Fibonacci retracements are continuation tools. They identify where pullbacks are likely to end within an existing trend. Using them in ranging or choppy markets produces random results.
📚 Related Articles:
This article is adapted from The Complete Trader’s Edge
70 chapters covering Mind · Method · Money — the most comprehensive trading education framework available.
Frequently Asked Questions
What is the golden pocket in Fibonacci trading?
The golden pocket is the zone between the 0.618 and 0.702 Fibonacci retracement levels. It is called the golden pocket because of its proximity to the golden ratio (0.618) and because it is the most statistically reliable retracement zone for trend continuation entries. When price pulls back into the golden pocket during a trending market and finds support (or resistance, for shorts), the probability of continuation is significantly higher than at other retracement levels.
How do I draw Fibonacci retracements correctly?
For a bullish retracement: draw from the swing low (0) to the swing high (1). The retracement levels appear below the high, showing where price might pull back to. For a bearish retracement: draw from the swing high (0) to the swing low (1). The retracement levels appear above the low. The key levels to watch are 0.382, 0.5, 0.618, 0.702, and 0.786. Use significant market structure swing points, not minor wicks.
Do Fibonacci levels actually work, or is it self-fulfilling prophecy?
Both, and that is fine. Fibonacci levels work because many traders watch them (creating self-fulfilling reactions) and because they often align with genuine structural levels where institutional orders rest. Whether the cause is mathematical harmony or collective belief does not matter for profitability. What matters is that price reacts at these levels with sufficient frequency to produce an edge when combined with other confluence factors.
Should I use Fibonacci on every trade?
Not on every trade, but on every pullback entry in a trending market. Fibonacci retracements are most valuable when a clear impulse move has occurred and you are looking for the optimal retracement level to enter a continuation trade. They are less useful in ranging markets where no clear swing points exist. Combine Fibonacci with Order Blocks and Fair Value Gaps for the highest-confluence entries.
What is the difference between Fibonacci retracements and extensions?
Retracements measure how far price pulls back within an existing move (used for entries). Extensions measure how far price might travel beyond the initial move (used for targets). The key extension levels are 1.272, 1.618, and 2.0. For example, if an impulse move was 100 pips, the 1.618 extension projects a target of 161.8 pips from the retracement low. Use retracements for entries and extensions for target setting.
From The Book
This article covers concepts from Chapter 36 of The Complete Trader’s Edge.
 The Complete Trader's Edge
The full Mind · Method · Money framework. 70 chapters.
View on Amazon →
The Complete Trader's Edge
The full Mind · Method · Money framework. 70 chapters.
View on Amazon →
 Market Mayhem
400 years of bubbles, crashes, and the pattern that keeps repeating.
Buy on Amazon →
Market Mayhem
400 years of bubbles, crashes, and the pattern that keeps repeating.
Buy on Amazon →
 Greatest Companies
How the world's greatest companies were built — and what traders learn from them.
View on Amazon →
Greatest Companies
How the world's greatest companies were built — and what traders learn from them.
View on Amazon →
 Greatest Traders
Eighty-six lives that explain the markets — Livermore to Madoff, told with the losses left in.
View on Amazon →
Greatest Traders
Eighty-six lives that explain the markets — Livermore to Madoff, told with the losses left in.
View on Amazon →