You open a long on Gold at the London open. Forty minutes later, a setup forms on NQ that meets all your criteria. You take it. You now have two live trades, both entered on valid setups, both with clean stop losses. Technically, you’ve risked 1% on each. So your total risk is 2%. Except it isn’t. Not really.
If the US dollar strengthens sharply — on an unexpected Fed statement, a hot CPI print, or a risk-off move — Gold sells off and NQ sells off simultaneously. Your two “separate” 1% risks behave as one 2% risk because they’re correlated. This is correlation risk, and it’s one of the least-discussed forms of exposure in the retail trading community.
What Correlation Risk Actually Means
Correlation in financial markets describes how consistently two instruments move in the same direction relative to a common driver. A correlation coefficient of +1.0 means the instruments move identically. A coefficient of -1.0 means they move in perfect opposition. Zero means no relationship.
In practice, most correlations are partial and conditional. Gold and NQ might have a correlation of -0.35 in normal market conditions (modest inverse relationship driven by risk-on/risk-off dynamics) but spike to -0.75 or higher during rapid dollar strengthening events. The correlation that matters to you as a trader is not the average. It’s the correlation during the type of market move that triggers your stop loss.
When markets become stressed, correlations tend to converge toward the extremes. Everything risk-on falls together. Everything risk-off rises together. The diversification you thought you had disappears at exactly the moment you need it most.
The Core Correlations Every Multi-Market Trader Must Know
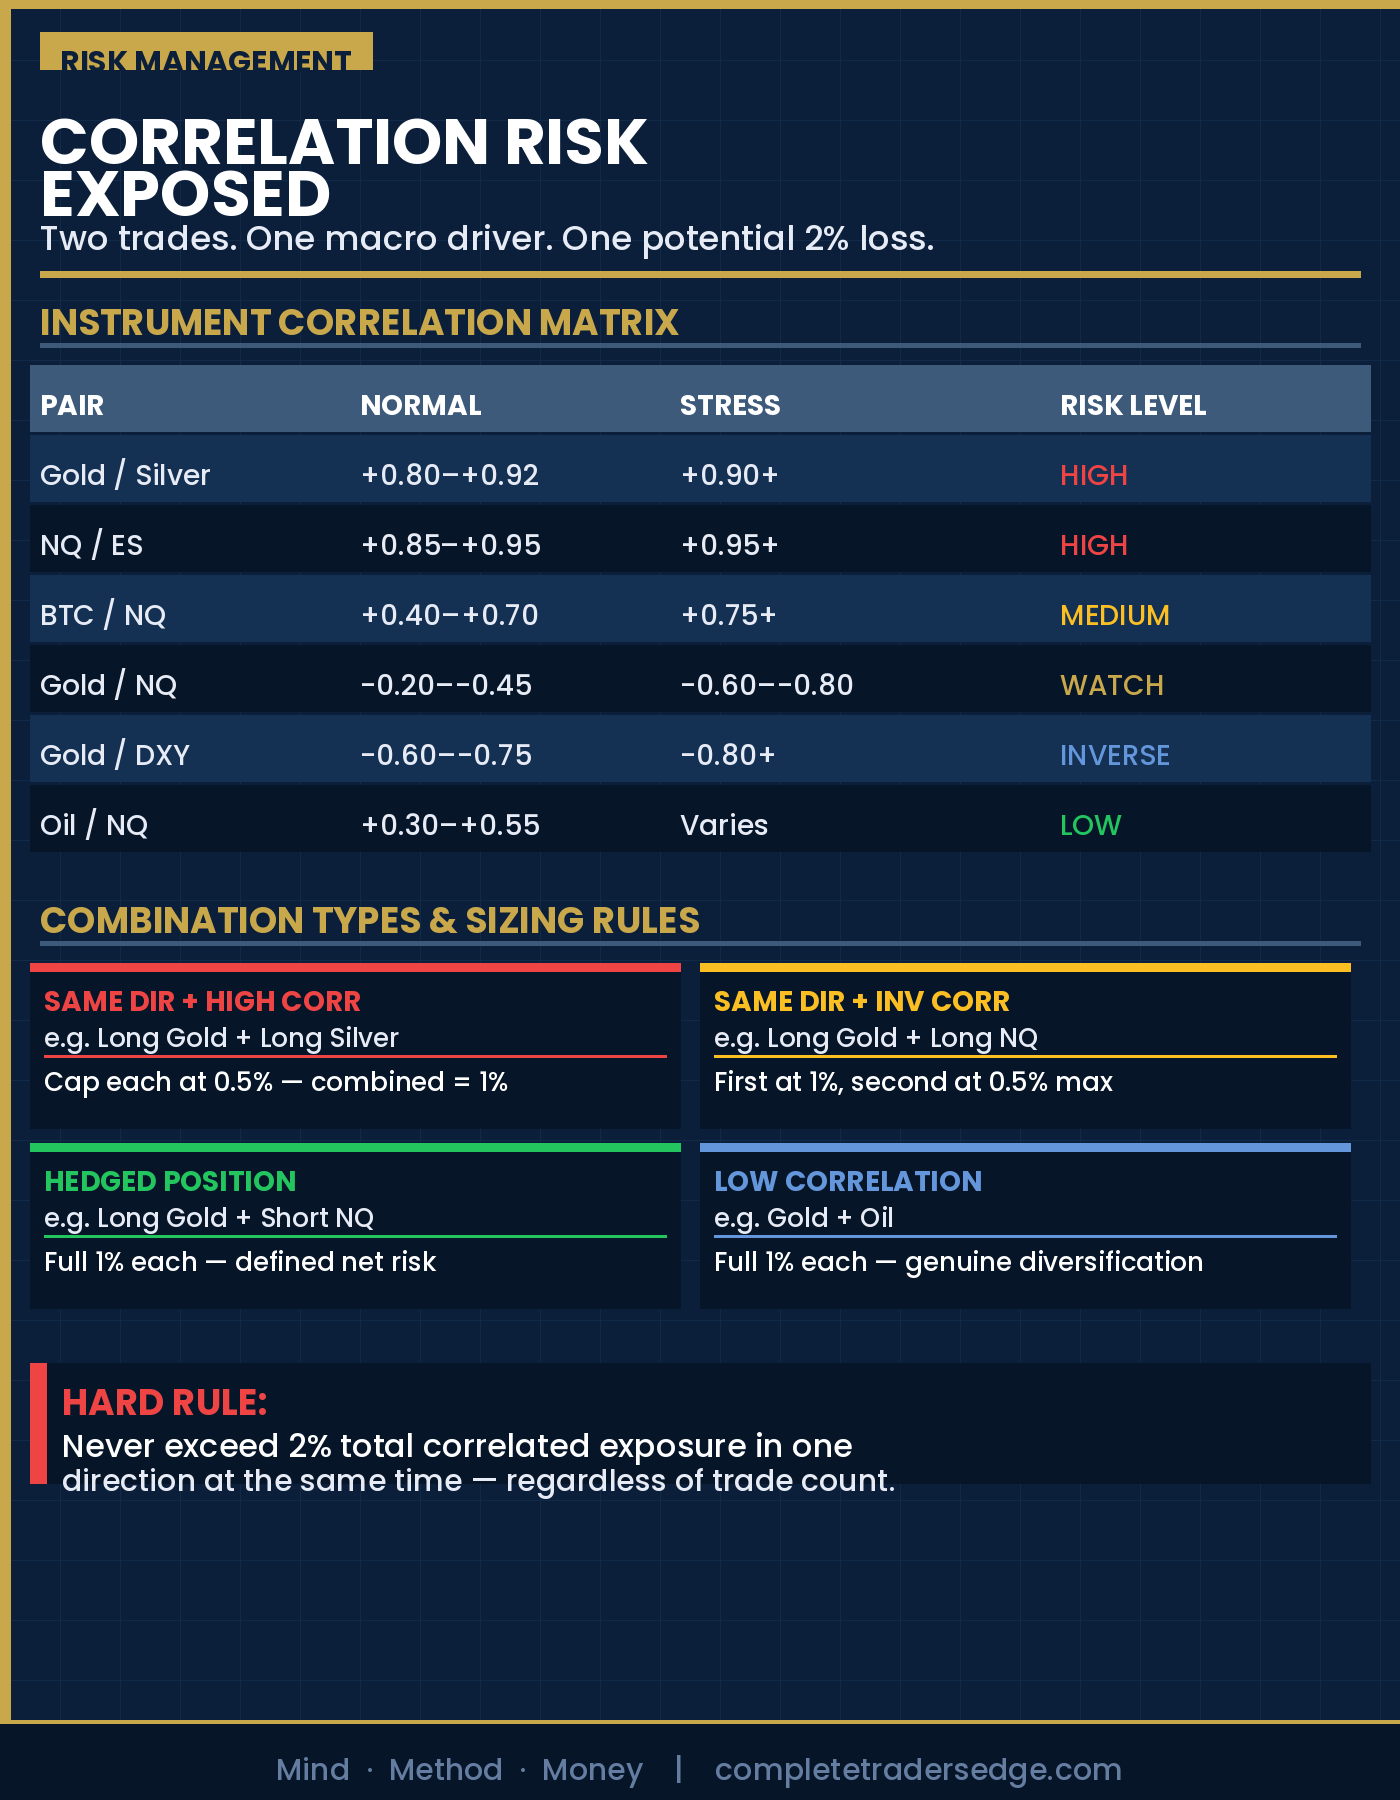
These are the primary correlation relationships relevant to a trader working with Gold, Silver, BTC, Oil, NQ, and ES:
| Pair | Normal Correlation | Stress Correlation | Common Driver |
|---|---|---|---|
| Gold / Silver | +0.80 to +0.92 | +0.90+ | USD, real rates |
| NQ / ES | +0.85 to +0.95 | +0.95+ | Risk appetite, rates |
| Gold / NQ | -0.20 to -0.45 | -0.60 to -0.80 | USD strength, risk |
| Oil / NQ | +0.30 to +0.55 | Varies widely | Growth expectations |
| BTC / NQ | +0.40 to +0.70 | +0.75+ | Risk appetite, liquidity |
| Gold / USD Index | -0.60 to -0.75 | -0.80+ | Direct inverse |
The most dangerous combination for a typical ICT/SMC trader is long Gold + long NQ simultaneously. In normal conditions these have modest negative correlation, so holding both is largely fine. But in a rapid USD-strengthening event (hawkish Fed, hot inflation print, dollar safe-haven bid), Gold drops and NQ drops together. Both stops hit within the same 30-60 minute window. Your 2% total risk becomes a 2% loss in one move.
The Four Combination Types and Their Risk Profiles
High Correlation Same Direction (Avoid Unless Intentional)
Long Gold + Long Silver. Long NQ + Long ES. BTC long + risk-on equity long. These combinations multiply your real exposure. If your setup rationale for both trades is identical (bullish risk appetite, weak dollar), you are not diversifying. You are doubling down on the same theme. Treat the combined position as one trade and apply the 1% rule to the total, not to each individual leg.
Inverse Correlation Opposite Direction (Hedged Position)
Long Gold + Short NQ. This is a deliberate macro hedge: you’re expressing a “risk-off / dollar strength” view. If the thesis plays out, both sides move in your favour. If it doesn’t, the losses should partially offset. This combination is lower risk than it appears from the individual stop levels, but it requires that your thesis is correct. Don’t end up long Gold and short NQ accidentally by taking two separate setups.
Inverse Correlation Same Direction (Manage Carefully)
Long Gold + Long NQ on separate setups. This is the scenario from the opening paragraph. In normal conditions it is manageable. Your combined risk should be sized to account for the possibility of simultaneous stop-outs. A practical rule: if both trades have the same dollar risk, treat the total as 1.5x single-trade risk, not 2x. This reflects the partial negative correlation that normally exists between them.
Low or Uncorrelated (Genuinely Diversified)
Gold + Oil. BTC + Gold. These pairs have lower correlation and the relationship is more conditional. Holding both at full 1% risk each is closer to genuine risk diversification. Still be aware of the common driver during macro shocks: in a severe risk-off event, nearly everything sells off together regardless of normal correlations.
The Practical Position Sizing Rule for Correlated Instruments
Here is a simple, applicable framework. Before entering any new trade, ask: “Do I currently have any open position that shares the same macro driver?”
If yes, apply this sizing rule:
Highly correlated (r > 0.7) same direction: Reduce each position to 0.5% risk. Combined exposure stays at 1%.
Moderately correlated (r 0.4-0.7) same direction: Reduce each to 0.75% risk. Combined effective exposure: approximately 1.25%.
Inversely correlated opposite direction (hedge): Full 1% on each. Monitor total exposure as a risk-defined hedge.
Inversely correlated same direction (e.g. long Gold + long NQ): Full 1% on first trade, 0.5-0.75% on second depending on current macro environment. Raise the second to full 1% only once the first trade is at breakeven or better.
Session Timing and Correlation Spikes
Correlations between instruments are not constant through the trading day. They spike at high-impact macro events and during the New York session overlap with London (07:00-10:00 AM New York time).
During the New York Kill Zone specifically, Gold and NQ often move most strongly in correlated fashion because both are heavily traded by US institutional money. If you’re managing multiple correlated positions heading into this session, be aware that correlations will likely be higher than their daily averages.
News events are the highest-risk moments. An FOMC decision, NFP print, or CPI release can drive a 10-15 minute period of extremely high cross-asset correlation. Every risk-on asset falls simultaneously. Every risk-off asset rises simultaneously. During these windows, holding 2% of correlated risk is holding 2% risk in a near-certainty of simultaneous movement.
The rule applies here: reduce size to zero on red-folder news. If you have correlated positions on both sides of a news event, close or significantly reduce before the release. The trade will still be there after the volatility settles.
A Real Example: Gold Long + NQ Long During NFP
Gold at $2,340 shows a textbook bullish OB entry after sweeping the Asia low. NQ at 18,200 forms a clean liquidity sweep of the prior week’s low with a 15-minute FVG entry. You take both. 1% risk each. Total: 2%.
NFP prints hot (higher than expected). Dollar spikes. Gold drops 180 pips. NQ drops 350 points. Both stops hit within 12 minutes of each other. Total loss: 2% in one event.
Now replay the same scenario with correlation-adjusted sizing. You entered Gold first at 1% risk. NQ setup forms; because you have an open Gold long with the same “risk-off / weak dollar” macro dependency, you enter NQ at 0.5% risk. Same NFP print, same stops hit. Total loss: 1.5%. You’ve reduced the impact of the correlated shock by 25% without changing a single entry or exit point.
Over 200 trading days, these adjustments compound into meaningful capital preservation. The win rate stays the same. The position sizing logic changes what happens on the bad days.
Tracking Correlation Exposure in Your Journal
Add a single column to your trade journal: “Correlated exposure at entry.” Before every trade, note whether you have any open positions in correlated instruments and the combined directional exposure. This takes 15 seconds and creates a visible record of your actual risk at the time of entry, not just the textbook 1% per trade figure.
Review this column monthly. Identify your 5 largest single-day losses. In most cases, you’ll find that the worst days involved correlated positions with the same macro driver being hit simultaneously. This data changes how you approach the problem going forward.
Frequently Asked Questions
Is it ever acceptable to trade Gold and NQ at the same time?
Yes, with adjusted sizing. Long Gold and long NQ simultaneously is manageable if you treat the second position as a partial add rather than a full 1% trade. Enter the first setup at 1%, then cap the second correlated trade at 0.5-0.75% risk. Once the first trade is at breakeven or better, you can bring the second to full size if the setup still holds. The goal is not to avoid correlated trades; it’s to size them so a simultaneous stop-out doesn’t breach your daily loss limit.
How do I check the current correlation between instruments?
TradingView has a built-in correlation indicator (search “Correlation Coefficient” in indicators). Set the period to 20-30 days for a medium-term view. For a quick check before entering a trade, look at the last 2-3 weeks of daily charts side by side and assess whether both instruments have been trending in the same direction. The correlation table in this article provides a baseline; your job is to notice when current conditions deviate from the norm.
Does BTC correlate with Gold or with equities?
BTC’s correlation is regime-dependent. In risk-on environments, BTC tends to correlate positively with NQ (both benefit from liquidity and risk appetite). In macro stress events, BTC often sells off with equities. BTC’s correlation with Gold is weaker and more variable. For position sizing purposes, treat a long BTC + long NQ position the same way you’d treat moderately correlated same-direction exposure: cap the combined exposure at 1.5% total rather than the theoretical 2%.
What is the biggest correlation mistake retail traders make?
Treating every trade as independent when the market is treating them as linked. The most common version: a trader enters long Gold, long Silver, and long NQ across three separate sessions, each at 1% risk, believing they have 3 separate trades. In reality they have one “long risk, short dollar” trade expressed three times with 3% total exposure. A single macro catalyst can close all three positions simultaneously. The fix is simple: identify the common macro driver before entering any new position, then apply the correlation-adjusted sizing framework.
Should I close one position if I want to enter a correlated trade?
Not necessarily. The preferred approach is to size down, not close out. If you have a full 1% long Gold trade running and a high-quality NQ long sets up, enter NQ at 0.5% rather than passing on it or closing Gold. This preserves exposure to both setups while controlling the correlated downside. Closing the first trade to take the second means you’re making a binary choice between two valid setups based on which one came first. Position sizing lets you hold both at a managed combined risk.
▶ CONTINUE READING
Complete your risk management framework:
▶ Prop Firm Risk Calculator: How to Size Every Trade on a Funded Account
The Complete Trader’s Edge
Chapter 58 covers portfolio-level risk including correlation management, instrument selection, and how to build a multi-market watchlist without stacking correlated exposure.
 The Complete Trader's Edge
The full Mind · Method · Money framework. 70 chapters.
View on Amazon →
The Complete Trader's Edge
The full Mind · Method · Money framework. 70 chapters.
View on Amazon →
 Market Mayhem
400 years of bubbles, crashes, and the pattern that keeps repeating.
Buy on Amazon →
Market Mayhem
400 years of bubbles, crashes, and the pattern that keeps repeating.
Buy on Amazon →