Supply and demand trading is the framework that most closely mirrors how institutional order flow actually works. Every price movement in every market is the result of an imbalance between buyers and sellers. When demand exceeds supply at a price level, price rises. When supply exceeds demand, price falls. The zones where these imbalances originate are the highest-probability entry points available to any trader, because they represent the price levels where institutional participants committed significant capital.
If you already trade Smart Money Concepts, you will recognise the overlap immediately. Supply zones are the institutional footprint of heavy selling. Demand zones are the footprint of heavy buying. Order blocks, in the ICT framework, are a specific type of supply or demand zone defined by the last opposing candle before an impulsive move. The concepts are complementary, not competing. Understanding supply and demand gives you the macro framework. ICT gives you the precision entry model within it.
What Are Supply and Demand Zones?
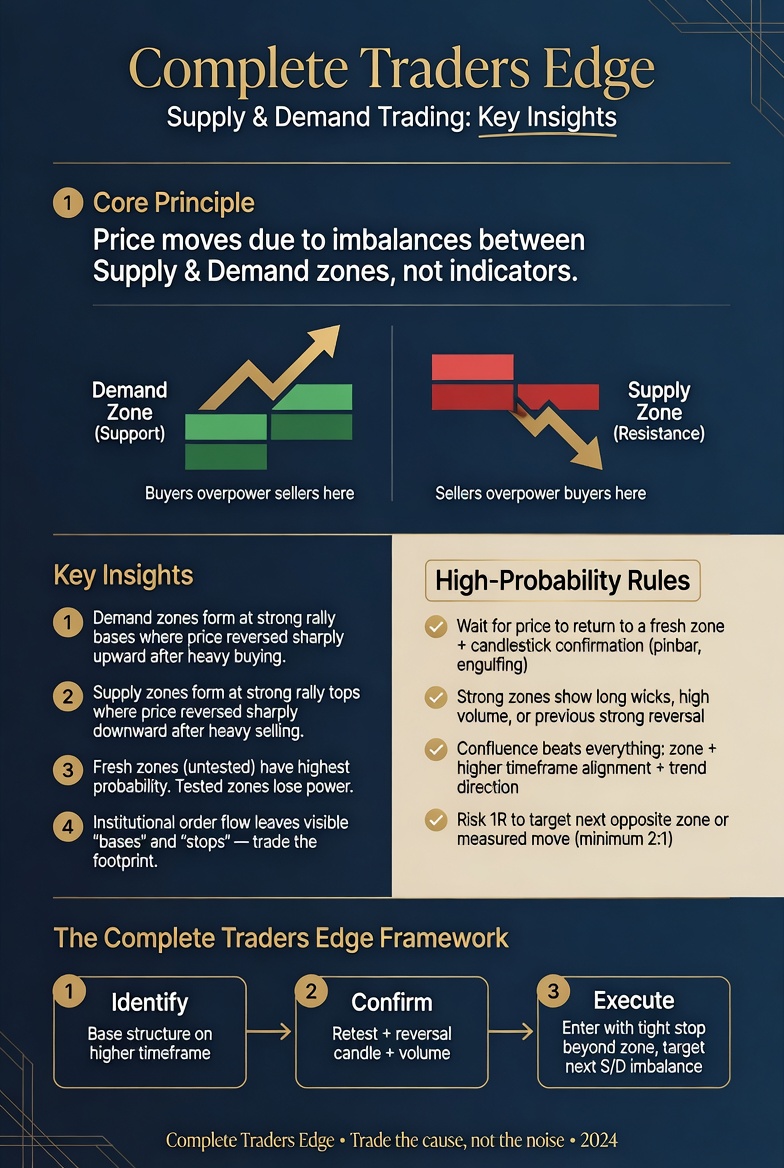
A demand zone is a price area where aggressive buying overwhelmed selling, causing price to move sharply upward. When price returns to this zone, unfilled buy orders from the original move are likely to be resting there, creating a potential floor for price.
A supply zone is a price area where aggressive selling overwhelmed buying, causing price to drop sharply. When price returns to this zone, unfilled sell orders from the original move are likely to be resting there, creating a potential ceiling for price.
The key word is imbalance. Not every zone where price bounced is a genuine supply or demand zone. The defining characteristic is the speed and magnitude of the move away from the zone. A slow, grinding move away from a level suggests balanced order flow. A sharp, impulsive move away suggests that one side overwhelmed the other decisively, and that the zone holds residual institutional interest.
How to Identify High-Quality Supply and Demand Zones
Not all zones are equal. The quality of a supply or demand zone determines whether it is worth trading. Here are the criteria that separate high-probability zones from noise.
| Quality Factor | What to Look For | Why It Matters |
|---|---|---|
| Strength of departure | Strong, impulsive candles away from the zone with full bodies and small wicks | Shows genuine imbalance, not just a bounce |
| Freshness | Zone has not been tested (price has not returned yet) | Untested zones have the most unfilled orders remaining |
| Time spent at the zone | Minimal consolidation before the move (1-3 candles) | Less time = more unfilled orders. Extended consolidation means orders were filled gradually. |
| Move magnitude | Price moved at least 2-3x the zone’s height after leaving | Larger moves indicate larger institutional orders that could not be filled in one attempt |
| Location in structure | Zone aligns with HTF trend direction and key levels | Zones in premium areas (for supply) or discount areas (for demand) have stronger confluence |
Drawing the Zone
A demand zone is drawn from the lowest point of the basing candle(s) to the open of the first impulsive bullish candle. A supply zone is drawn from the highest point of the basing candle(s) to the open of the first impulsive bearish candle. The zone represents the area where the institutional orders were placed, and the edges of the zone define your entry area and your invalidation point.
Use the body of the candles, not just the wicks, to define the core zone. The wicks represent transient price action; the bodies represent where price actually accepted and transacted at volume. Many traders draw zones too wide by including every wick, which dilutes the precision of the entry.
Supply and Demand vs Support and Resistance
Supply and demand zones are not the same thing as support and resistance levels, although they overlap in some situations. Understanding the distinction sharpens your analysis.
| Concept | Supply & Demand Zones | Support & Resistance Levels |
|---|---|---|
| What they represent | Unfilled institutional orders | Price levels where reactions occurred |
| Formation | Sharp imbalance move required | Multiple touches at the same level |
| Number of tests | Strongest on first test (untested) | Often considered “stronger” with more touches |
| Width | Zone (has height and width) | Line or narrow zone |
| Depletion | Weakens with each test (orders filled) | Often assumed to strengthen with tests |
The most important distinction is the concept of freshness. In classical support and resistance analysis, a level that has been tested three times is considered “proven.” In supply and demand analysis, a zone that has been tested three times is weakening because each test fills more of the resting orders. The freshest zones, those that have never been tested, are the highest probability. This aligns perfectly with the ICT concept of untested order blocks being the strongest.
Supply and Demand Through the Smart Money Lens
For traders who already use ICT methodology, supply and demand zones map directly onto the framework you already know.
| Supply & Demand Term | ICT Equivalent | Notes |
|---|---|---|
| Demand zone | Bullish order block | Both mark where institutional buying occurred |
| Supply zone | Bearish order block | Both mark where institutional selling occurred |
| Imbalance move | Displacement + Fair Value Gap | The sharp move away from the zone that confirms institutional intent |
| Zone break | Breaker block | When a zone fails and flips polarity |
| Rally-Base-Drop | OB in premium zone | Supply formed after a rally, aligning with institutional distribution |
| Drop-Base-Rally | OB in discount zone | Demand formed after a drop, aligning with institutional accumulation |
The advantage of understanding both frameworks is that supply and demand gives you the macro zone identification (where on the chart to look), while ICT gives you the micro entry model (exactly where within that zone to enter, with which candle confirmation, and where to place your stop).
The Four Zone Formation Patterns
Supply and demand zones form in four distinct patterns, each with different implications for reliability and the type of move to expect.
Rally-Base-Rally (RBR): Price rallies, pauses briefly (base), then rallies again. The base is a demand zone. This pattern forms during strong uptrends and represents a continuation. It is the highest-probability demand zone in a trending market.
Drop-Base-Drop (DBD): Price drops, pauses briefly, then drops again. The base is a supply zone. This is the bearish equivalent, a continuation pattern that forms during strong downtrends.
Rally-Base-Drop (RBD): Price rallies, pauses at a peak, then drops sharply. The base is a supply zone that formed a reversal. These zones often appear at major swing highs and represent institutional distribution.
Drop-Base-Rally (DBR): Price drops, pauses at a trough, then rallies sharply. The base is a demand zone that formed a reversal. These zones appear at major swing lows and represent institutional accumulation.
| Pattern | Zone Type | Signal | Best In |
|---|---|---|---|
| Rally-Base-Rally | Demand | Trend continuation (bullish) | Uptrends |
| Drop-Base-Drop | Supply | Trend continuation (bearish) | Downtrends |
| Rally-Base-Drop | Supply | Reversal (bearish) | Swing highs, tops |
| Drop-Base-Rally | Demand | Reversal (bullish) | Swing lows, bottoms |
The highest-probability approach is to trade continuation zones (RBR and DBD) in the direction of the higher-timeframe trend. Reversal zones (RBD and DBR) require additional confirmation because you are trading against the prevailing momentum.
How to Trade Supply and Demand Zones: The Step-by-Step Process
Step 1: Identify the higher-timeframe trend. Use the daily or 4-hour chart to determine whether the market is in an uptrend, downtrend, or range. Supply and demand trading works best with the trend, not against it.
Step 2: Mark the zones on the higher timeframe. Identify the most recent untested supply zones (in a downtrend or at swing highs) and demand zones (in an uptrend or at swing lows) on the 4-hour or daily chart.
Step 3: Wait for price to approach the zone. Do not anticipate. Wait for price to actually enter the zone before looking for an entry trigger.
Step 4: Drop to the lower timeframe for entry. When price enters your marked zone on the higher timeframe, switch to the 15-minute or 5-minute chart and look for an entry signal: a rejection candle, a displacement candle, an order block, or an FVG that forms within the zone.
Step 5: Place your stop beyond the zone. If you are entering at a demand zone, your stop goes below the lowest point of the zone. If entering at a supply zone, your stop goes above the highest point. The zone is your invalidation. If price moves through it, the thesis is wrong.
Step 6: Target the opposing zone or the next structural level. In an uptrend, a demand zone entry targets the nearest supply zone above. In a downtrend, a supply zone entry targets the nearest demand zone below. This gives you clear, pre-defined R:R before you enter the trade.
Adding Confluence: Volume Profile, Fibonacci, and AVWAP
A supply or demand zone becomes significantly more powerful when it aligns with other institutional reference levels. The blended approach adds these confluence layers.
Volume Profile POC/VAH/VAL: A demand zone that aligns with the Value Area Low (VAL) on the previous session’s Volume Profile has double institutional significance. The zone shows where buyers stepped in before; the VAL shows where the lower edge of institutional value sits. Together, they create a reinforced floor.
Fibonacci Golden Pocket: A demand zone that sits within the 0.618-0.702 Fibonacci retracement of the most recent swing gives you triple confluence: supply/demand logic, Fibonacci mathematics, and the OTE (Optimal Trade Entry) zone from ICT methodology all pointing to the same price area.
Anchored VWAP: An AVWAP drawn from a significant swing low that passes through your demand zone adds another institutional reference line. If the AVWAP, the demand zone, and the Fibonacci level all overlap within 10-20 pips of each other, you have one of the highest-probability entry conditions available.
Common Mistakes in Supply and Demand Trading
Trading every zone. Not every zone is tradeable. Zones that are far from the current price, zones that have already been tested twice, and zones that formed with low-conviction moves should be ignored. Focus on the freshest, cleanest, highest-departure zones in the direction of the trend.
Making zones too wide. A zone that covers 200 pips on gold is not useful because your stop distance makes the R:R unworkable. Tight, precise zones using candle bodies rather than extended wicks produce better entries and tighter stops.
Ignoring the trend. Demand zones in a strong downtrend get broken. Supply zones in a strong uptrend get broken. Always trade zones that align with the higher-timeframe direction. Counter-trend zone trades should be reserved for clear reversal patterns with strong additional confluence.
Holding after the zone breaks. If price closes decisively through your zone (not just a wick through it, but a full-body close), the zone has failed. The institutional orders are absorbed. Exit immediately. A broken demand zone often becomes a supply zone (this is the ICT breaker block concept), and vice versa.
5 Frequently Asked Questions About Supply and Demand Trading
How is supply and demand different from ICT order blocks?
Supply and demand is the broader framework; order blocks are a specific identification method within it. A demand zone might span 3-5 candles of basing activity before a move. An order block is specifically the last bearish candle before a bullish move (or vice versa). You can use supply and demand zones to identify the macro area of interest and then use the order block within that zone as your precise entry point.
Should I use supply and demand on all timeframes?
Mark zones on the 4-hour and daily charts for swing trades, and on the 1-hour and 15-minute charts for intraday trades. Do not mark zones on the 1-minute chart; the noise overwhelms the signal. Multi-timeframe analysis works best: identify zones on the higher timeframe, enter on the lower timeframe.
How many times can a zone be tested before it fails?
There is no fixed number, but the general principle is that each test weakens the zone because resting orders are being filled. The first test is the highest probability. The second test is still viable but weaker. A third test of the same zone is significantly weaker and often leads to a break. If a zone has been tested twice already, skip it and look for fresher zones.
Can I use supply and demand on crypto?
Yes. Supply and demand works on any liquid market. Bitcoin, Ethereum, and other major cryptocurrencies form clean supply and demand zones because institutional participation has grown significantly. The same principles apply: look for sharp departures, fresh zones, and trade in the direction of the higher-timeframe trend.
What is the best indicator for supply and demand?
Supply and demand is best identified manually by reading price action. Automated indicators that draw zones for you often identify too many zones, include low-quality formations, and cannot assess context. If you want a tool to assist, Volume Profile is the most useful complement because it shows where real volume transacted, confirming whether a zone had genuine institutional participation.
▶ Continue Reading
▸ Order Blocks: Identifying Where Institutions Left Their Footprint
▸ Fair Value Gaps (FVG): The Complete ICT Guide to Trading Imbalances
The Complete Trader’s Edge
This article is adapted from The Complete Trader’s Edge by Louw van Riet. The book covers supply and demand, ICT order blocks, risk management, and the complete Mind · Method · Money framework across 70 chapters.
 The Complete Trader's Edge
The full Mind · Method · Money framework. 70 chapters.
View on Amazon →
The Complete Trader's Edge
The full Mind · Method · Money framework. 70 chapters.
View on Amazon →
 Market Mayhem
400 years of bubbles, crashes, and the pattern that keeps repeating.
Buy on Amazon →
Market Mayhem
400 years of bubbles, crashes, and the pattern that keeps repeating.
Buy on Amazon →
 Greatest Companies
How the world's greatest companies were built — and what traders learn from them.
View on Amazon →
Greatest Companies
How the world's greatest companies were built — and what traders learn from them.
View on Amazon →