How asset classes relate — stocks vs bonds, DXY vs gold, risk-on/risk-off — and why it matters for multi-market traders.
Most retail traders analyse one chart in isolation. They see a bullish order block on gold and go long. They see a bearish FVG on Bitcoin and go short. They never ask whether the US dollar is strengthening, whether bond yields are rising, or whether the VIX is spiking. They trade in a vacuum.
| Correlation | Relationship | Trading Implication |
|---|---|---|
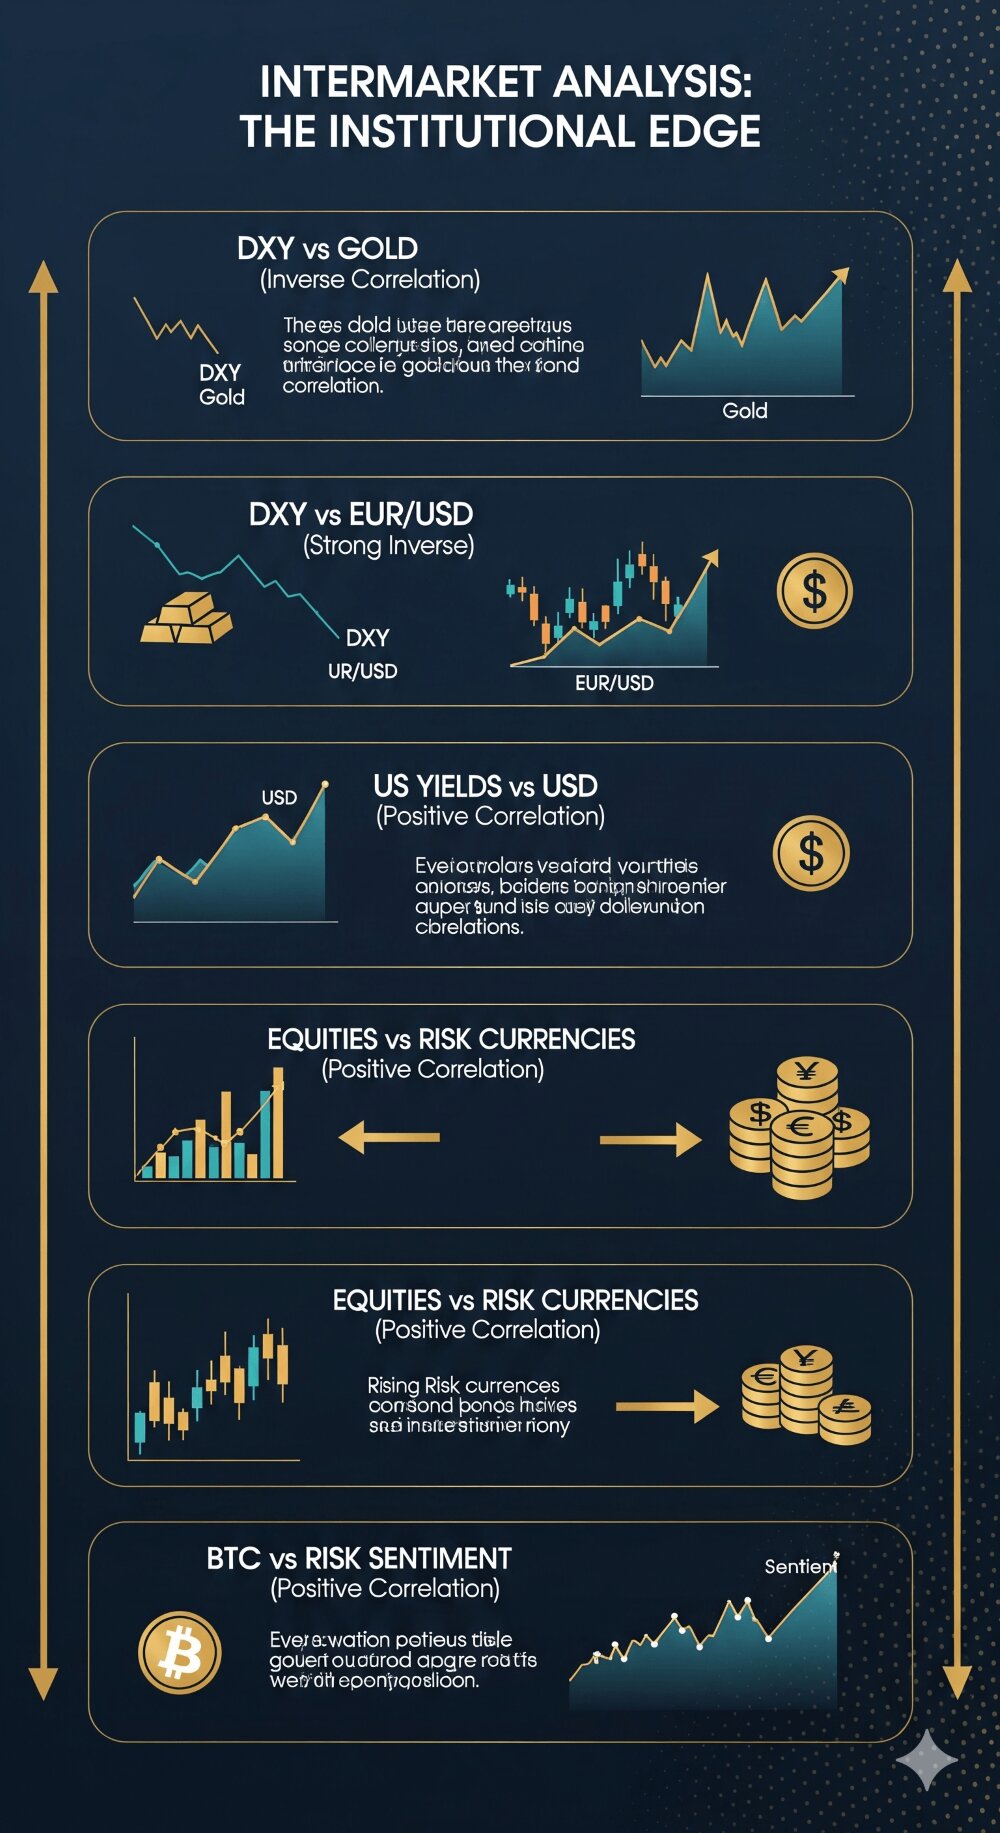
| DXY vs Gold | Inverse (strong) | Rising DXY = headwind for Gold longs. Falling DXY = tailwind. |
| DXY vs EUR/USD | Inverse (very strong) | DXY trending up = EUR/USD trending down. Check DXY before trading EUR. |
| US yields vs USD | Positive | Rising yields attract capital to USD. Strengthens dollar, pressures Gold. |
| Equities vs Risk currencies | Positive | Risk-on (stocks up) = AUD, NZD strengthen. Risk-off = JPY, CHF strengthen. |
| BTC vs Risk sentiment | Positive (increasingly) | BTC trades as a risk asset. Equity selloffs drag BTC. Risk rallies lift it. |
Institutional traders do not. Before a bank’s trading desk takes a position in gold, they check what the dollar is doing. Before they buy equities, they check what bonds are pricing. Before they add risk, they check the volatility index. These cross-market relationships are not optional for professionals — they are the first filter applied before any single-chart analysis begins.
This chapter gives you that institutional lens. You do not need to trade multiple markets. But understanding how they interact will prevent you from being blindsided by macro moves and will add a confirmation layer that single-chart analysis cannot provide.
The Four Asset Classes
Global financial markets are built on four asset classes: equities (stocks), bonds (fixed income), commodities (gold, oil, agricultural products), and currencies (forex). Each reacts to economic conditions differently, and their interactions create a web of relationships that institutional traders monitor constantly.
In a healthy, growing economy, equities tend to rise as corporate earnings increase. Bonds tend to fall as interest rates rise. Commodities tend to rise as demand increases. In a contracting economy, the relationships flip. Understanding which regime you are in — expansion or contraction — tells you which relationships to expect.
The Dollar Index (DXY)
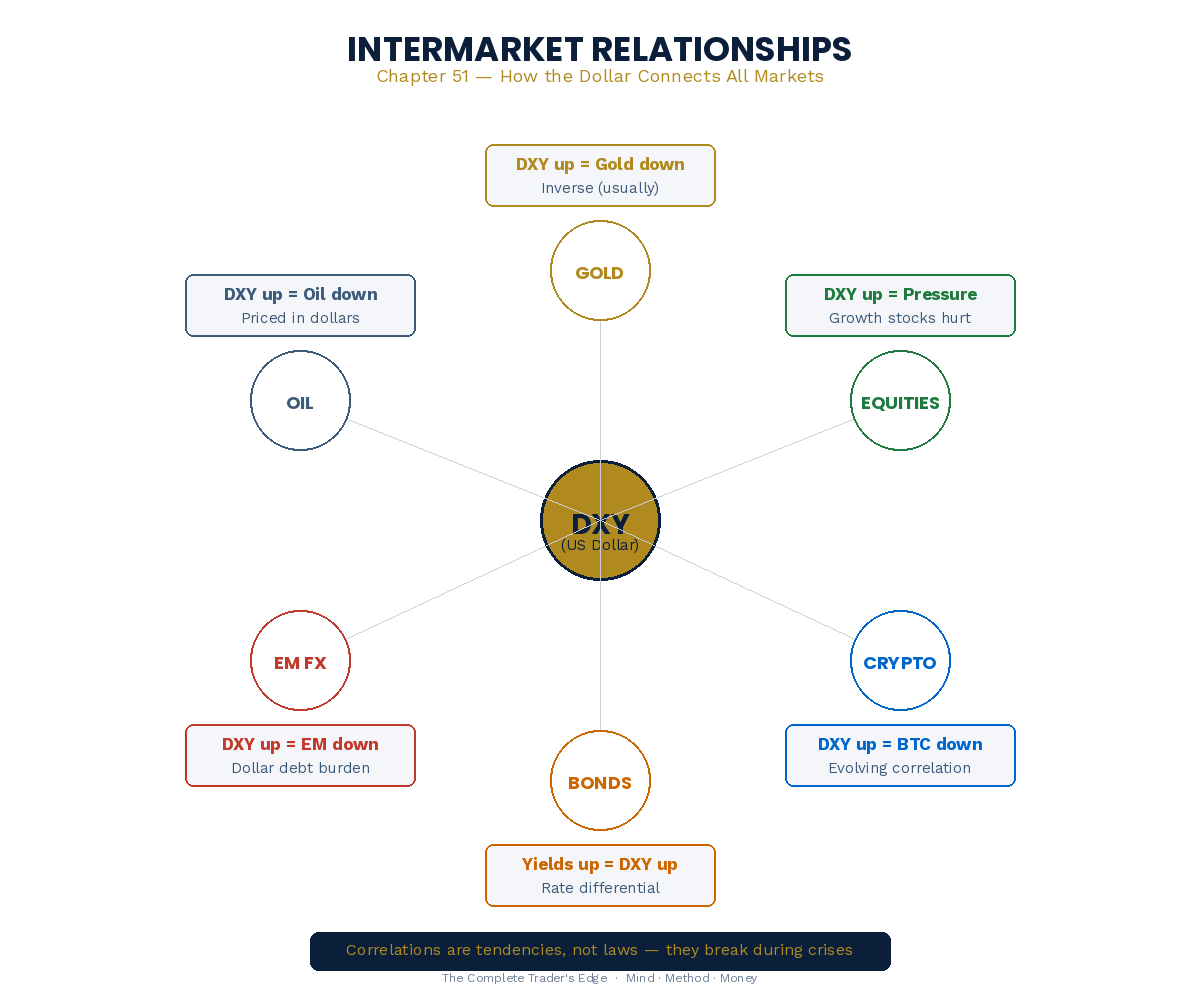
If you trade only one intermarket relationship, make it the US Dollar Index. DXY measures the dollar’s strength against a basket of major currencies (primarily the Euro, which accounts for nearly 58% of the index). It is the single most important macro variable because nearly every asset in the world is priced, traded, or benchmarked against the dollar.
When DXY strengthens, dollar-denominated commodities become more expensive for foreign buyers, which typically pressures prices lower. Emerging market currencies and assets also come under pressure. When DXY weakens, commodities tend to rise, emerging markets outperform, and risk appetite generally increases.
For crypto traders, the DXY-Bitcoin relationship has become increasingly relevant. BTC tends to perform poorly during periods of dollar strength and well during periods of dollar weakness, though this correlation has broken during some periods.
Before your trading session begins, check DXY. If it is moving strongly in one direction, your commodity and forex trades should be aligned with the dollar’s move, not fighting it.
Bonds and Equities
The traditional relationship between bonds and equities is inverse: when stocks fall, bonds rise, and vice versa. This held reliably for most of the 2000s and 2010s. But in 2022, it broke — both stocks and bonds fell simultaneously as central banks raised rates aggressively. Correlations are not laws. They are tendencies that hold under certain macroeconomic conditions and break under others.
The practical signal to watch is the US 10-Year Treasury yield. When the 10-Year yield rises sharply, growth stocks come under pressure because higher discount rates reduce the present value of future earnings. If you trade equity indices like the Nasdaq, the 10-Year yield is the most important single variable outside of the index itself.
Gold and Real Yields
Gold’s relationship with interest rates is often misunderstood. Gold responds to real interest rates — the nominal rate minus inflation. When real yields are negative, gold tends to rise because holding cash loses purchasing power. When real yields are positive and rising, gold tends to struggle. Track this through TIPS (Treasury Inflation-Protected Securities) yields.
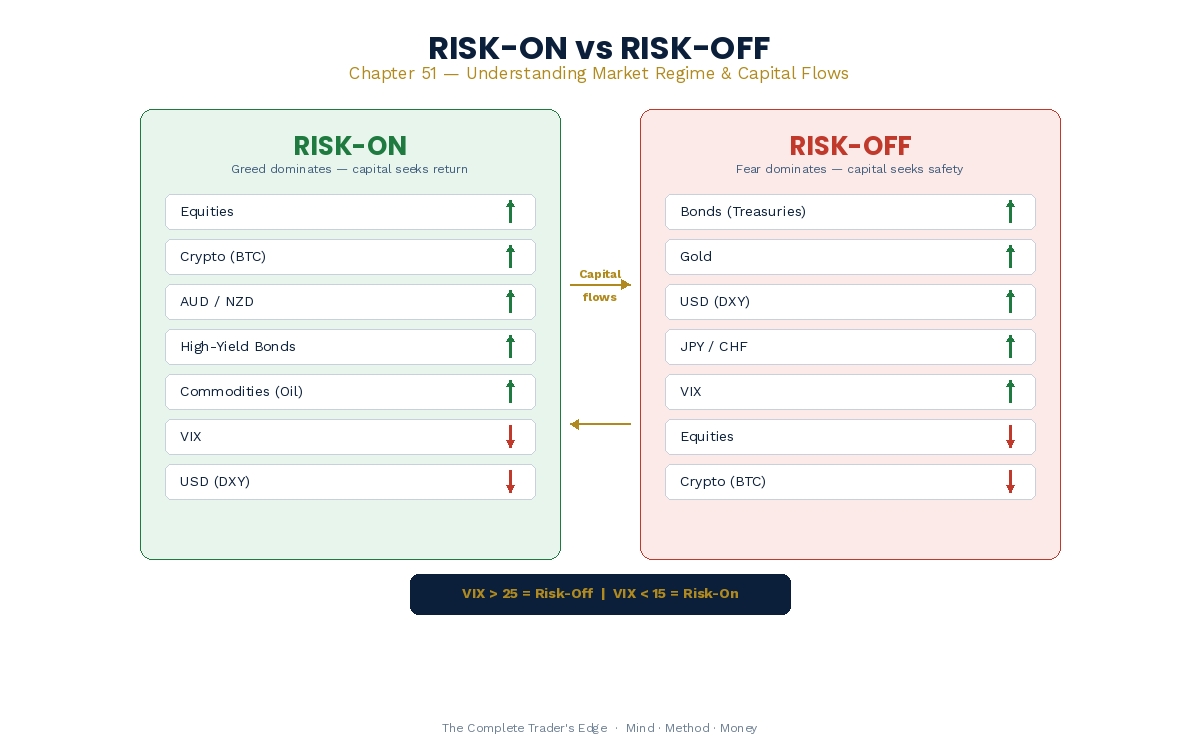
Risk-On vs Risk-Off
The simplest intermarket framework is the risk-on/risk-off binary. In risk-on environments, capital flows into equities, high-yield bonds, commodity currencies (AUD, NZD, CAD), emerging markets, and Bitcoin. In risk-off environments, capital flows into US Treasuries, the US dollar, the Japanese yen, the Swiss franc, and gold.
The VIX (CBOE Volatility Index) is the most widely used barometer. A low VIX (below 15–18) indicates complacency. A VIX spike above 25–30 typically coincides with aggressive risk-off moves across all asset classes. During extreme risk-off events, correlations tighten dramatically — assets that normally move independently begin moving together because the only trade that matters is reducing exposure.
Crypto Correlations
Bitcoin’s evolving relationship with the Nasdaq — its decoupling periods and why CME BTC futures track traditional risk sentiment more closely than spot — makes intermarket analysis particularly relevant for crypto traders. When DXY weakens and equities rally, crypto tends to follow. When the VIX spikes, crypto sells off alongside traditional risk assets.
Practical Application: The Daily Pre-Session Filter
Before you open a single chart, check three things: DXY (which direction is the dollar moving?), bonds (is the 10-Year yield rising or falling?), and VIX (is volatility expanding or contracting?). If all three align with your trade thesis, proceed. If they conflict, proceed with caution or reduce size. If they directly oppose your thesis, step aside.
This takes less than five minutes and prevents the most common macro blindside — being on the wrong side of a move that is being driven by forces you were not watching.
📚 Related Articles:
This article is adapted from The Complete Trader’s Edge
70 chapters covering Mind · Method · Money — the most comprehensive trading education framework available.
Frequently Asked Questions
What is intermarket analysis?
Intermarket analysis is the study of how different financial markets (currencies, bonds, commodities, equities) influence each other. For traders, the most important correlations include: US Dollar Index (DXY) vs Gold (inverse), bond yields vs currency strength (positive for the issuing country), and equity indices vs risk sentiment (risk-on vs risk-off dynamics). Understanding these relationships provides directional context that pure chart analysis cannot.
How does DXY affect my forex trades?
The US Dollar Index measures USD strength against a basket of major currencies. When DXY rises, USD-denominated pairs (EUR/USD, GBP/USD, AUD/USD) tend to fall. When DXY falls, they tend to rise. Gold also moves inversely to DXY. Checking DXY before trading USD pairs gives you a macro directional filter that supplements your market structure analysis.
Why do Gold and the US Dollar move inversely?
Gold is priced in USD. When the dollar strengthens, Gold becomes more expensive for holders of other currencies, reducing demand and pushing the price down. Additionally, Gold is a safe haven that competes with USD-denominated assets: when interest rates rise (strengthening USD), the opportunity cost of holding non-yielding Gold increases, making bonds more attractive by comparison.
How do bond yields affect trading?
Rising bond yields in a country attract capital (higher returns), strengthening that country’s currency. Falling yields push capital out, weakening the currency. The US 10-year Treasury yield is particularly important: rising US yields tend to strengthen USD and weaken Gold. Central bank rate decisions directly influence bond yields, which is why economic calendar awareness matters.
Do I need to watch intermarket correlations every day?
Not in detail, but a quick 2-minute check of DXY direction and US yields as part of your pre-session routine provides valuable context. If DXY is trending strongly up, your bullish Gold thesis has a headwind. If yields are collapsing, your USD longs face resistance. These macro filters take seconds to check and prevent trades that fight the broader flow.
Continue Reading
From The Book
This article covers concepts from Chapter 42 of The Complete Trader’s Edge.
 The Complete Trader's Edge
The full Mind · Method · Money framework. 70 chapters.
View on Amazon →
The Complete Trader's Edge
The full Mind · Method · Money framework. 70 chapters.
View on Amazon →
 Market Mayhem
400 years of bubbles, crashes, and the pattern that keeps repeating.
Buy on Amazon →
Market Mayhem
400 years of bubbles, crashes, and the pattern that keeps repeating.
Buy on Amazon →