Market Mayhem · Episode 09 · October 19, 1987 · Global
508 Points in 508 Minutes
The Largest Single-Day Percentage Decline in Stock Market History
Black Monday: the crash that portfolio insurance was designed to prevent — and inadvertently caused.
▶ Watch on YouTube🎵 Listen on Spotify
Also available on Apple Podcasts · Amazon Music · iHeart Radio
📄 Free Download · Episode Research Sheet
Black Monday 1987 Research Sheet (PDF)
The full timeline, key numbers, the Mind, Method, Money lessons, and further reading from this episode. Free, no email required.
At 9:30 on the morning of October 19th, 1987, the opening bell of the New York Stock Exchange rang. Before the echo cleared the trading floor, the selling began.
Not from panicked retail investors. From institutional portfolio managers executing a strategy that was supposed to be the most sophisticated risk management tool ever designed. Portfolio insurance. Automated, mathematical, supposedly infallible protection against exactly the kind of crash it was about to cause.
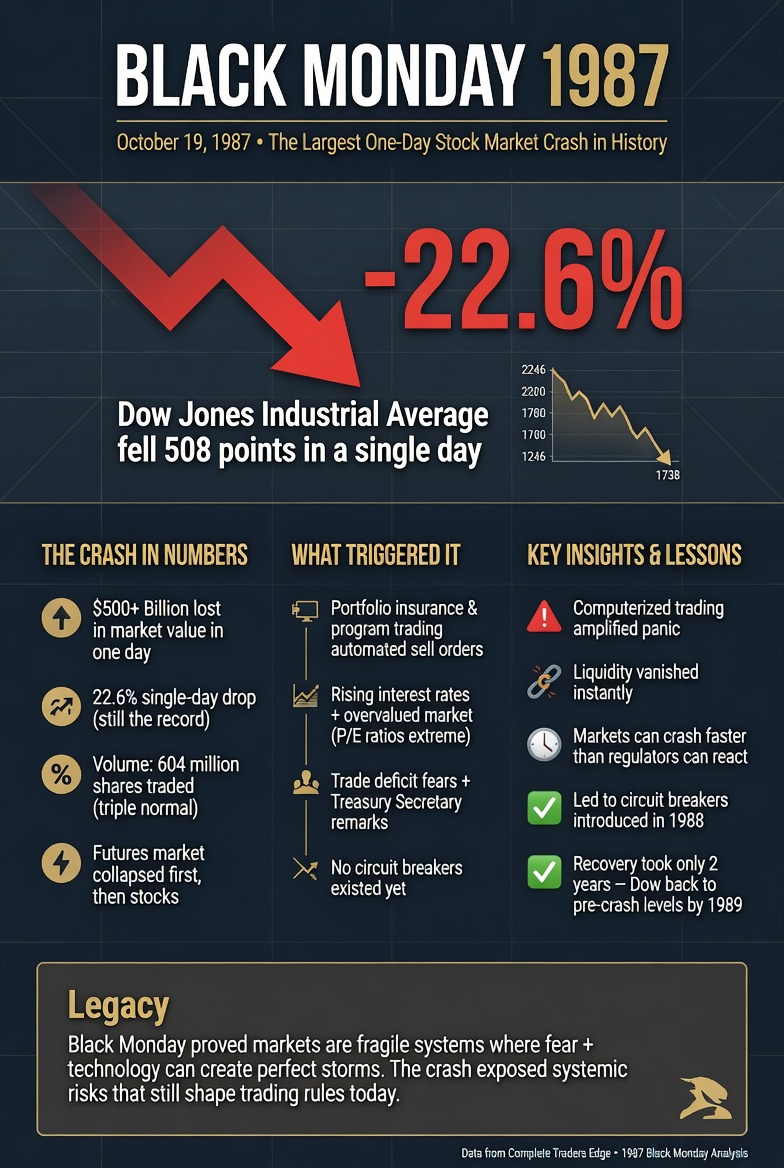
By the closing bell: the Dow had fallen 508 points. Twenty-2.6 percent. The largest single-day percentage decline in the history of American markets — more than twice the worst single day of the 1929 crash.
Five hundred billion dollars in market value. One afternoon. And the machines did it.
The Crisis at a Glance
| Data Point | Detail |
|---|---|
| Event | Black Monday — single-day global stock market crash |
| Date | Monday, October 19, 1987 |
| Dow Jones Decline | 508 points — 22.6% in a single trading session |
| Historical Context | Largest single-day percentage decline in NYSE history — more than double the worst day of the 1929 crash |
| Value Destroyed | ~$500 billion in US market value in one afternoon |
| Primary Mechanism | Portfolio insurance — automated selling programs creating a self-reinforcing cascade |
| Portfolio Insurance Assets | $60–90 billion under management running some form of portfolio insurance strategy |
| Hong Kong Response | Stock Exchange closed for 4 days — trapping investors who could not exit positions |
| Federal Reserve Response | Alan Greenspan statement Oct 20: Fed ready to provide liquidity — the birth of the “Greenspan Put” |
| Recovery | US market recovered most losses by year-end 1987; full-year 1987 return slightly positive |
| Regulatory Response | Circuit breakers introduced; futures/stock market coordination improved; portfolio insurance strategy largely abandoned |
| M·M·M Lesson | Method — protection creates the crash. Money — the Greenspan Put and moral hazard. Mind — mathematical certainty is never certain. |
Portfolio Insurance: The Smoke Alarm That Started the Fire
The 1980s bull market had run nearly 300% from its 1982 low. By August 1987, institutional investors — pension funds, insurance companies, the largest asset managers — were sitting on enormous gains and facing a specific challenge: how do you protect those gains against a crash, while still participating in continued upside?
Portfolio insurance, developed by finance academics Hayne Leland and Mark Rubinstein at UC Berkeley, answered that question with mathematical elegance. As the stock market declined, the strategy automatically sold stock index futures. The futures profits offset the stock losses. The hedge was dynamic — adjusting automatically as prices moved — and promised a mathematical floor below which losses could not fall.
For institutions legally obligated to protect pensioners’ capital, this sounded almost miraculous. By October 1987, an estimated $60–90 billion was running some form of portfolio insurance strategy.
The fatal assumption: that other participants would provide liquidity — would buy the futures contracts being sold — when the strategy needed to sell. The assumption held in the testing, because the testing assumed normal market conditions with normally diverse participant behaviour. It did not hold when $60 billion of strategies all tried to sell simultaneously into a market that was already falling.
The selling from portfolio insurance programs drove the market lower. Lower markets triggered more selling. More selling drove the market lower still. The strategy designed to prevent a crash was engineering one in real time.
The Death Spiral: October 19, 1987
Monday morning arrived with markets already on edge. The Dow had fallen 9% the preceding week. Concerns about rising interest rates, the US trade deficit, and Persian Gulf tensions had created genuine unease. When New York opened, the portfolio insurance programs were not starting from calm. They were positioned on a ledge, and the opening sell orders pushed them off it.
Dozens of major stocks didn’t open immediately — specialist market makers, seeing the order imbalance, delayed openings while searching for buyers. Investors couldn’t get prices. Uncertainty drove more selling. The futures market — still trading while stocks were closed — fell faster and further, creating a gap between futures and stock prices that should have attracted arbitrageurs but couldn’t, because the stocks weren’t open.
By 11 AM: Dow down 10%. Portfolio insurance models generating massive sell signals. Programs execute. Market falls further. Larger sell signals. More execution. By closing: 508 points. 22.6%. $500 billion.
The cascade went global overnight. Asian markets fell sharply. Hong Kong suspended trading for four days, trapping investors. London opened to severe declines. The question on every trading floor in the world on Tuesday morning was whether New York would continue the collapse.
Alan Greenspan, eight weeks into his tenure as Fed Chairman, issued a single paragraph before Tuesday’s open: the Federal Reserve was prepared to provide liquidity to support the financial system. Markets read it. They turned. By year-end, US markets had recovered enough that 1987’s full-year return was slightly positive.
The crash that could have become a catastrophe had been contained. But in being contained, it created an expectation that would shape markets for the next twenty-five years: that the Fed would always step in. The Greenspan Put was born.
What This Means for You as a Trader
📊 METHOD — Your Strategy’s Interaction With Everyone Else’s Strategy
Portfolio insurance worked in isolation. It failed in aggregate. When enough participants run correlated strategies, the strategies’ combined execution becomes the dominant market force. Stop-loss orders clustered at the same levels create stop cascades. Options hedging creates systematic selling at predictable strikes. Margin calls triggered simultaneously force selling at the worst moment. Think about what happens to the market when everyone in your position executes their plan at the same time. If the answer is “the market moves violently against the plan,” you need to account for that in your strategy design.
💰 MONEY — The Cost of the Greenspan Put
Greenspan’s intervention saved the market in 1987. It also created the implicit promise that catastrophic market failure would always be prevented. That promise influenced two decades of risk-taking — investors and institutions took larger positions, used more leverage, and accepted thinner margins of safety because they believed the Fed backstop existed. The Greenspan Put did not cause 2008. But it contributed to the risk appetite that made 2008’s scale possible. Whenever you find yourself pricing in a rescue — “they won’t let it fail” — ask whether that assumption is changing your risk management in ways you should be aware of.
🧠 MIND — Mathematical Certainty Is Never Certain
Portfolio insurance was backed by Nobel Prize-level mathematics. It had rigorous theoretical foundations. And it was wrong in the specific circumstances where it mattered most — because the mathematics were correct within their assumptions, and the assumptions were false when tested against reality. In trading: be sceptical of any strategy that claims to have mathematically eliminated a specific risk. Elimination of visible risk almost always means transformation of that risk into a hidden, correlated, systemic form that is harder to see and worse when it arrives. The 2008 AAA-rated CDO tranche is the same lesson in different clothes.
Frequently Asked Questions
What exactly is portfolio insurance and why did it cause a crash?
Portfolio insurance is a dynamic hedging strategy that automatically sells stock index futures when markets decline, generating profits designed to offset stock losses. The more the market falls, the more futures are sold. The problem: the strategy requires liquid buyers of futures on the other side. When $60–90 billion of strategies tried to sell simultaneously into a declining market, there were not enough buyers to absorb the selling at any reasonable price. The selling drove prices lower, which triggered more automated selling, which drove prices lower still. The hedge became the crash.
What are circuit breakers and do they still exist?
Circuit breakers are automatic trading halts triggered by specified market declines. They were introduced after Black Monday specifically to address the problem of runaway algorithmic selling. In the current US market: Level 1 (7% decline) triggers a 15-minute halt; Level 2 (13%) triggers another 15-minute halt; Level 3 (20%) closes markets for the day. They have been triggered multiple times — most recently in March 2020 at the onset of the COVID-19 market panic. They provide a pause for information to be gathered and panic to partially dissipate, but they do not eliminate the underlying dynamics that cause rapid market declines.
Why did the US market recover so quickly compared to 1929?
Several key differences. The Federal Reserve’s prompt liquidity provision prevented the banking system failure that amplified 1929’s crash into the Depression. Margin lending was far less prevalent in 1987 than in 1929 — ordinary Americans had not borrowed to buy stocks at 10:1 leverage. The real economy was not as directly connected to stock market prices in 1987 as it had been in 1929. And the global regulatory and institutional infrastructure — deposit insurance, coordinated central bank responses, IMF — provided stabilisers that simply did not exist in 1929. The crash was severe. The systemic damage was contained.
What is the “Greenspan Put” and is it still relevant?
The “Greenspan Put” refers to the implicit option that Federal Reserve policy provided to financial markets: if markets fell severely enough, the Fed would provide liquidity and effectively put a floor under prices. Greenspan’s October 1987 statement established this as an expectation. It was reinforced through the 1990s (LTCM, Asian crisis) and the early 2000s. The concept evolved into the “Fed Put” — the broader expectation that central bank intervention would prevent catastrophic market failure. Whether the Fed Put still exists after the 2022 rate tightening cycle, which showed the Fed willing to allow significant market declines to fight inflation, is an open and important question.
Could Black Monday happen again?
A 22.6% single-day decline is constrained by modern circuit breakers. But the underlying dynamic — correlated algorithmic strategies amplifying market moves — has not been eliminated. The 2010 Flash Crash, where the Dow fell nearly 1,000 points in minutes before recovering, demonstrated the same basic mechanism: automated selling triggering more automated selling in a liquidity void. Modern markets are more algorithmic, not less, than 1987. The specific instrument and specific strategy will be different. The structural vulnerability to correlated automated execution in a liquidity crisis is a permanent feature of the current market structure.
What happened to portfolio insurance as a strategy after Black Monday?
It effectively ended as a mainstream institutional strategy. Once the mechanism — that the strategy’s own execution was a primary driver of the crash it was designed to prevent — became clear, the logic of the approach collapsed. The $60–90 billion that had been running portfolio insurance strategies was largely withdrawn over the following months. The academic framework was refined. Modern equivalents — volatility targeting strategies, risk parity, systematic trend following — have their own second-order interaction effects that are better understood but not entirely solved. Every era creates its own version of the same problem.
Continue the Market Mayhem Series
Next: The Sun Also Falls — Japan’s Lost Decades
1989. The Imperial Palace grounds worth more than California. The Nikkei at 38,957. And then — thirty-five years of waiting to get back to even.
⚡ Modern Echo · 2026
1987 was 60 to 90 billion dollars of correlated machines selling into a void. In 2026, AI systems drive 87% of US equity volume, all trained on overlapping data and converging on the same conclusions in microseconds. The portfolio insurance problem just got an upgrade.
Read: The Next Market Crash — 5 Scenarios That Could End the Bull Run →
Market Mayhem is a historical education series produced by The Complete Trader’s Edge. All figures are sourced from historical records. Content is for educational purposes only and does not constitute financial or investment advice. Trading involves significant risk of loss.
 The Complete Trader's Edge
The full Mind · Method · Money framework. 70 chapters.
View on Amazon →
The Complete Trader's Edge
The full Mind · Method · Money framework. 70 chapters.
View on Amazon →
 Market Mayhem
400 years of bubbles, crashes, and the pattern that keeps repeating.
Buy on Amazon →
Market Mayhem
400 years of bubbles, crashes, and the pattern that keeps repeating.
Buy on Amazon →
 Greatest Companies
How the world's greatest companies were built — and what traders learn from them.
View on Amazon →
Greatest Companies
How the world's greatest companies were built — and what traders learn from them.
View on Amazon →