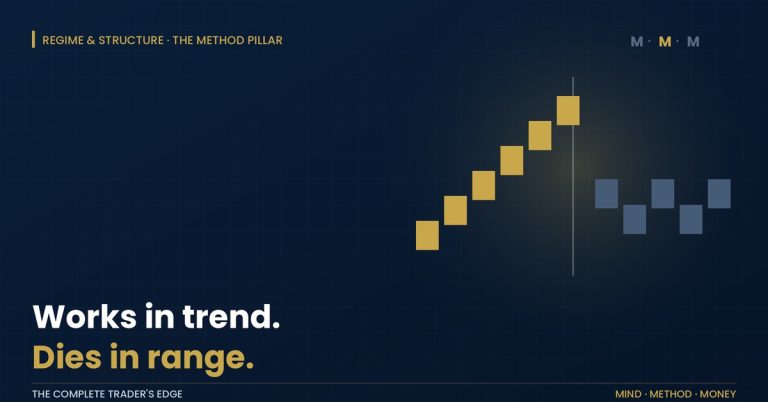
Minervini calls it a volatility contraction pattern. Carter calls it a squeeze. Bollinger describes it as bands narrowing, Keltner traders as channels overlapping. Four names, four books, one observation.
The market goes quiet before it goes somewhere.
That sentence is repeated so often that nobody asks the obvious question, which is why would that be true, and the usual answer is a story about coiling springs and energy building. There is no spring. Price is not storing anything.
The real reason has nothing to do with prediction, and it is far more useful.
Contraction does not make the move bigger. It makes your stop smaller.
Your stop is a function of volatility. Place it two ATRs away, as most sensible traders do, and the width of your risk is determined entirely by how much the instrument has been moving recently.
Now hold the move constant. Suppose that whatever happens next, the market travels six percent. Watch what the contraction does to the arithmetic.
| ATR at entry | Stop width (2 ATR) | The same 6% move is worth |
|---|---|---|
| 3.0% | 6.0% | 1.0R |
| 2.0% | 4.0% | 1.5R |
| 1.5% | 3.0% | 2.0R |
| 1.0% | 2.0% | 3.0R |
| 0.7% | 1.4% | 4.3R |
The move did not get bigger. The ruler got smaller. A 6% advance is worth 1.0R after a volatile period and 4.3R after a quiet one. Identical market behaviour, four times the payoff, because R is defined by the stop and the stop is defined by the volatility you entered into.
That is the entire edge, and it is not a forecast. It requires no belief about what price will do. It only requires that the move, when it comes, is not proportional to the quiet that preceded it. Which it is not, because the eventual move is driven by whatever news, flow, or repricing causes it, and that cause does not consult last week’s ATR.
The uncomfortable half
Tighter stop, better payoff. There is a price, and it is paid in the column traders watch most closely.
Simulate it properly. Enter after a contraction, place the stop at two of the contracted ATRs, and let volatility revert upward as it always does. Two hundred thousand trades.
| Contraction at entry | Stop width | Expectancy | Win rate |
|---|---|---|---|
| None | 6.0% | +0.105R | 55.2% |
| Moderate | 4.0% | +0.198R | 47.6% |
| Tight | 3.0% | +0.313R | 43.8% |
| Very tight | 2.0% | +0.557R | 38.7% |
Expectancy more than quintuples. The win rate falls by sixteen and a half points.
This is why the setup is abandoned by almost everyone who tries it. The tighter the contraction, the more often you are stopped out by ordinary noise as volatility reverts, and the more the experience feels like being repeatedly, humiliatingly wrong. Three trades in five lose.
The trader watching his win rate concludes the setup does not work. The trader watching his expectancy has found the best trade on the chart.
Defining contraction objectively
“It looks coiled” is not a rule. Three that are.
ATR ratio. Current ATR divided by its own average over a longer lookback. Below 0.7 is quiet. Below 0.5 is unusual. This is the single number that drives everything in the tables above, and it is one line of code.
Band containment. Bollinger bands sitting entirely inside the Keltner channels. This is Carter’s squeeze, and it is a way of asking whether recent realised volatility has fallen below its own recent norm without computing a ratio yourself.
Successive pullback depth. Minervini’s version, and the most demanding. Each pullback within the base is shallower than the last: fifteen percent, then eight, then four. Supply is being absorbed at progressively higher prices. This is the only one of the three that says anything about who is doing the buying.
Using it correctly
1. Regime first. Contraction inside a Stage 4 decline resolves downward. The pattern is directionless; the context is not.
2. Size from the contracted ATR, not the historical one. Sizing from a stale average throws away the entire edge, which lives in the denominator.
3. Expect the low win rate. Write it down before you take the first trade, because at trade six you will not believe it.
4. Do not widen the stop to feel better. Widening the stop restores the win rate and destroys the reason for the trade. You would be taking a low-conviction setup at normal-volatility payoff.
Point four is the one that kills people. It feels like prudence. It is the deletion of the edge.
The failure mode, stated honestly
Contraction resolves in a direction, and the direction is not yours to choose. A tight base can break down as easily as it breaks out, and the same arithmetic that makes the upside 4.3R makes the downside arrive quickly and cleanly at exactly 1R.
That is fine. That is what a 1R loss is for.
What is not fine is the second failure mode: contraction inside a range that continues to range. The break occurs, you are filled, volatility expands, price returns to the middle of the band, and your tight stop is taken on a move that meant nothing. No amount of contraction saves you from a market that was never going anywhere.
Which is why regime identification is a prerequisite for this article and not a footnote to it.
What is actually happening
Nothing mystical. Volatility is mean-reverting: quiet periods are followed by louder ones, on every instrument, on every timeframe, and this is one of the few genuinely robust statistical properties of financial markets.
Contraction therefore tells you one thing with reasonable confidence: volatility is going to increase. It tells you nothing whatsoever about direction.
And that is enough, because you are not paid in direction. You are paid in R, and R is a ratio, and the contraction has already improved the denominator before the market has moved at all.
The quiet market has not predicted anything.
It has simply offered you a smaller unit of risk for the same move, and then dared you to sit through a 38.7% win rate to collect it.
 The Complete Trader's Edge
The full Mind · Method · Money framework. 70 chapters.
View on Amazon →
The Complete Trader's Edge
The full Mind · Method · Money framework. 70 chapters.
View on Amazon →
 Market Mayhem
400 years of bubbles, crashes, and the pattern that keeps repeating.
Buy on Amazon →
Market Mayhem
400 years of bubbles, crashes, and the pattern that keeps repeating.
Buy on Amazon →
 Greatest Companies
How the world's greatest companies were built — and what traders learn from them.
View on Amazon →
Greatest Companies
How the world's greatest companies were built — and what traders learn from them.
View on Amazon →