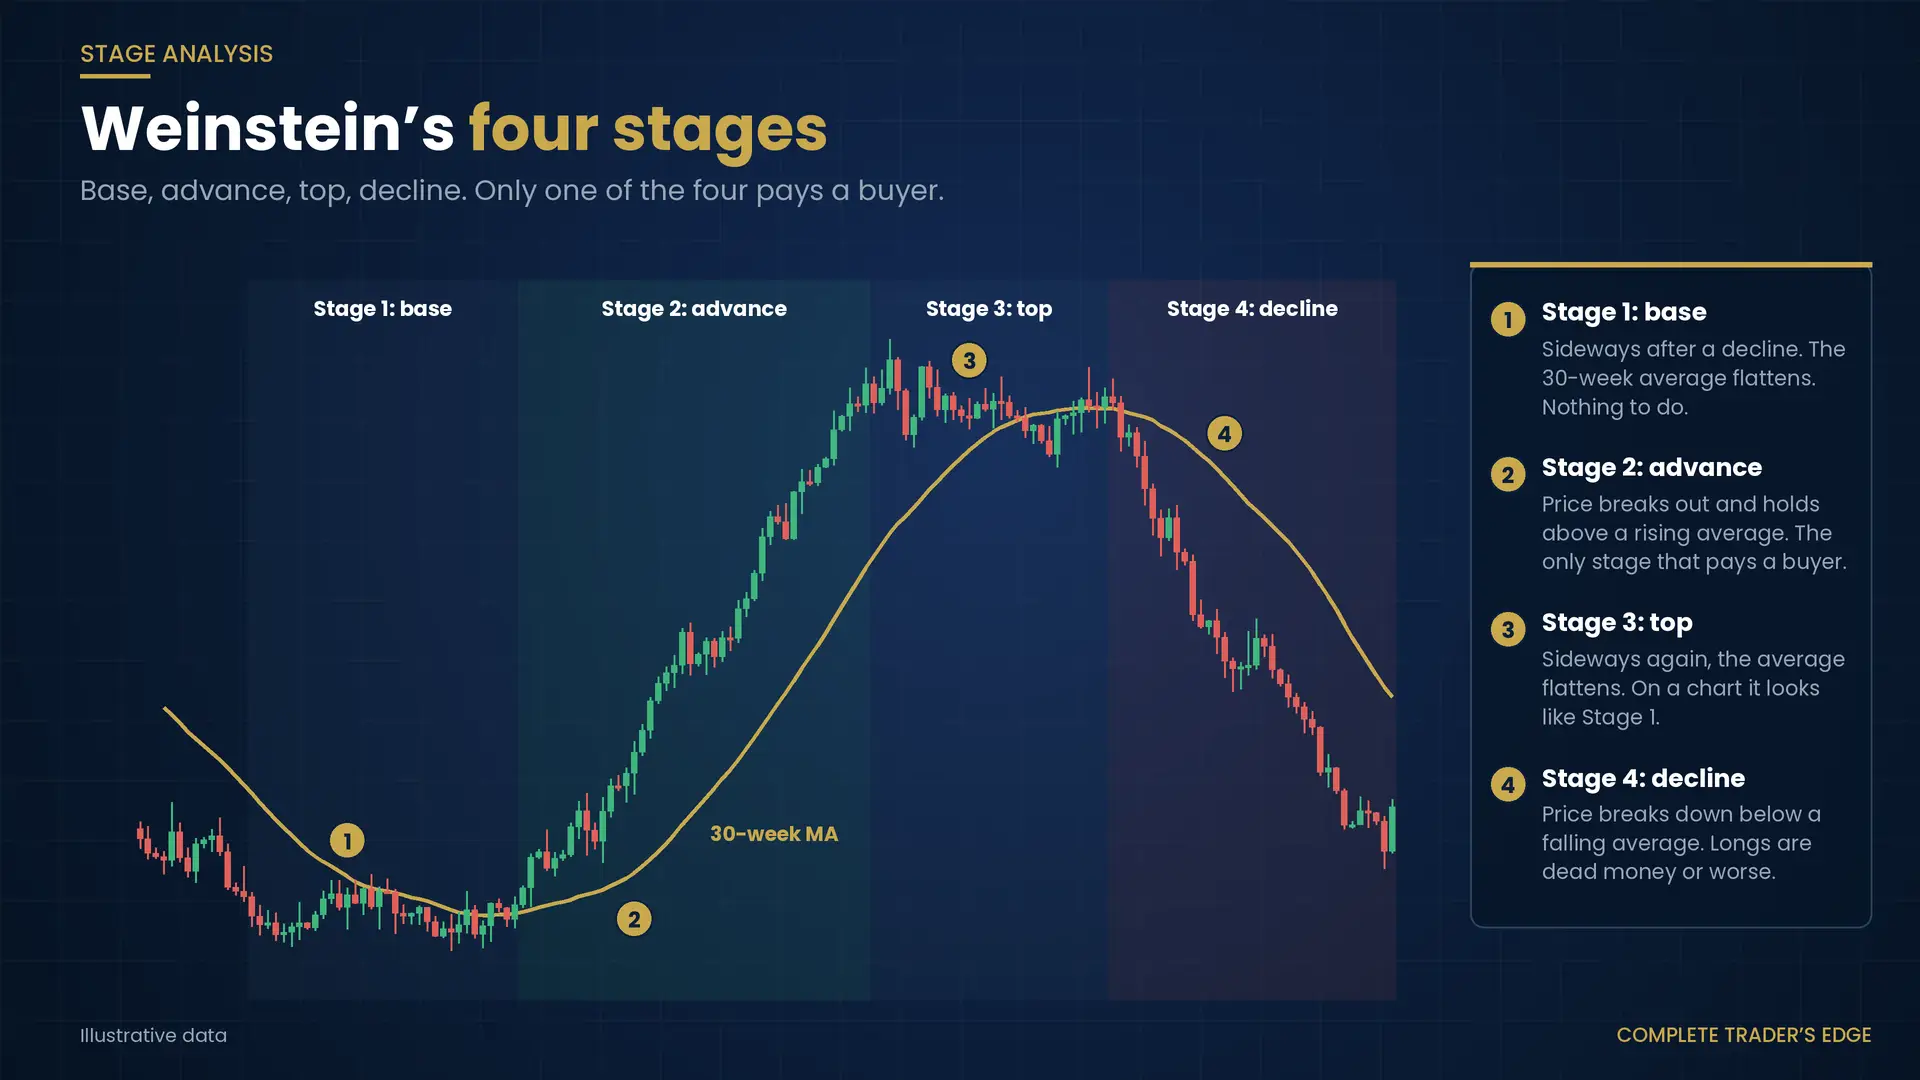
Stan Weinstein reduced every chart, in every market, on every timeframe, to four stages. Not patterns. Not signals. States of being, each of which lasts months and behaves in a completely different way from the others.
Stage 1, the base. Price moves sideways after a decline. The long moving average flattens. Nobody is interested. Nothing is happening, and the absence of anything happening is the point.
Stage 2, the advance. Price breaks above the base on volume and holds. The moving average turns upward. The stock outperforms the index. This is where the money is, and it is the only stage where the money is.
Stage 3, the top. The advance stalls. Volatility rises, direction does not. The moving average flattens again. This looks exactly like Stage 1, and it is not.
Stage 4, the decline. Price breaks the base of Stage 3. The average rolls over. Longs bleed.
The framework is old. The reason to take it seriously is that its central claim is testable, and it holds.
Only one stage pays
Enter long at a random point within each stage. Hold forty bars. Stop and trail at two ATRs. Sixty thousand trades per stage, identical rules throughout.
| Stage | Expectancy | Win rate | Average win |
|---|---|---|---|
| 1 — Base | +0.328R | 44.1% | 1.64R |
| 2 — Advance | +1.359R | 60.9% | 2.67R |
| 3 — Top | +0.311R | 43.5% | 1.64R |
| 4 — Decline | −0.115R | 31.9% | 1.21R |
Buy at random across all four stages and you make +0.466R a trade. Buy only in Stage 2 and you make +1.357R.
Nearly three times the expectancy, and not one thing changed about the entry technique, the stop, the target, or the trader. He simply declined to buy in three quarters of the chart’s life.
This is a filter, not a signal. Stage analysis does not tell you when to buy. It tells you when you are permitted to look for a reason to buy. Those are different tools, and confusing them is why most traders own six indicators and no filter.
The finding that should worry you
Look again at Stage 1 and Stage 3.
Expectancy +0.328R and +0.311R. Win rate 44.1% and 43.5%. Average win 1.64R in both. Average loss identical to two decimals.
A base and a top are statistically indistinguishable from inside a trade.
They have to be. Both are sideways price action after a directional move. Both have a flat long moving average. Both feel like nothing is happening, and in both something is coiling. The only thing that separates them is what comes next, and what comes next has not happened yet.
Which means every trader who has ever said “this is basing” has made a claim he cannot support. Half the time he is standing on a Stage 1 base, and half the time he is standing on a Stage 3 top with the same chart in front of him.
Weinstein’s answer to this problem is the entire value of the framework, and it is not clever. It is procedural.
Do not classify the shape. Wait for the transition.
You cannot know that a base is a base. You can know that price has broken above it, held, and dragged the long moving average upward behind it.
That is not a prediction. It is an observation, made after the fact, about a state change that has already occurred.
The Stage 2 checklist
1. Price is above the long moving average. Weinstein used the thirty-week; the number matters far less than the fact that it is long enough to be slow.
2. The moving average itself is rising, not merely being crossed. A cross of a falling average is a Stage 4 rally, and it will kill you.
3. The breakout came with an expansion in volume. Nobody has to buy a base. Somebody had to buy this.
4. Relative strength is rising. It is outperforming its index, which is the only evidence available that this is being bought specifically.
Four conditions. All four, or it is not Stage 2, and the +1.359R column does not apply to you.
Condition two is the one traders skip, and it is the one that matters most. A rising average is what distinguishes an advance from a bounce. Price above a falling average is a Stage 4 rally, and Stage 4 has a negative expectancy: −0.115R, with a 31.9% win rate. That is the number attached to buying the dip in a downtrend, and it is why the phrase “catching a falling knife” survived a century.
Relative strength is the second filter, and it is not optional
An index can be in Stage 2 while three quarters of its members are not. Absolute price tells you the tide. Relative strength tells you whether this boat is being lifted or merely floating.
The practical form: divide the instrument’s price by its benchmark and plot the line. If the ratio is falling while the price rises, the instrument is underperforming inside an advance, which means it will underperform severely when the advance stops. You are being paid the market’s return and taking a specific stock’s risk.
Where this fits with everything else
Stage analysis is the long-horizon expression of the regime question. Trend or range, asked over months instead of days.
Read them together and the hierarchy is clear. Stage tells you whether to be in the market at all. Regime tells you which tactics apply this week. Setup tells you where to place the order. Most traders own the third, borrow the second, and have never heard of the first.
And the sequence is strict. A perfect setup, in a range regime, inside a Stage 4 decline, is not a trade with a small edge. It is the −0.115R row, executed skilfully.
The uncomfortable arithmetic. Stage 2 is a minority of any chart’s life. Trading only Stage 2 means not trading most of the year. The +1.357R is not paid for skill. It is paid for absence.
What to do
Put a long moving average on every chart you trade, and look at its slope before its position. Two seconds, and it disqualifies most of what you were about to consider.
Tag your last hundred trades by stage. You will find, as with regime, that you have one profitable strategy and one unprofitable strategy and they are the same strategy, executed in different states of the market.
Stop trying to identify the base. You cannot, the model says so, and every trader who claims otherwise is describing Stage 3 half the time. Wait for the average to turn. You will be later, you will be right more often, and later is cheaper than wrong.
Three of the four stages pay you nothing or less than nothing.
The skill is not in finding the entry. It is in recognising the three quarters of the time when no entry exists.
 The Complete Trader's Edge
The full Mind · Method · Money framework. 70 chapters.
View on Amazon →
The Complete Trader's Edge
The full Mind · Method · Money framework. 70 chapters.
View on Amazon →
 Market Mayhem
400 years of bubbles, crashes, and the pattern that keeps repeating.
Buy on Amazon →
Market Mayhem
400 years of bubbles, crashes, and the pattern that keeps repeating.
Buy on Amazon →
 Greatest Companies
How the world's greatest companies were built — and what traders learn from them.
View on Amazon →
Greatest Companies
How the world's greatest companies were built — and what traders learn from them.
View on Amazon →
 Greatest Traders
Eighty-six lives that explain the markets — Livermore to Madoff, told with the losses left in.
View on Amazon →
Greatest Traders
Eighty-six lives that explain the markets — Livermore to Madoff, told with the losses left in.
View on Amazon →