An order block, in the ICT framework, is the last candle (or small group of candles) moving in the opposite direction before a significant impulsive move. The theory is that this zone represents where institutional traders placed their bulk orders, and that when price returns to this zone, unfilled institutional orders will reappear, causing another reaction in the same direction as the original impulse.
Order Blocks are one of the most powerful tools in the Smart Money toolkit because they do something traditional support and resistance cannot: they tell you not just where price reacted, but where institutional capital was committed. This distinction matters because institutional orders are large, often requiring multiple fills across time. When price returns to an Order Block, the remaining unfilled portion of those orders creates genuine buying or selling pressure.
Identifying Bullish Order Blocks
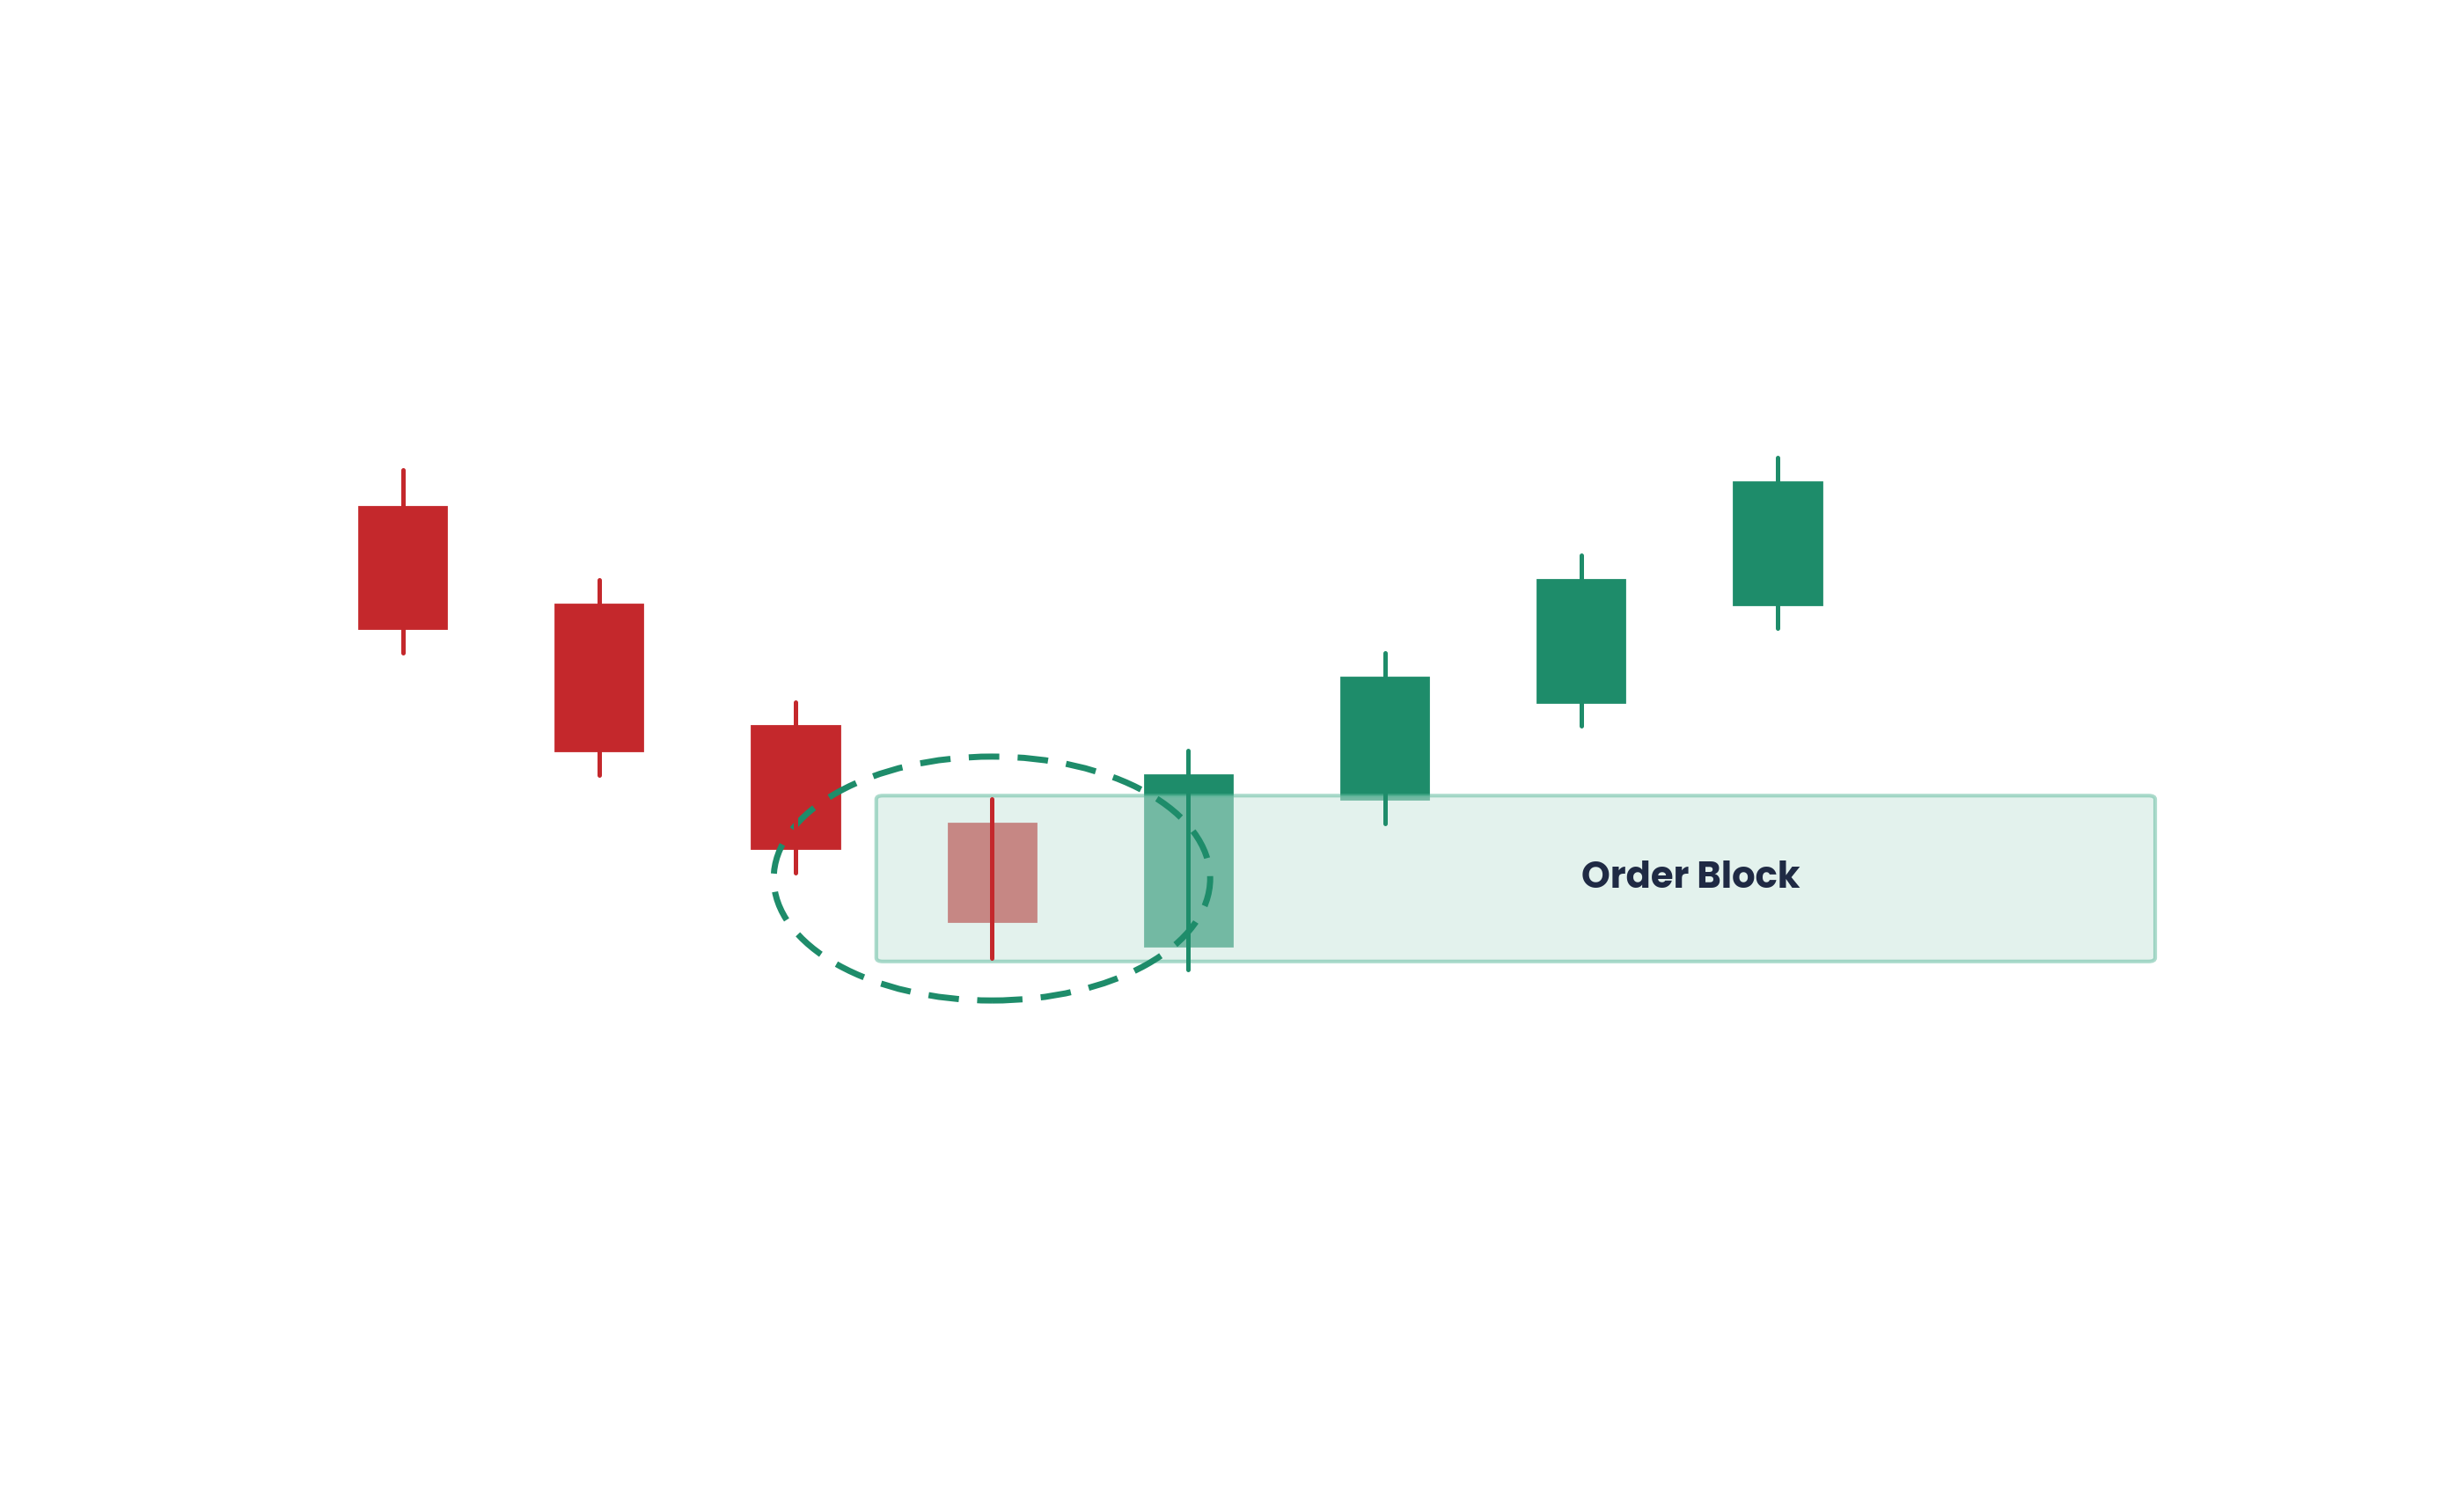
A bullish Order Block is the last bearish (down) candle before a strong bullish impulse that breaks market structure. After a significant rally away from a level, mark the body of the last bearish candle before the rally began. When price returns to retest this zone in a pullback, the expectation is that institutional buying interest will reappear.
The entry process: wait for price to pull back into the Order Block zone. Look for a confirmation signal on the entry timeframe (a bullish engulfing, pin bar, or 15-minute Change of Character). Place your stop loss below the low of the Order Block. Target the next liquidity level above (previous swing high or equal highs).
Identifying Bearish Order Blocks
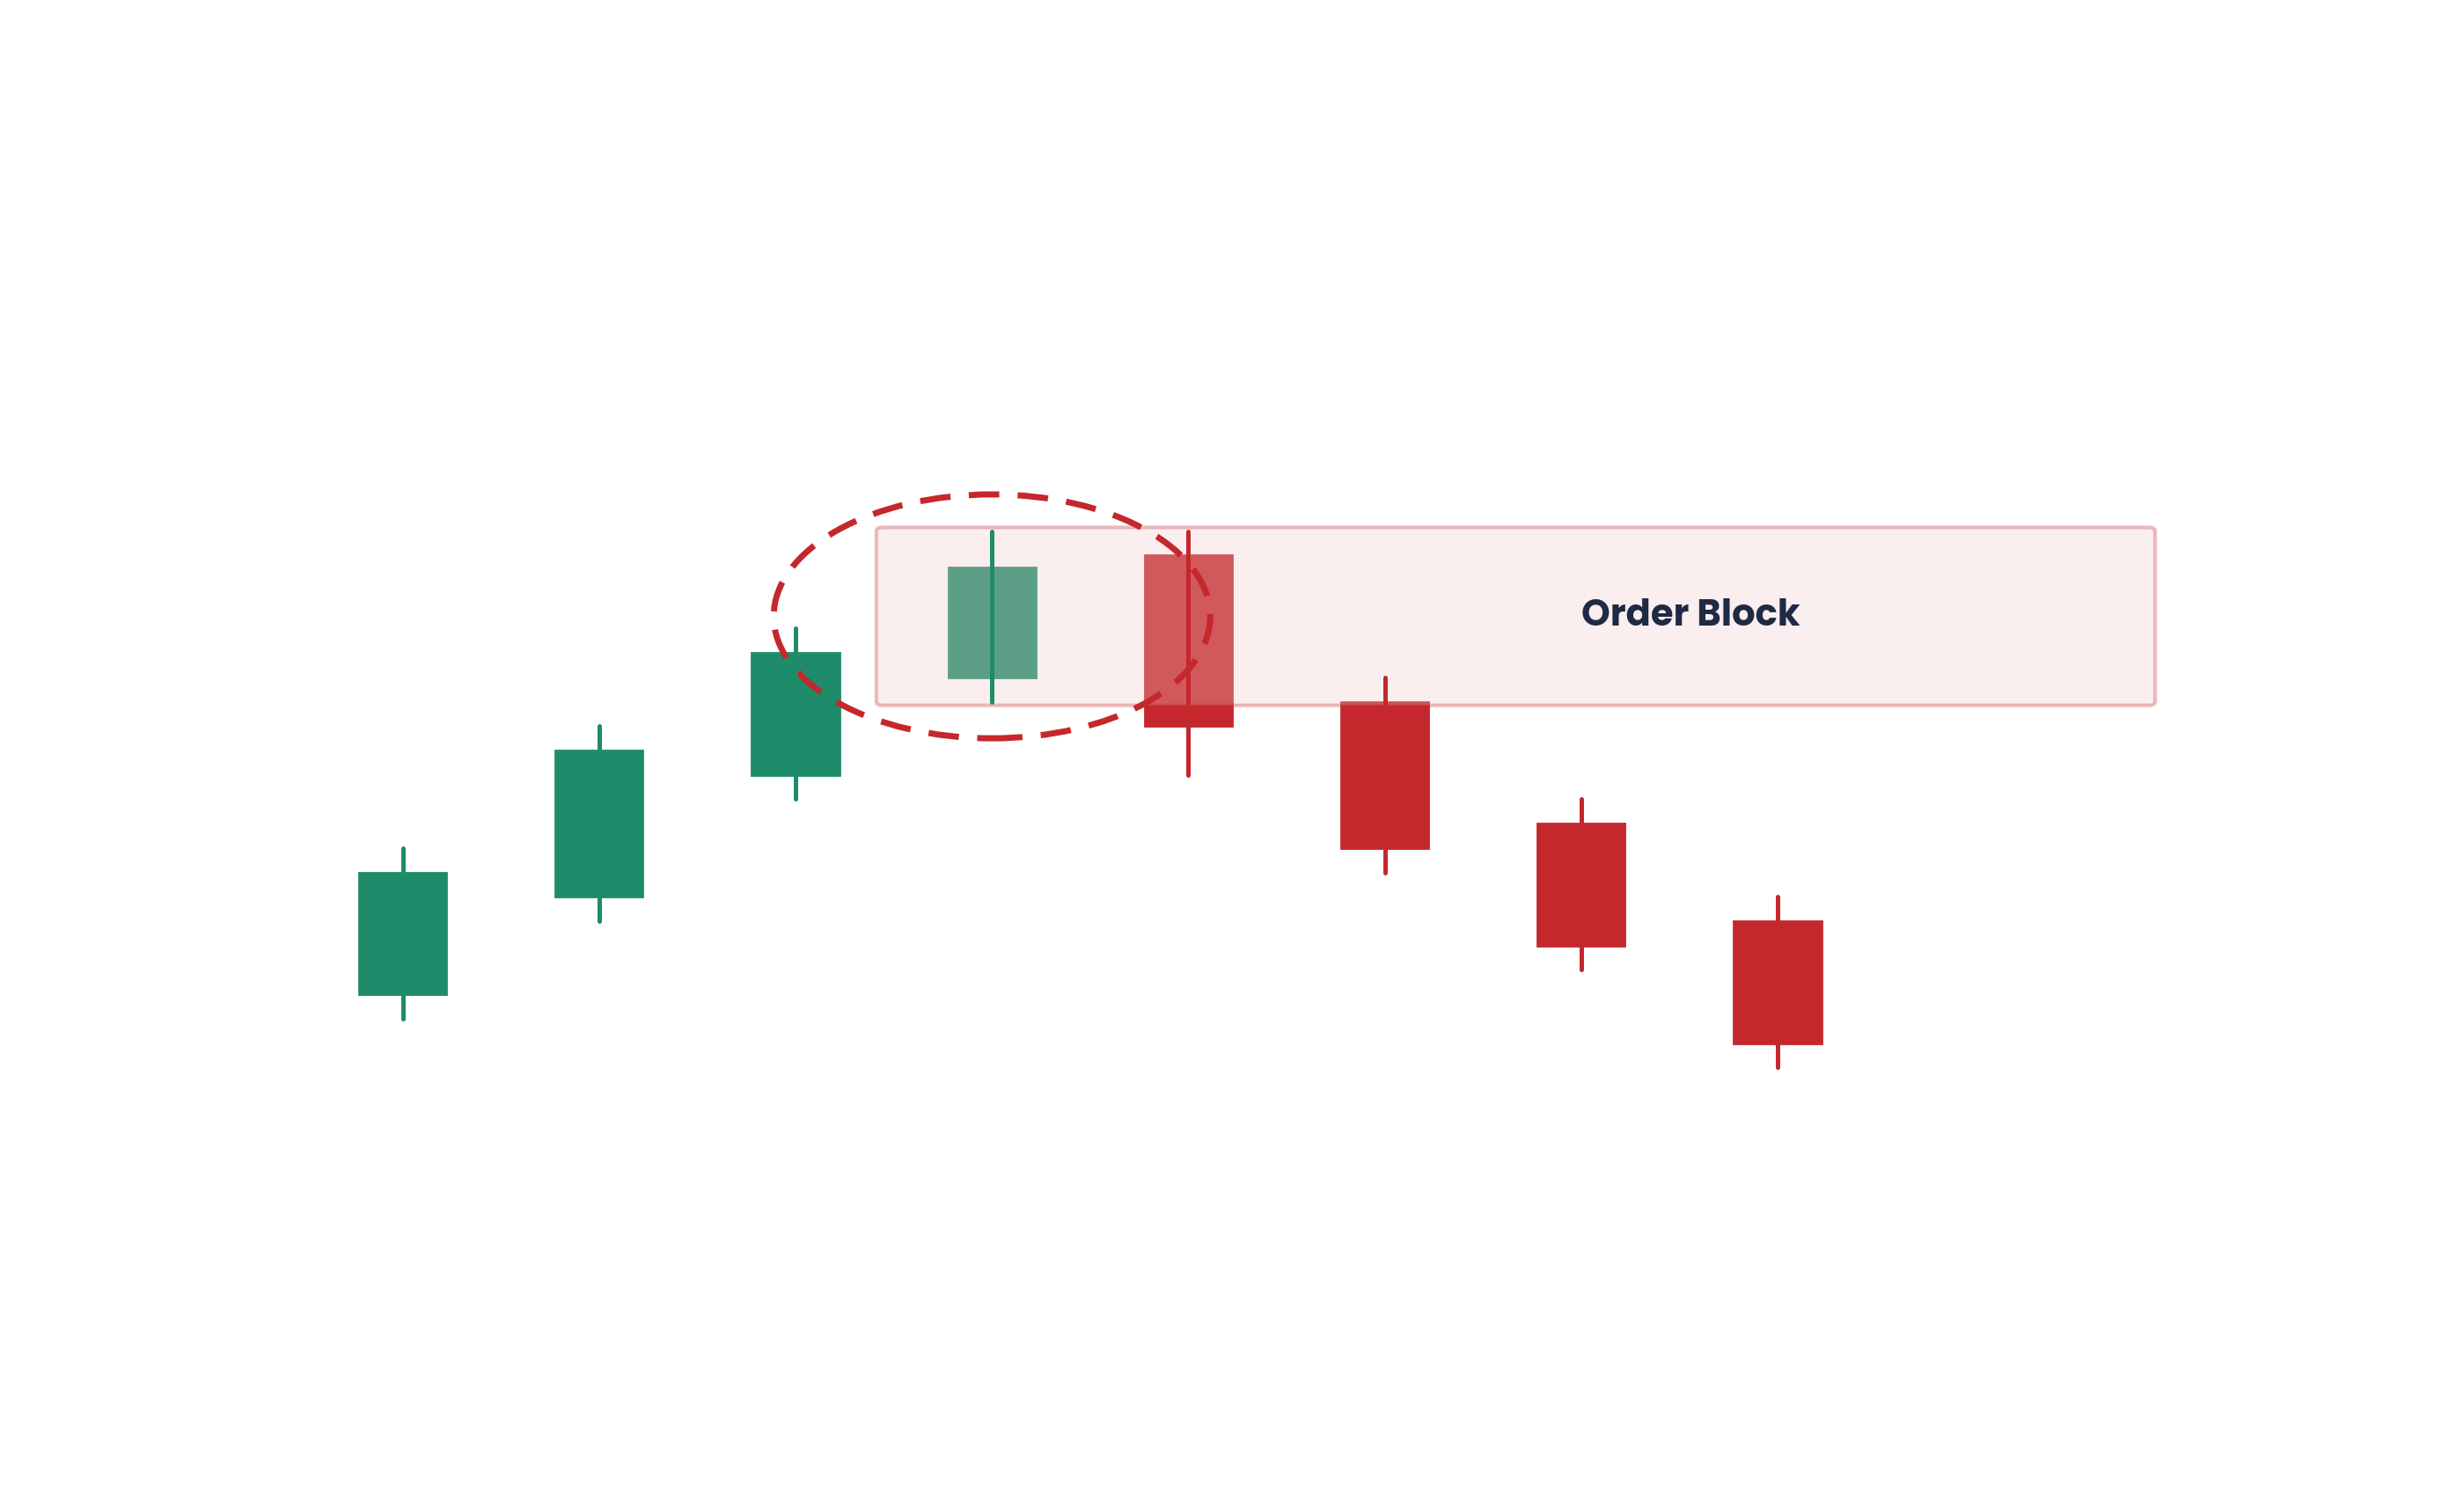
The mirror: a bearish Order Block is the last bullish (up) candle before a significant bearish impulse that breaks structure to the downside. Mark its body. When price rallies back to retest this zone, institutional selling interest should create resistance. Stop above the high of the OB, target the next liquidity pool below.
What Makes an Order Block Valid vs Invalid
Not every last candle before a move is a high-quality Order Block. Most retail traders who learn this concept begin marking every minor reversal candle as an OB, which clutters the chart with low-probability zones. Use these criteria to separate the signal from the noise:
| Criterion | Valid Order Block | Invalid / Low-Quality OB |
|---|---|---|
| Structure break | The impulse from the OB caused a Break of Structure (BOS) or Change of Character (ChoCH) | The move was minor, did not break any significant swing point |
| Imbalance | A Fair Value Gap was left between the OB and the displacement | Price moved away gradually with no gap or imbalance |
| Fresh vs tested | The OB has not been retested yet (first touch) | Price has already returned to the OB and reacted once. Each subsequent test weakens the zone. |
| Trend alignment | The OB is in the direction of the HTF trend (bullish OB in uptrend) | The OB fights the higher timeframe direction |
| Liquidity sweep | The OB formed after a liquidity sweep | No obvious liquidity was swept before the impulse move |
A valid Order Block checks at least 3 of these 5 criteria. The highest-probability Order Blocks check all 5.
When Order Blocks Fail: The Breaker Block
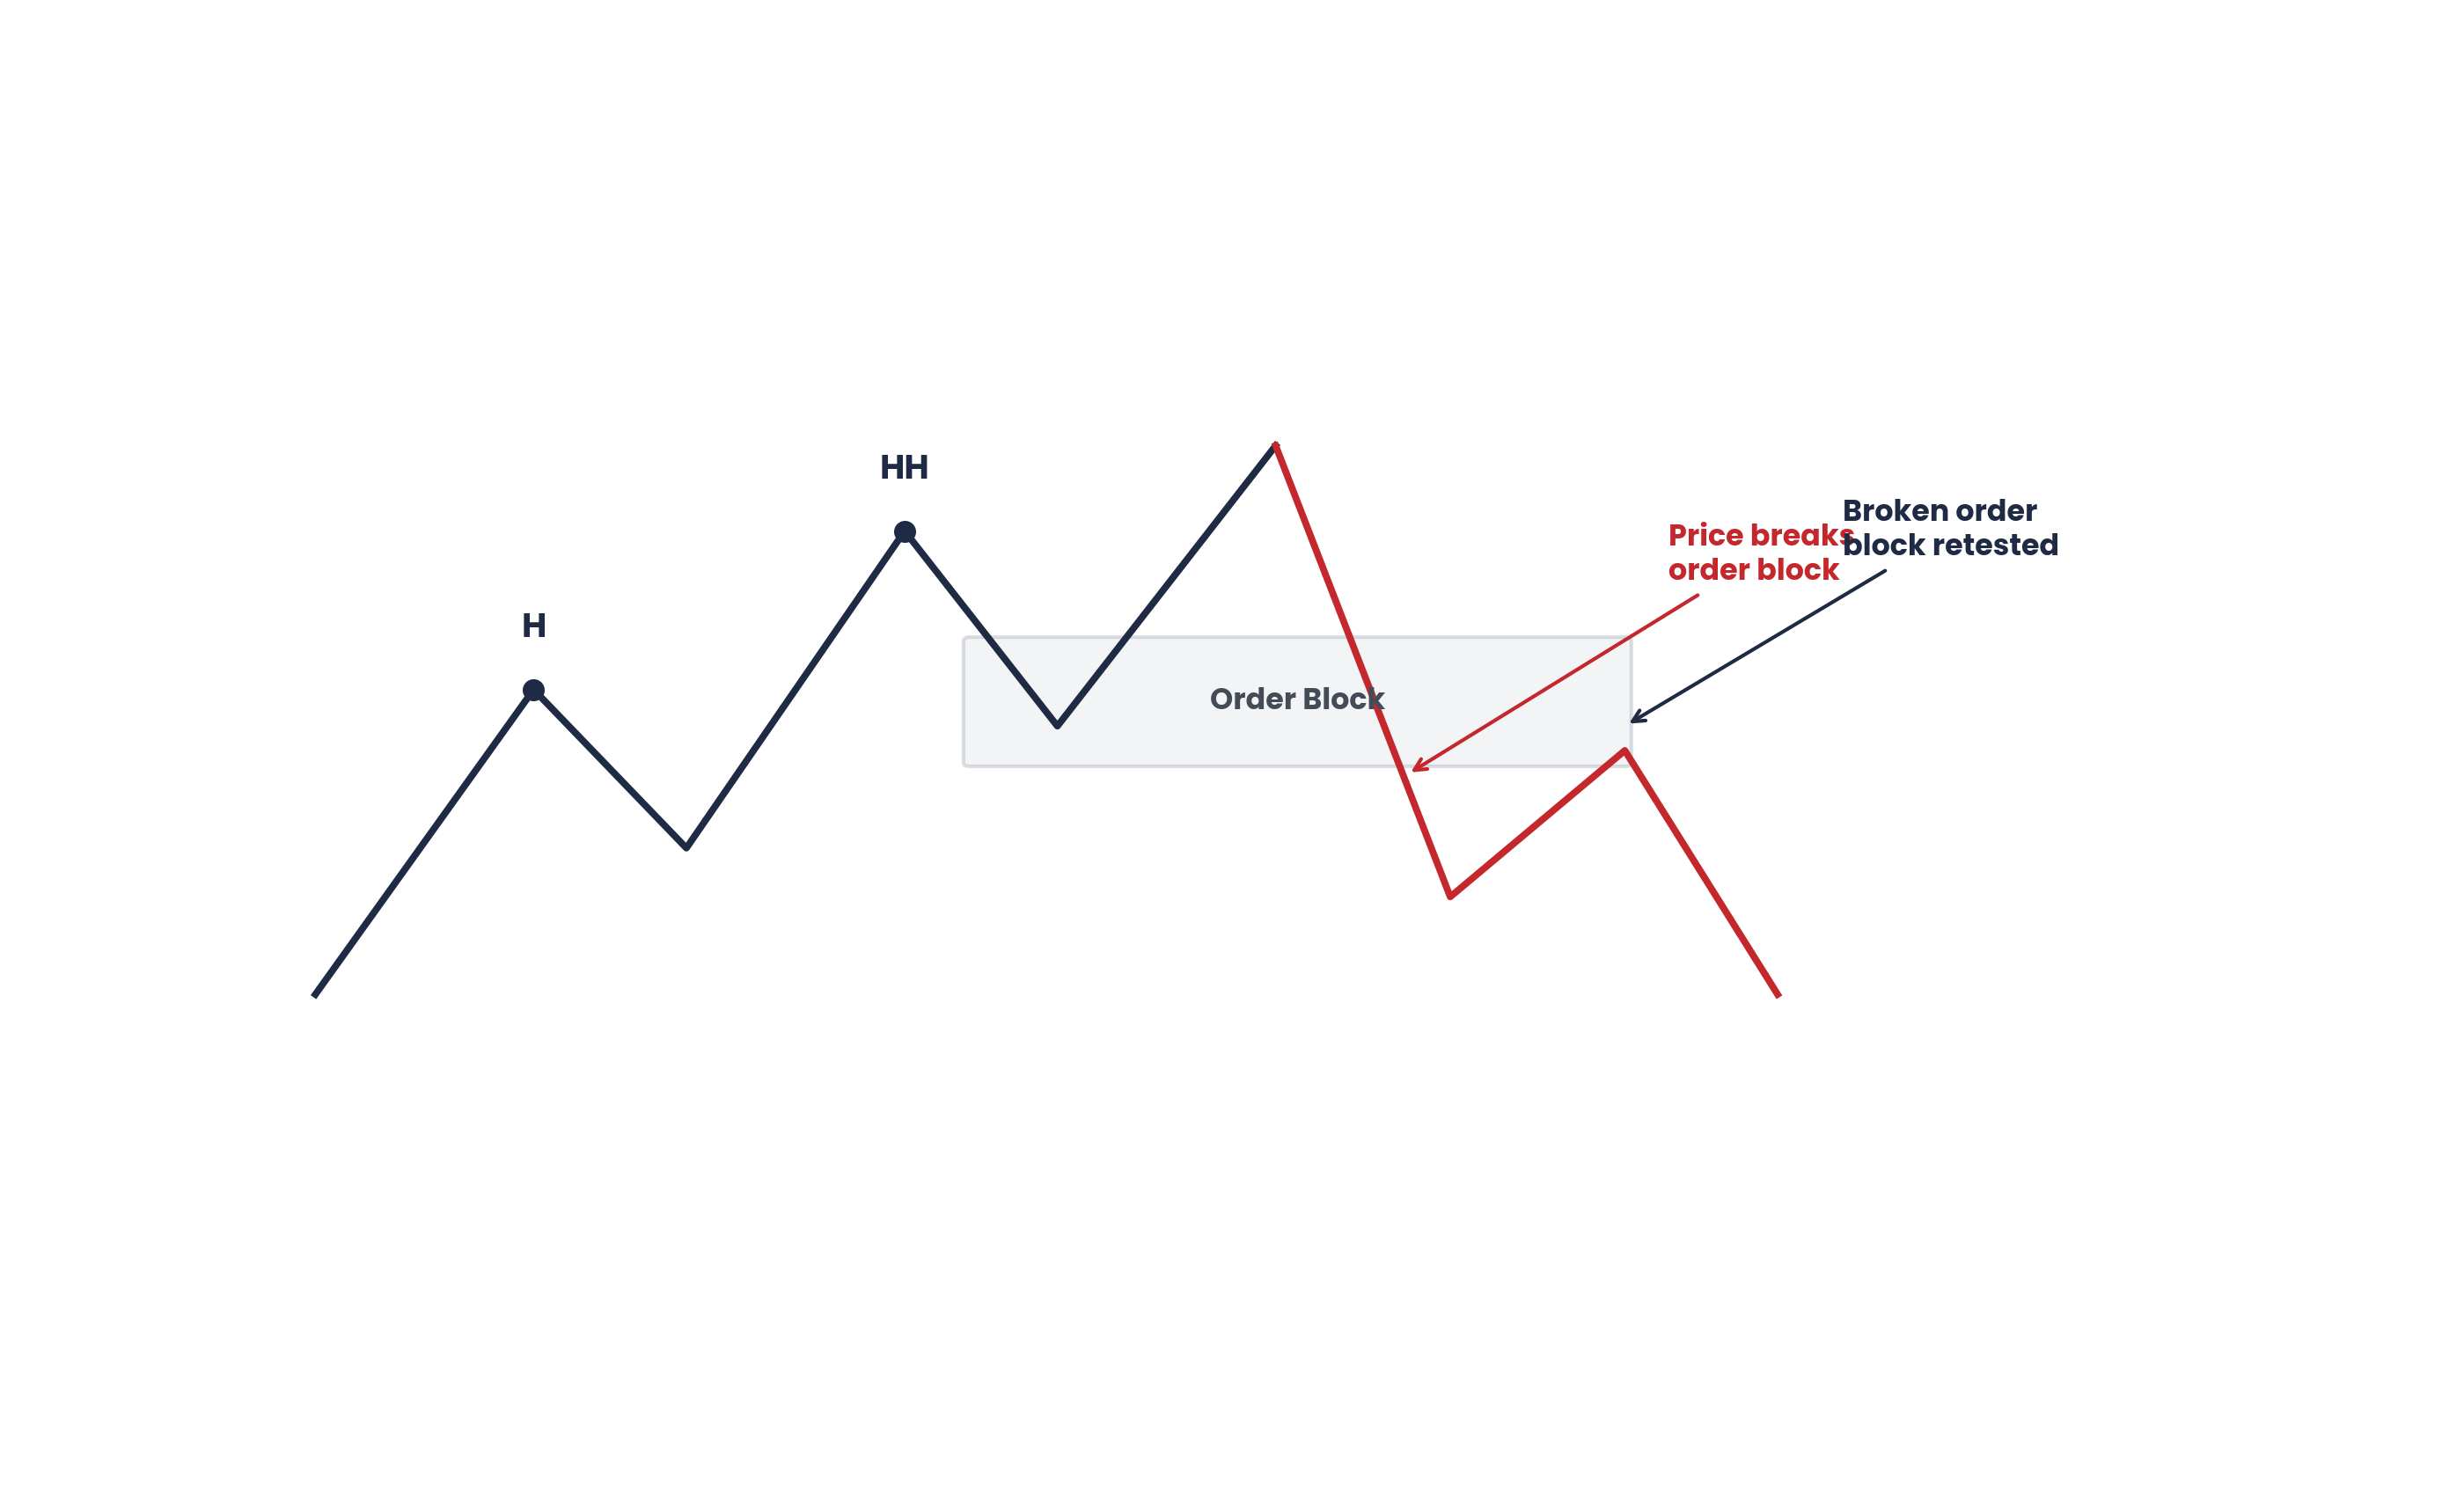
When price returns to a bullish Order Block and pushes through it with a decisive close below, the OB has been mitigated (broken). It no longer represents institutional demand. Instead, it flips into a breaker block: a zone that now acts as resistance where it previously acted as support.
The logic is identical to the polarity principle in support and resistance. Traders who bought at the OB are now trapped. When price returns from below, they exit to cut losses, creating selling pressure that transforms the old bullish OB into a bearish resistance zone.
Breaker blocks are powerful trading levels because they represent a zone where market participants have been proven wrong, creating motivated sellers (or buyers, for the bearish mirror) who will act predictably when price returns.
Combining Order Blocks with Confluence
Order Blocks are most powerful when they align with other tools from the blended approach taught in The Complete Trader’s Edge:
OB + Fibonacci golden pocket (0.618-0.702): When the OB sits within the golden pocket zone of a retracement, the probability of a reaction increases significantly because two independent frameworks point to the same price level.
OB + Volume Profile POC/VAL: When the OB aligns with a high-volume node or the Value Area boundary, you have confirmation that significant volume was traded at the same level, reinforcing the institutional footprint.
OB + FVG overlap: When the OB has an FVG immediately above or below it, the imbalance adds another magnet drawing price back to the zone.
OB + liquidity sweep: A daily OB at a key weekly support level that was preceded by a sweep of equal lows is one of the highest-confluence trade locations in the ICT framework.
Key Lessons
- An Order Block is the last opposing candle before a significant institutional impulse that broke structure.
- Bullish OB: last bearish candle before a strong rally. Bearish OB: last bullish candle before a strong drop.
- Valid OBs require a structure break, imbalance (FVG), and ideally a preceding liquidity sweep. Fresh OBs (untested) are strongest.
- Failed Order Blocks become breaker blocks that work in the opposite direction.
- Combine OBs with Fibonacci, Volume Profile, FVGs, and liquidity sweeps for the highest-probability setups.
Frequently Asked Questions
What is the difference between an Order Block and a supply and demand zone?
Supply and demand zones and Order Blocks identify similar areas on a chart, but the frameworks behind them differ. Supply and demand zones are drawn around any area where price turned aggressively, often encompassing a broader range. Order Blocks in the ICT framework are more precise: specifically the last opposing candle before an impulsive move that broke structure. An OB also requires contextual validation including a preceding liquidity sweep and a Fair Value Gap left by the displacement. In practice, a valid Order Block is a specific type of supply or demand zone with stricter qualifying criteria.
How do you know if an Order Block will hold or fail?
No Order Block is guaranteed to hold. The ones with the highest probability share these characteristics: they formed after a clear break of structure, have not been previously tested, align with the higher-timeframe trend direction, have an FVG between current price and the OB, and were preceded by a liquidity sweep. If an OB has been tested and price passed through without a strong reaction, it is mitigated and should be removed from your chart. Failed OBs become breaker blocks that act as levels in the opposite direction.
Can you use Order Blocks on any market?
Order Blocks work on every liquid market because they reflect a universal principle: institutional accumulation and distribution leave footprints in price. Forex, stock indices, crypto, commodities, and individual stocks all show valid OB patterns. The key requirement is sufficient liquidity. In highly liquid markets like EUR/USD, Gold, ES futures, or Bitcoin, OBs form cleanly and react predictably. In low-liquidity instruments like penny stocks or micro-cap altcoins, the patterns are less reliable.
Should I use the candle body or the full range (including wicks) for my Order Block zone?
Use the candle body as the primary zone and the wicks as the buffer. The body represents where the majority of orders were filled. The wicks represent the extremes of the session. For entry, look for reactions at the body. For stop placement, go beyond the wick. This approach gives you a precise entry zone while providing adequate room for the normal price noise around the level.
How many Order Blocks should I have marked on my chart?
Focus on the 2 to 3 most significant OBs above and below current price on your intermediate timeframe (4-hour or 1-hour). Remove any that have been mitigated. Only mark OBs that meet at least 3 of the 5 validity criteria in the table above. If your chart is covered in OB zones, you have not been selective enough. The best traders use fewer, higher-quality levels rather than marking every minor reversal candle.
Continue Reading
▶ Fair Value Gaps: The Complete ICT Guide
▶ Liquidity and ICT Concepts: How Smart Money Moves Markets
▶ Advanced Smart Money Concepts: Breakers, OTE, Premium/Discount
From The Book
This article covers concepts from Chapter 28 of The Complete Trader’s Edge.
 The Complete Trader's Edge
The full Mind · Method · Money framework. 70 chapters.
View on Amazon →
The Complete Trader's Edge
The full Mind · Method · Money framework. 70 chapters.
View on Amazon →
 Market Mayhem
400 years of bubbles, crashes, and the pattern that keeps repeating.
Buy on Amazon →
Market Mayhem
400 years of bubbles, crashes, and the pattern that keeps repeating.
Buy on Amazon →