VPOC, value area high and low, high-volume nodes — reading where the market has accepted and rejected price.
Volume analysis studies how much activity occurs during each time period. Volume Profile asks a fundamentally different question: not when volume occurred, but where. It maps the total volume traded at each price level over a specified period, creating a horizontal histogram that reveals which prices the market considers fair and which prices it rejects.
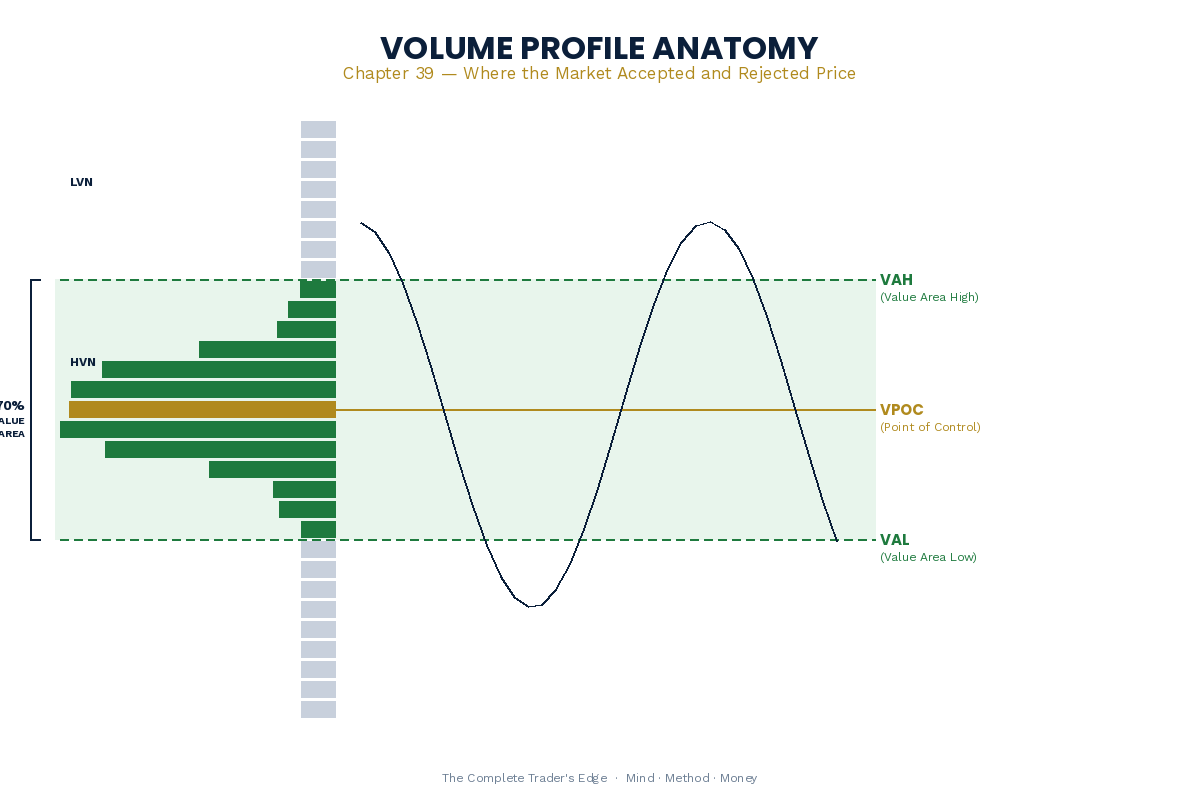
| Volume Profile Level | What It Is | How to Trade It |
|---|---|---|
| VPOC (Point of Control) | The price level with the highest traded volume in the profile | Acts as a magnet. Price tends to gravitate toward POC. Strong S/R when tested. |
| Value Area High (VAH) | Upper boundary of the 70% volume zone | Resistance for longs. If price breaks and holds above VAH, bullish expansion likely. |
| Value Area Low (VAL) | Lower boundary of the 70% volume zone | Support for longs. If price breaks below VAL, bearish expansion likely. |
| High Volume Nodes (HVN) | Price levels with significant traded volume (wide profile sections) | Act as magnets and consolidation zones. Price moves slowly through HVNs. |
| Low Volume Nodes (LVN) | Price levels with minimal traded volume (thin profile sections) | Act as speed zones. Price moves quickly through LVNs. Key for breakout targets. |
Price levels with high traded volume represent consensus — zones where both buyers and sellers agreed to transact in large quantities. These are the prices the market has accepted. Price levels with low traded volume represent disagreement or disinterest — zones where price moved through quickly. These are the prices the market has rejected.
The Key Levels
Point of Control (VPOC)
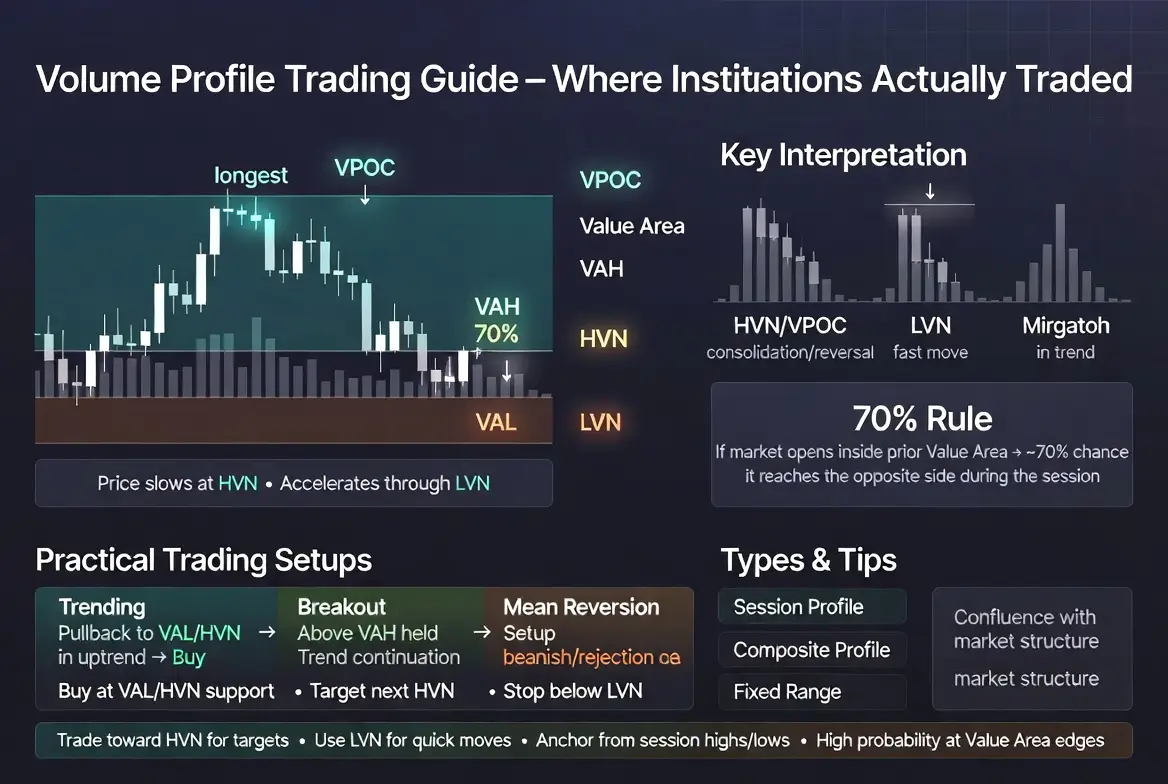
The Point of Control is the single price level with the highest traded volume — the level of maximum agreement between buyers and sellers. Think of it as the market’s centre of gravity. VPOC acts as a magnet. When price moves away from VPOC, it has a statistical tendency to return to it. In trending markets, a developing VPOC that migrates in the direction of the trend confirms institutional commitment.
Value Area High (VAH) and Value Area Low (VAL)
The value area is the price range that contains 70% of the total traded volume. VAH is the upper boundary. VAL is the lower boundary. Together they define the zone the market considers fair value. VAH and VAL function as dynamic support and resistance levels. Breaks beyond VAH or VAL that hold indicate a shift in the accepted value zone — the market is repricing.
The 70% Rule: If the market opens within the prior session’s value area, there is approximately a 70% probability that it will trade back to the other side of the value area during the session. This single statistical edge has been the foundation of many professional day trading strategies.
High-Volume Nodes (HVN) and Low-Volume Nodes (LVN)
High-volume nodes are price levels where a large amount of trading occurred — they represent zones of acceptance and tend to act as support or resistance. Price tends to slow down and consolidate at HVNs. Low-volume nodes are the opposite — price tends to accelerate through LVNs because there is no volume-based support or resistance to slow it down.
Types of Volume Profile
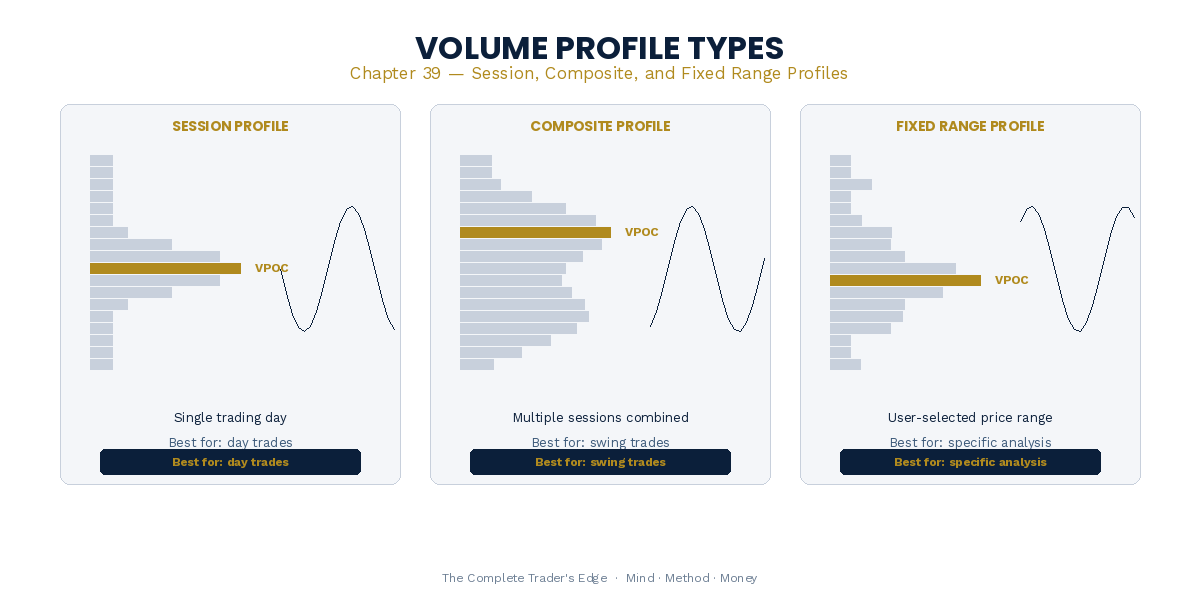
Session Profile maps volume for a single trading session — most useful for day traders. The prior session’s VPOC, VAH, and VAL are among the most important levels for the next session.
Composite Profile aggregates volume across multiple sessions — typically a week, month, or custom period. Useful for swing traders identifying broader acceptance and rejection zones.
Fixed Range Profile maps volume across a specific price move you select manually — the most versatile option for analysing specific impulse legs or consolidation ranges.
Trading with Volume Profile
At the value area edges, expect reactions. In a ranging market, price tends to bounce between VAH and VAL. Breaks beyond that hold indicate repricing. Breaks that fail and return inside are strong mean reversion trades.
Use HVNs for realistic profit targets — price will slow at these levels. Use LVNs to anticipate acceleration — price moves quickly through low-volume zones. This gives you an edge in setting both targets and stops.
📚 Related Articles:
This article is adapted from The Complete Trader’s Edge
70 chapters covering Mind · Method · Money — the most comprehensive trading education framework available.
Frequently Asked Questions
What is the difference between Volume Profile and regular volume?
Regular volume shows how much was traded per time period (volume per candle). Volume Profile shows how much was traded at each price level. This is a critical distinction: regular volume tells you when activity occurred; Volume Profile tells you where activity occurred. The “where” is far more useful for identifying support and resistance zones.
What are VAH, VAL, and POC?
VAH (Value Area High) is the upper boundary of the price range where 70% of volume was traded. VAL (Value Area Low) is the lower boundary. POC (Point of Control) is the single price level with the most volume. These three levels act as strong support and resistance because they represent where the most institutional activity occurred.
How does Volume Profile combine with ICT concepts?
Volume Profile provides independent confirmation of ICT levels. An Order Block that aligns with a POC or VAL is a higher-confluence zone than either alone. The Volume Profile shows actual traded volume at the price; the Order Block shows institutional structural levels. When both frameworks agree on a level, the probability of a reaction increases significantly.
Which Volume Profile timeframe should I use?
Use session Volume Profile (one profile per trading day) for day trading and weekly/monthly profiles for swing trading. The previous day’s VAH, VAL, and POC are the most important levels for day traders. Weekly and monthly profiles provide the macro context that higher timeframe traders reference.
Is Volume Profile available on free charting platforms?
TradingView offers Volume Profile indicators on both free and paid plans, though the paid plans provide more customisation options. Sierra Chart and ATAS are popular among professional Volume Profile traders for their advanced features. For most retail traders learning the basics, TradingView’s built-in Volume Profile tools are sufficient.
From The Book
This article covers concepts from Chapter 36 of The Complete Trader’s Edge.
Frequently Asked Questions
What is the difference between Volume Profile and regular volume?
Regular volume bars show how much was traded during each time period (per candle). Volume Profile shows how much was traded at each price level. This is a fundamentally different view: instead of asking “how much was traded today?” you are asking “at what prices was the most trading done?” This reveals where institutional traders concentrated their activity, which is far more useful for identifying support and resistance levels.
What are VPOC, VAH, and VAL?
VPOC (Volume Point of Control) is the price level where the most volume was traded: the “fair value” according to the market. VAH (Value Area High) and VAL (Value Area Low) define the range containing 70% of all traded volume. Together, they create the Value Area: the price range where the majority of market participants agreed to transact. Price tends to gravitate back to VPOC and react at VAH/VAL boundaries.
How do I add Volume Profile to my charts?
On TradingView, search for “Volume Profile” in the indicators panel. The most useful variants are “Fixed Range Volume Profile” (you select the date range) and “Session Volume Profile” (automatically plots for each session). On MT4/MT5, third-party indicators are available. For futures traders, platforms like ATAS and Sierra Chart have native Volume Profile tools.
Can I combine Volume Profile with ICT concepts?
Yes, and this is one of the most powerful combinations in the blended approach. When an Order Block aligns with the VPOC or a Value Area boundary, you have volume confirmation that institutional orders were concentrated at that level. Similarly, Fair Value Gaps in low-volume zones are more likely to be filled because the market will seek to establish two-sided trading at those prices.
Does Volume Profile work on forex?
With caveats. Forex Volume Profile uses tick volume (number of price changes) rather than actual traded volume because forex is OTC with no centralised exchange. Tick volume correlates reasonably well with actual volume for major pairs, making VP useful but less precise than on exchange-traded instruments like futures. For forex, use VP as confluence alongside market structure and ICT levels, not as a standalone tool.
From The Book
This article covers concepts from Chapter 35 of The Complete Trader’s Edge.
 The Complete Trader's Edge
The full Mind · Method · Money framework. 70 chapters.
View on Amazon →
The Complete Trader's Edge
The full Mind · Method · Money framework. 70 chapters.
View on Amazon →
 Market Mayhem
400 years of bubbles, crashes, and the pattern that keeps repeating.
Buy on Amazon →
Market Mayhem
400 years of bubbles, crashes, and the pattern that keeps repeating.
Buy on Amazon →
 Greatest Companies
How the world's greatest companies were built — and what traders learn from them.
View on Amazon →
Greatest Companies
How the world's greatest companies were built — and what traders learn from them.
View on Amazon →
 Greatest Traders
Eighty-six lives that explain the markets — Livermore to Madoff, told with the losses left in.
View on Amazon →
Greatest Traders
Eighty-six lives that explain the markets — Livermore to Madoff, told with the losses left in.
View on Amazon →