Basic risk management, fixed percentage per trade, stop losses, drawdown limits, is the foundation. It is the minimum standard for trading survival. Advanced risk management extends this thinking to the portfolio level: how trades interact with each other, how capital is allocated across strategies and instruments, and how total exposure is managed as a dynamic system rather than a collection of independent bets.
This is where the transition from good trader to professional happens. A trader who manages individual trade risk at 1% but runs five correlated positions simultaneously has 5% portfolio risk, not 1%. Understanding and managing this distinction is what separates portfolio-level thinking from single-trade thinking.
The Risk Management Hierarchy
| Level | What It Controls | Example |
|---|---|---|
| Trade-level risk | Maximum loss on any single trade | 1% of account per trade via position sizing |
| Daily risk | Maximum loss in a single session | 2-3% daily loss limit. Stop trading if hit. |
| Correlation risk | Combined directional exposure across open trades | Maximum 3% total in same-direction correlated positions |
| Weekly risk | Maximum weekly drawdown before size reduction | 5% weekly limit triggers half-size trading |
| Portfolio drawdown | Total account drawdown limit (full stop) | 10-15% maximum. All trading stops for formal review. |
Correlation Risk: The Hidden Multiplier
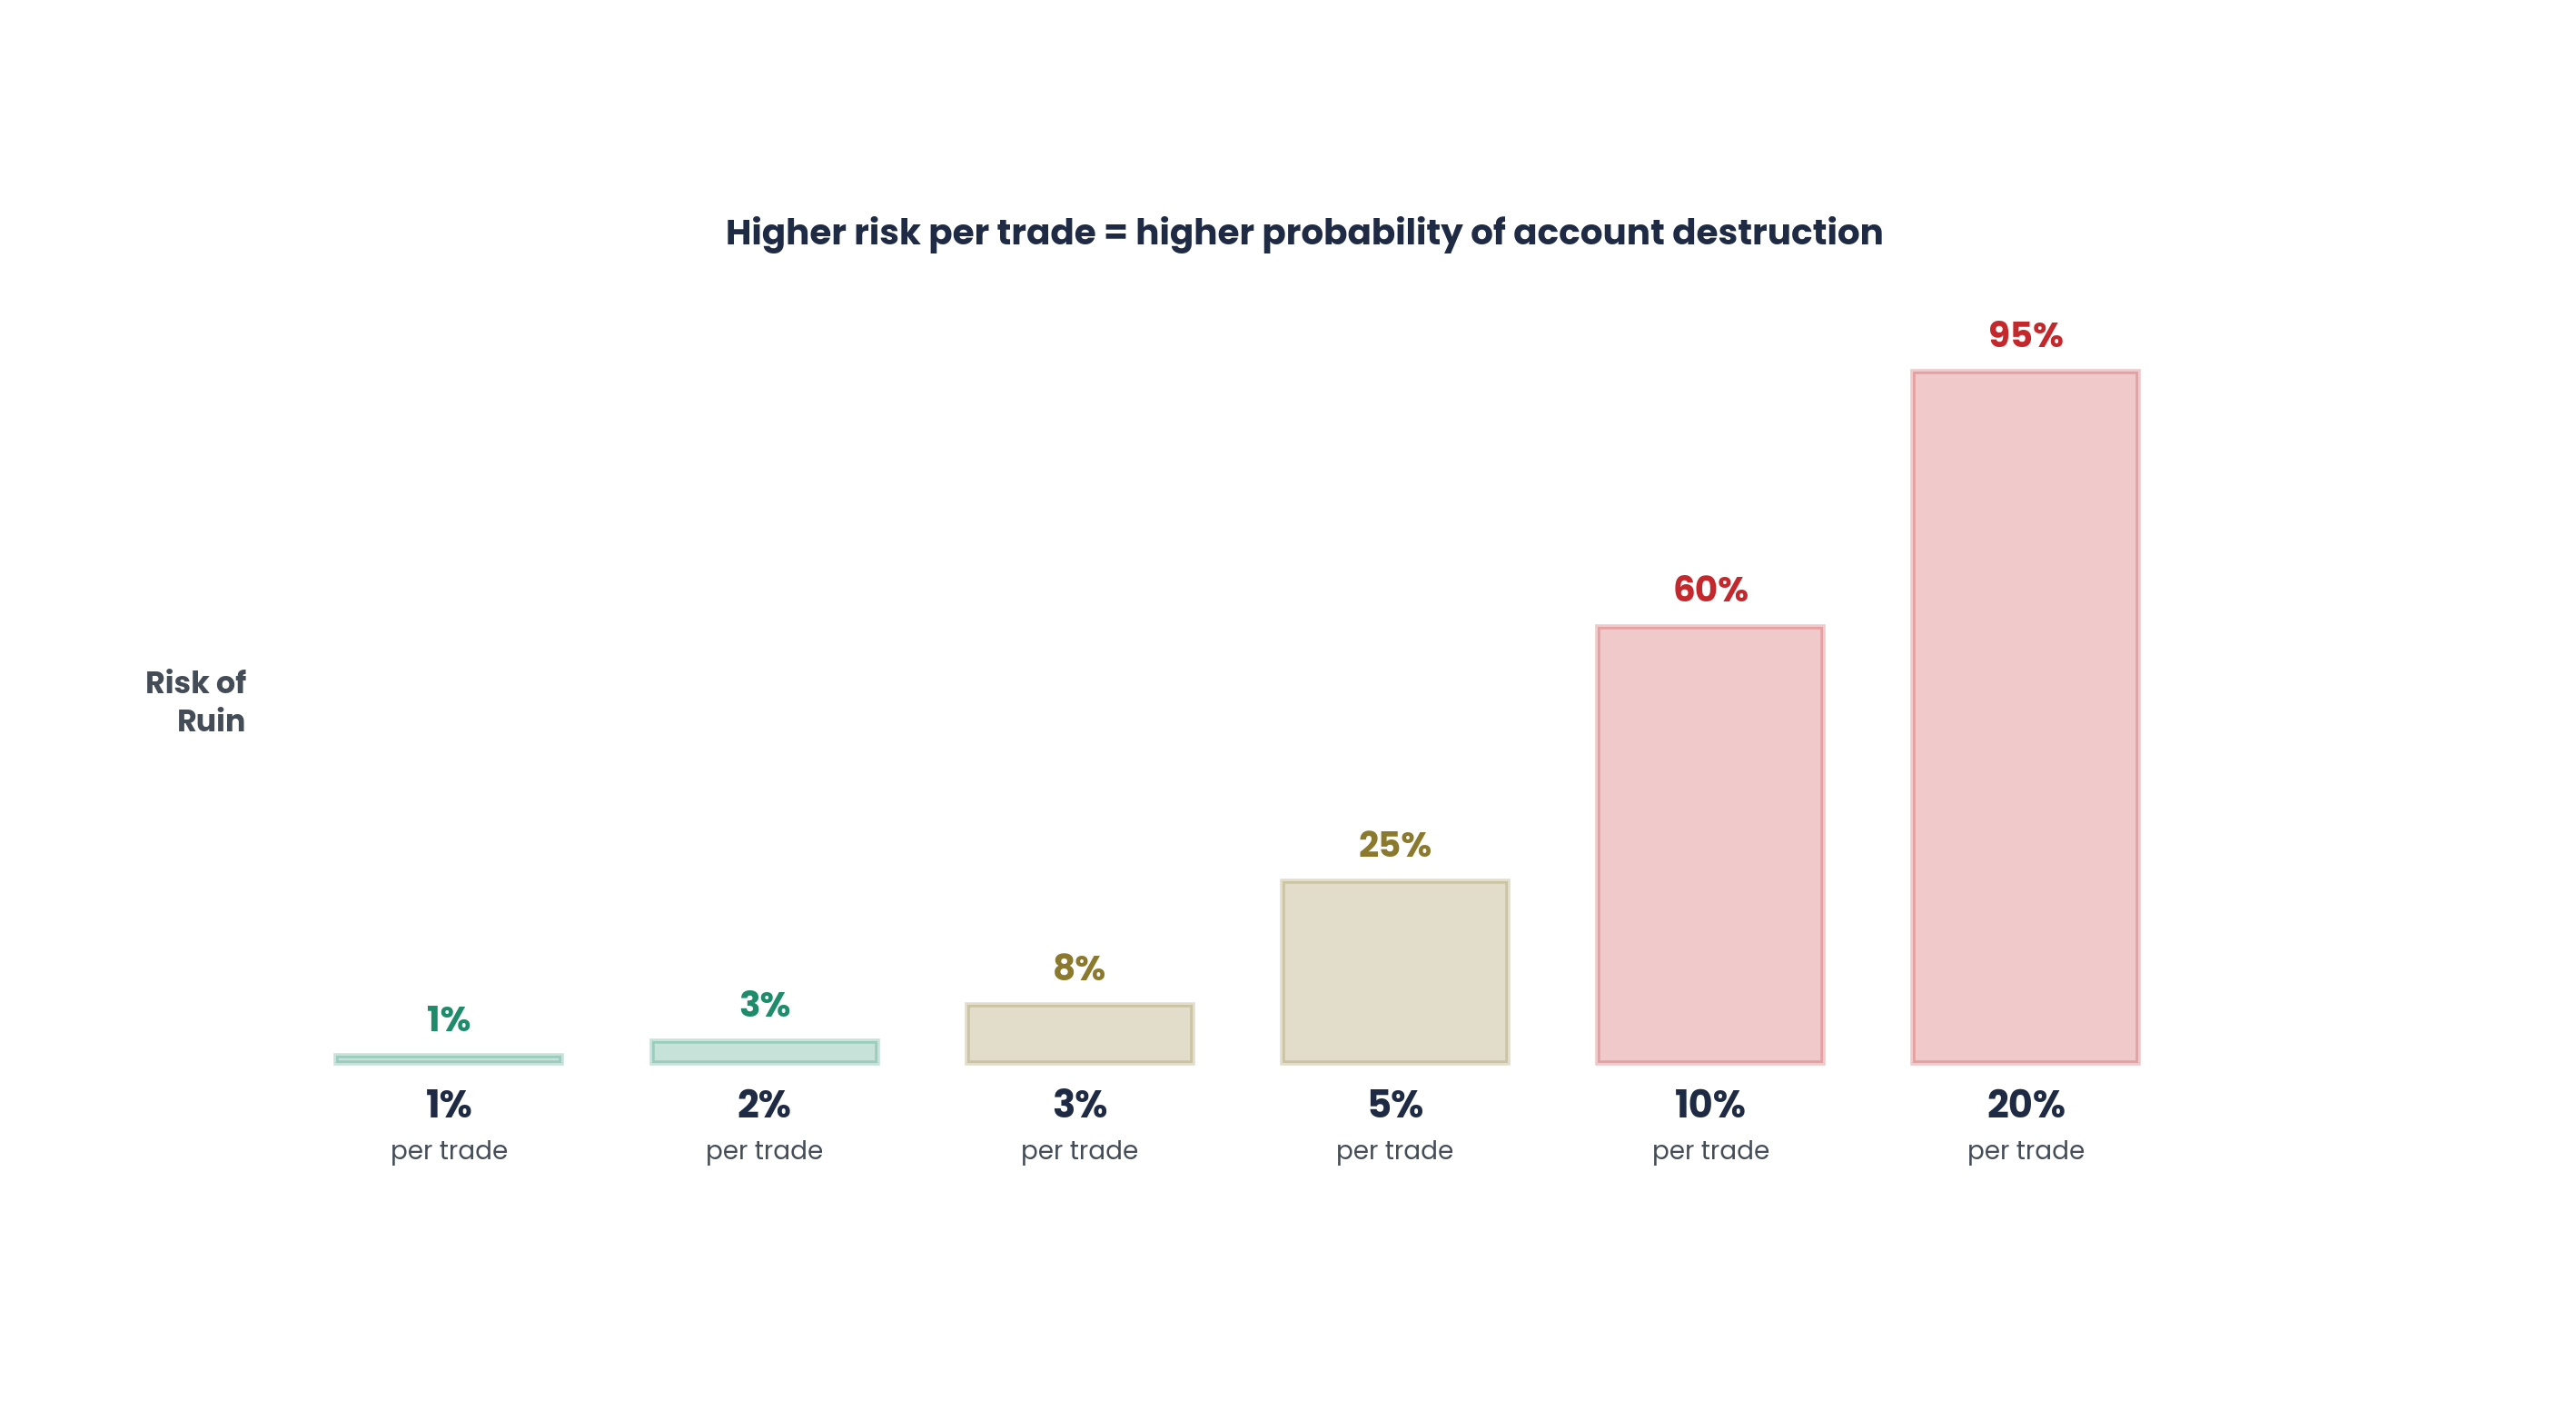
The most common portfolio-level mistake: taking multiple positions in the same direction on correlated instruments and believing you are diversified. If you are simultaneously long EUR/USD, GBP/USD, and AUD/USD, you are not running three 1% risk trades. You are running a single 3% risk trade on US dollar weakness with extra steps. A strong USD data release wipes all three positions simultaneously.
Common correlation clusters to monitor:
USD-correlated: EUR/USD, GBP/USD, AUD/USD, NZD/USD all move inversely to USD strength. Long positions on multiple pairs is concentrated USD-short exposure.
Precious metals: Gold and Silver are highly correlated. Long both at 1% each is effectively 2% directional risk on the metals complex.
Crypto: Almost all altcoins are correlated with BTC. Multiple altcoin longs is concentrated BTC-direction risk.
Index correlation: NQ (Nasdaq) and ES (S&P 500) are correlated. Long both during a “risk on” thesis is concentrated equity-long exposure.
Before adding any position, assess its correlation with your existing open trades. If they move together, treat the combined exposure as a single position for risk purposes. A practical rule: maximum 3% total directional risk across all correlated positions.
Strategy Diversification
Professional portfolio managers run multiple uncorrelated strategies simultaneously because their performance cycles differ. When trend following is in drawdown (ranging market), a mean-reversion approach may be performing well. When range strategies struggle (strong trend breaks out), trend following captures the move. This diversification smooths the equity curve without reducing average returns.
For individual traders, this might mean running a swing strategy on daily charts alongside a session-based day trade approach. Different timeframes, different setups, different market conditions required. The key is genuine non-correlation: two strategies that trade the same setups on different timeframes are not diversified. Two strategies that trade different market conditions (trend following + range fading) are.
Capital Allocation
Not all strategies deserve equal capital. Allocate more to strategies with the longest verified track records, the most backtested data, and the most robust performance across different market conditions. A strategy with 200+ live trades and consistent performance deserves more capital than one with 30 trades and untested edge assumptions.
Review allocations quarterly and rebalance based on verified performance, not recent results. A strategy that had a bad quarter but matches its long-term drawdown expectations should not have capital removed. A strategy that consistently underperforms its backtest should be investigated and potentially shelved.
Maximum Portfolio Drawdown
Define a maximum portfolio drawdown: the total account drawdown at which you stop all trading and enter a formal review period. This should be set below the level at which emotional decision-making is likely to cause additional damage. Typically 10 to 15% for most individual traders, 15 to 20% for diversified multi-strategy portfolios.
This portfolio-level circuit breaker is separate from individual strategy drawdown limits and serves as the ultimate safety net. When it triggers, all strategies are paused. The review asks: was this correlated drawdown across strategies, or independent failures? The answer determines the response.
Key Lessons
- Correlated positions multiply single-trade risk. Assess portfolio-level directional exposure before every entry.
- The risk hierarchy: trade-level, daily, correlation, weekly, portfolio. Each level has defined limits.
- Uncorrelated strategies smooth equity curves without reducing average returns.
- Allocate capital by verified track record quality, not recent performance.
- Define a maximum portfolio drawdown as a hard trading stop to protect against compounding mistakes.
Frequently Asked Questions
How do I measure correlation between instruments?
The simplest practical method: overlay the daily charts of two instruments. If they move in the same direction most of the time, they are positively correlated. More precisely, use a correlation calculator (available on TradingView and most charting platforms) to measure the statistical correlation coefficient. A correlation above +0.7 means the instruments move together frequently enough to be treated as correlated for risk purposes. Below +0.3 means they are sufficiently uncorrelated.
Should I trade multiple instruments or specialise in one?
Start with one. Master its behaviour across conditions. After 3 to 6 months of consistent execution, add a second instrument that is uncorrelated with the first. Many professional day traders actively trade 2 to 3 instruments. More than that splits attention. The portfolio-level thinking described here becomes relevant once you are trading more than one instrument, which is why it is an “advanced” topic.
How many open positions should I have at once?
For most individual traders, 2 to 4 open positions is optimal. This provides enough diversification to smooth results while keeping total portfolio risk manageable and attention focused. A trader running 10 open positions is either taking too much total risk, under-sizing each position to the point of irrelevance, or not monitoring all positions adequately. Quality of attention per position matters.
How does this apply to prop firm trading?
Prop firm drawdown limits (typically 5% daily, 10% total) make portfolio-level risk management essential. Running two correlated trades at 1% risk each uses 2% of your 5% daily limit on what is effectively one directional bet. One adverse move and you are at 40% of your daily limit with a single thesis. Many funded traders limit total correlated exposure to 2% to preserve maximum room within the firm’s rules.
Is this relevant if I only trade one strategy on one instrument?
The correlation and diversification aspects are less relevant, but the risk hierarchy still applies. Daily loss limits, weekly drawdown triggers, and a portfolio-level maximum drawdown are important even for single-strategy, single-instrument traders. These layered limits prevent a bad day from becoming a bad week from becoming a blown account. They are the safety nets that catch you when single-trade risk management is not enough.
Continue Reading
▶ Advanced Risk Management: Beyond the Basics
▶ Risk of Ruin: The Mathematics Every Trader Must Understand
From The Book
This article covers concepts from Chapter 58 of The Complete Trader’s Edge.
 The Complete Trader's Edge
The full Mind · Method · Money framework. 70 chapters.
View on Amazon →
The Complete Trader's Edge
The full Mind · Method · Money framework. 70 chapters.
View on Amazon →
 Market Mayhem
400 years of bubbles, crashes, and the pattern that keeps repeating.
Buy on Amazon →
Market Mayhem
400 years of bubbles, crashes, and the pattern that keeps repeating.
Buy on Amazon →
 Greatest Companies
How the world's greatest companies were built — and what traders learn from them.
View on Amazon →
Greatest Companies
How the world's greatest companies were built — and what traders learn from them.
View on Amazon →
 Greatest Traders
Eighty-six lives that explain the markets — Livermore to Madoff, told with the losses left in.
View on Amazon →
Greatest Traders
Eighty-six lives that explain the markets — Livermore to Madoff, told with the losses left in.
View on Amazon →