Most traders optimise their stops by feel. They place them “below the OB” or “beyond the swing low” and call it a day. Maximum Adverse Excursion changes this from intuition to data. MAE tells you exactly how far against you your winning trades typically move before recovering — and uses that data to determine where your stop should actually be, not where it feels right.
It’s one of the most underused quantitative tools in discretionary trading, and understanding it can eliminate the most frustrating version of trading failure: being stopped out on a valid setup right before the move you anticipated plays out.
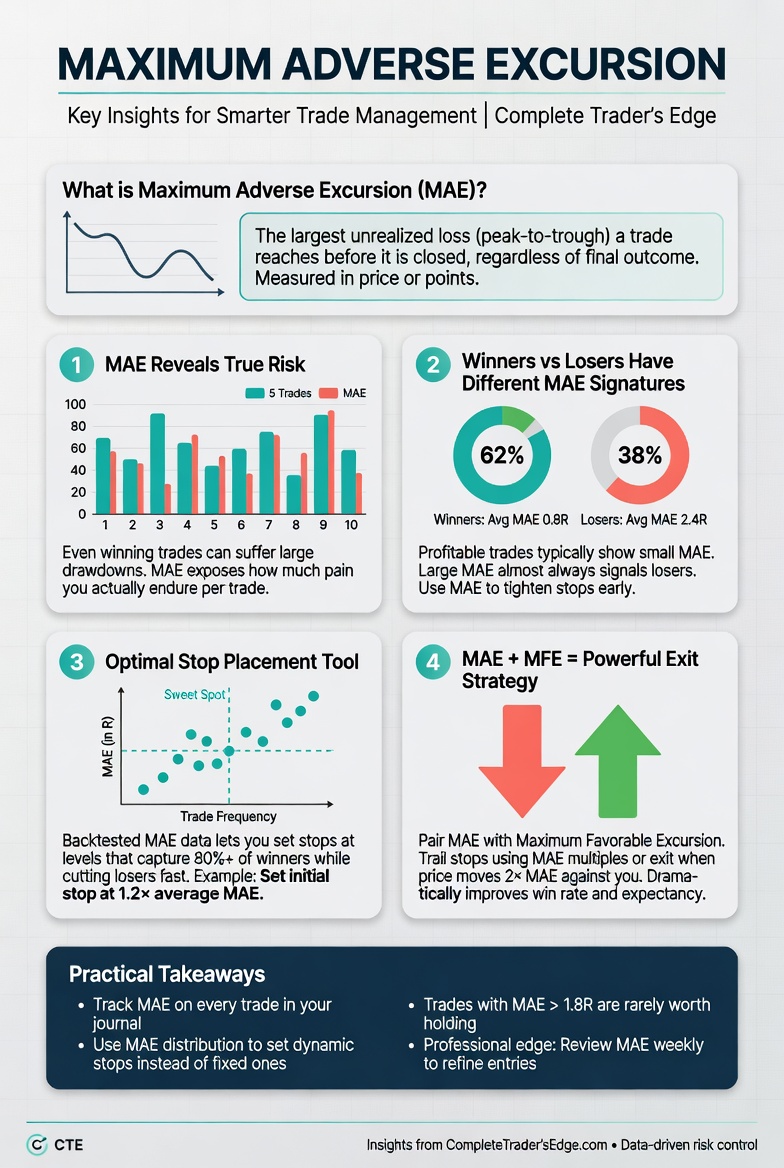
What Maximum Adverse Excursion Means
Maximum Adverse Excursion (MAE) measures how far a trade moves against you, at its worst point, before either hitting your stop or recovering to reach your target.
For any closed trade, MAE is calculated as:
MAE = Entry Price – Lowest Price Reached (for a long trade)
Or expressed in R multiples relative to your stop distance:
MAE% = (Entry – Lowest Point) / (Entry – Stop) × 100
If your stop is 20 pips below entry and price dipped 12 pips against you before recovering, your MAE is 60% of your stop distance. If it dipped 22 pips, it crossed your stop (a loss) with 110% MAE.
The insight comes from plotting this across all your trades.
The MAE Distribution: What It Tells You
When you calculate MAE across 50+ trades and separate winners from losers, a clear pattern emerges in almost every strategy:
Winners cluster at low MAE. The trades that ultimately reach your target tend to have moved against you by a small percentage of your stop distance — typically 30-50% of the stop in the early stages. They show their hand quickly by not retracing deeply.
Losers cluster at high MAE. Trades that eventually stop out tend to have moved toward the stop relatively early. If MAE exceeds 70-80% of the stop distance, the probability of recovery drops substantially.
This distribution creates a decision framework. Trades with MAE below 40% of stop distance: high probability of winning. Trades with MAE approaching 80%+: high probability of stopping out. The MAE data doesn’t just tell you where to put your stop — it tells you whether to hold a trade that’s moving against you.
How to Collect MAE Data
You need to add one column to your trade journal: Worst Point Reached. For every closed trade, record the lowest price reached during the trade (for a long) or the highest price reached (for a short). You already record entry and stop — MAE is one additional data point per trade.
After 50 trades, calculate MAE% for each trade using the formula above, then separate the dataset into winners and losers. Plot them on a simple scatter chart (trade number on X-axis, MAE% on Y-axis, colour-coded by outcome). The clustering pattern will be immediately visible.
Alternatively, paste the dataset into Claude or ChatGPT and ask it to: “Identify the MAE% threshold that best separates winning trades from losing trades in this dataset. Show me the win rate above and below that threshold.”
Using MAE to Set Better Stops
The most direct application: if your winning trades almost never exceed 50% MAE but your stops are placed at 100% (i.e. right at the technical level), you have 50% of your stop distance that is statistically “free” — price never reaches it on winning trades. You could tighten your stop to 60% of its current distance and lose almost no winners while significantly improving your R:R on every trade.
Here’s the process:
Step 1: Calculate MAE% for all winning trades in your sample.
Step 2: Find the 90th percentile MAE — the level that 90% of winners stay within. For example, if 90% of your winners had MAE below 55%, then a stop placed at 60% of the current stop distance would have preserved 90% of your winners.
Step 3: Tighten your stop to the 90th percentile level on future trades, and recalculate R:R based on the tighter stop. If your original stop was 20 pips and the 90th percentile MAE is 55%, your new stop is 12 pips. A trade with a 40-pip target now yields 3.3R instead of 2.0R — from the same entry, same target, just a tighter, data-justified stop.
Using MAE as a Live Trade Management Tool
MAE is not just a historical analysis tool. Once you know your MAE distribution, you can use it in real time during live trades.
The 80% MAE rule: If a live trade moves against you to 80% of your stop distance without showing any sign of reversal (no lower-timeframe structure, no volume change, no rejection candle), the probability of it recovering is substantially below your historical win rate. You have three options:
- Hold to full stop. Correct if your thesis is intact and the setup hasn’t been invalidated.
- Close at 80% MAE. Treat this as a “half loss” — you take 0.8R loss instead of 1R. Over time, this saves a small but real amount of capital.
- Reduce position by 50% at 80% MAE. Lock in a smaller loss on half the position while giving the other half a chance to recover. This is the most nuanced approach and requires tracking in your journal.
The choice between these depends on your strategy’s specific MAE distribution. If your winners regularly dip to 70-75% MAE before recovering (common in ICT setups where price sweeps the stop cluster), then exiting at 80% would eliminate too many winners. If winners almost never exceed 50% MAE, the 80% exit is clearly the better choice.
MAE by Setup Type
One of the most valuable MAE analyses is breaking down the data by setup type. Order Block entries, FVG entries, and sweep-and-rally entries often have meaningfully different MAE profiles:
OB entries: Price often dips into the OB before reversing, so MAE tends to be moderate (40-60% typical). Stops placed below the OB low are frequently tested before the move continues.
FVG entries: FVG fills can be sharp and clean, with lower MAE on successful trades (20-40% typical) but total stop-outs when the gap fills completely and price continues through.
Sweep-and-rally: The sweep itself constitutes the MAE — price sweeps past the stop cluster level before reversing. Stops placed too close to the swept level have high hit rates. MAE data on sweep setups typically shows bimodal distribution: small MAE (clean reversal) or 100%+ MAE (fake sweep, trend continuation).
Understanding which setup type has which MAE profile lets you calibrate stop placement specifically per setup rather than applying one stop rule to every trade.
Frequently Asked Questions
How many trades do I need before MAE data is meaningful?
A minimum of 50 trades per setup type to see reliable patterns. At fewer than 50, the distribution can be dominated by random variance and lead you to false conclusions. Aim for 100+ trades before making permanent changes to your stop placement based on MAE analysis. In the interim, the data is directional — it will point you in the right direction even if the exact thresholds aren’t yet precise.
Does MAE analysis work differently for swing trades vs intraday trades?
Yes, significantly. Swing trades held overnight or over multiple days have much higher absolute MAE because intraday volatility creates larger swings against the position before the multi-day move plays out. For swing trades, MAE is better expressed in ATR multiples rather than pip counts or stop percentages. A Gold swing trade held for 5 days might have a peak MAE of 2 ATR against position before delivering a 6 ATR move in the direction of the thesis. Intraday trades typically have MAE measured in fractions of ATR with tighter distributions.
What software do I use to calculate and visualise MAE?
The simplest approach is a Google Sheets or Excel spreadsheet with your trade data, then a scatter chart with MAE% on the Y-axis colour-coded by outcome. For more advanced analysis, paste your data into Claude or ChatGPT and ask for MAE distribution analysis — it will calculate percentiles, identify the winner/loser threshold, and describe the pattern. TradesViz also calculates MAE automatically if you import your trade history from a supported broker.
Should I use MAE to set stops mechanically or as a guideline?
As a guideline that informs a technically-placed stop. Never place a stop purely based on MAE data without a technical justification. The process is: first find the technically justified stop level (below OB, beyond swing low, beyond the sweep), then check whether MAE data suggests that level is appropriate or whether a tighter level preserves the same percentage of winners. The technical level sets the context; MAE data optimises within that context.
How does MAE relate to Maximum Favourable Excursion (MFE)?
MFE is the opposite measure: how far a trade moved in your favour before closing (at your target, stop, or manual close). Combined, MAE and MFE tell you the full trade “envelope.” MFE analysis typically shows that most winning trades reach significantly beyond your initial target before reversing — which means partial profit-taking strategies (close 50% at 2R, hold 50% to 4R) often leave money on the table less than traders assume. Run both analyses together for a complete picture of how your trades actually behave.
▶ CONTINUE READING
Complete your quantitative edge analysis:
▶ Kelly Criterion for Traders: Optimal Position Sizing Based on Your Win Rate
▶ How to Build a Personal Trading Edge Report Using AI
▶ Asymmetric Risk: How to Structure Trades Where You Can Be Wrong 60% of the Time
The Complete Trader’s Edge
Chapter 61 covers quantitative trade analysis including MAE, MFE, and the systematic approach to improving stop placement and trade management using your own historical data.
 The Complete Trader's Edge
The full Mind · Method · Money framework. 70 chapters.
View on Amazon →
The Complete Trader's Edge
The full Mind · Method · Money framework. 70 chapters.
View on Amazon →
 Market Mayhem
400 years of bubbles, crashes, and the pattern that keeps repeating.
Buy on Amazon →
Market Mayhem
400 years of bubbles, crashes, and the pattern that keeps repeating.
Buy on Amazon →