The Kelly Criterion is the mathematically optimal formula for position sizing. Given a known win rate and known average win/loss ratio, it tells you the exact percentage of your capital to risk on each trade to maximise long-run growth while avoiding ruin. It was originally developed for gambling theory by Bell Labs mathematician John L. Kelly Jr. in 1956. Traders have been applying it — and misapplying it — ever since.
This guide explains how Kelly actually works, why you should almost never use the full Kelly number, and how to apply a practical fractional Kelly approach using your actual historical win rate and R multiples.
The Kelly Formula Explained
The full Kelly formula is:
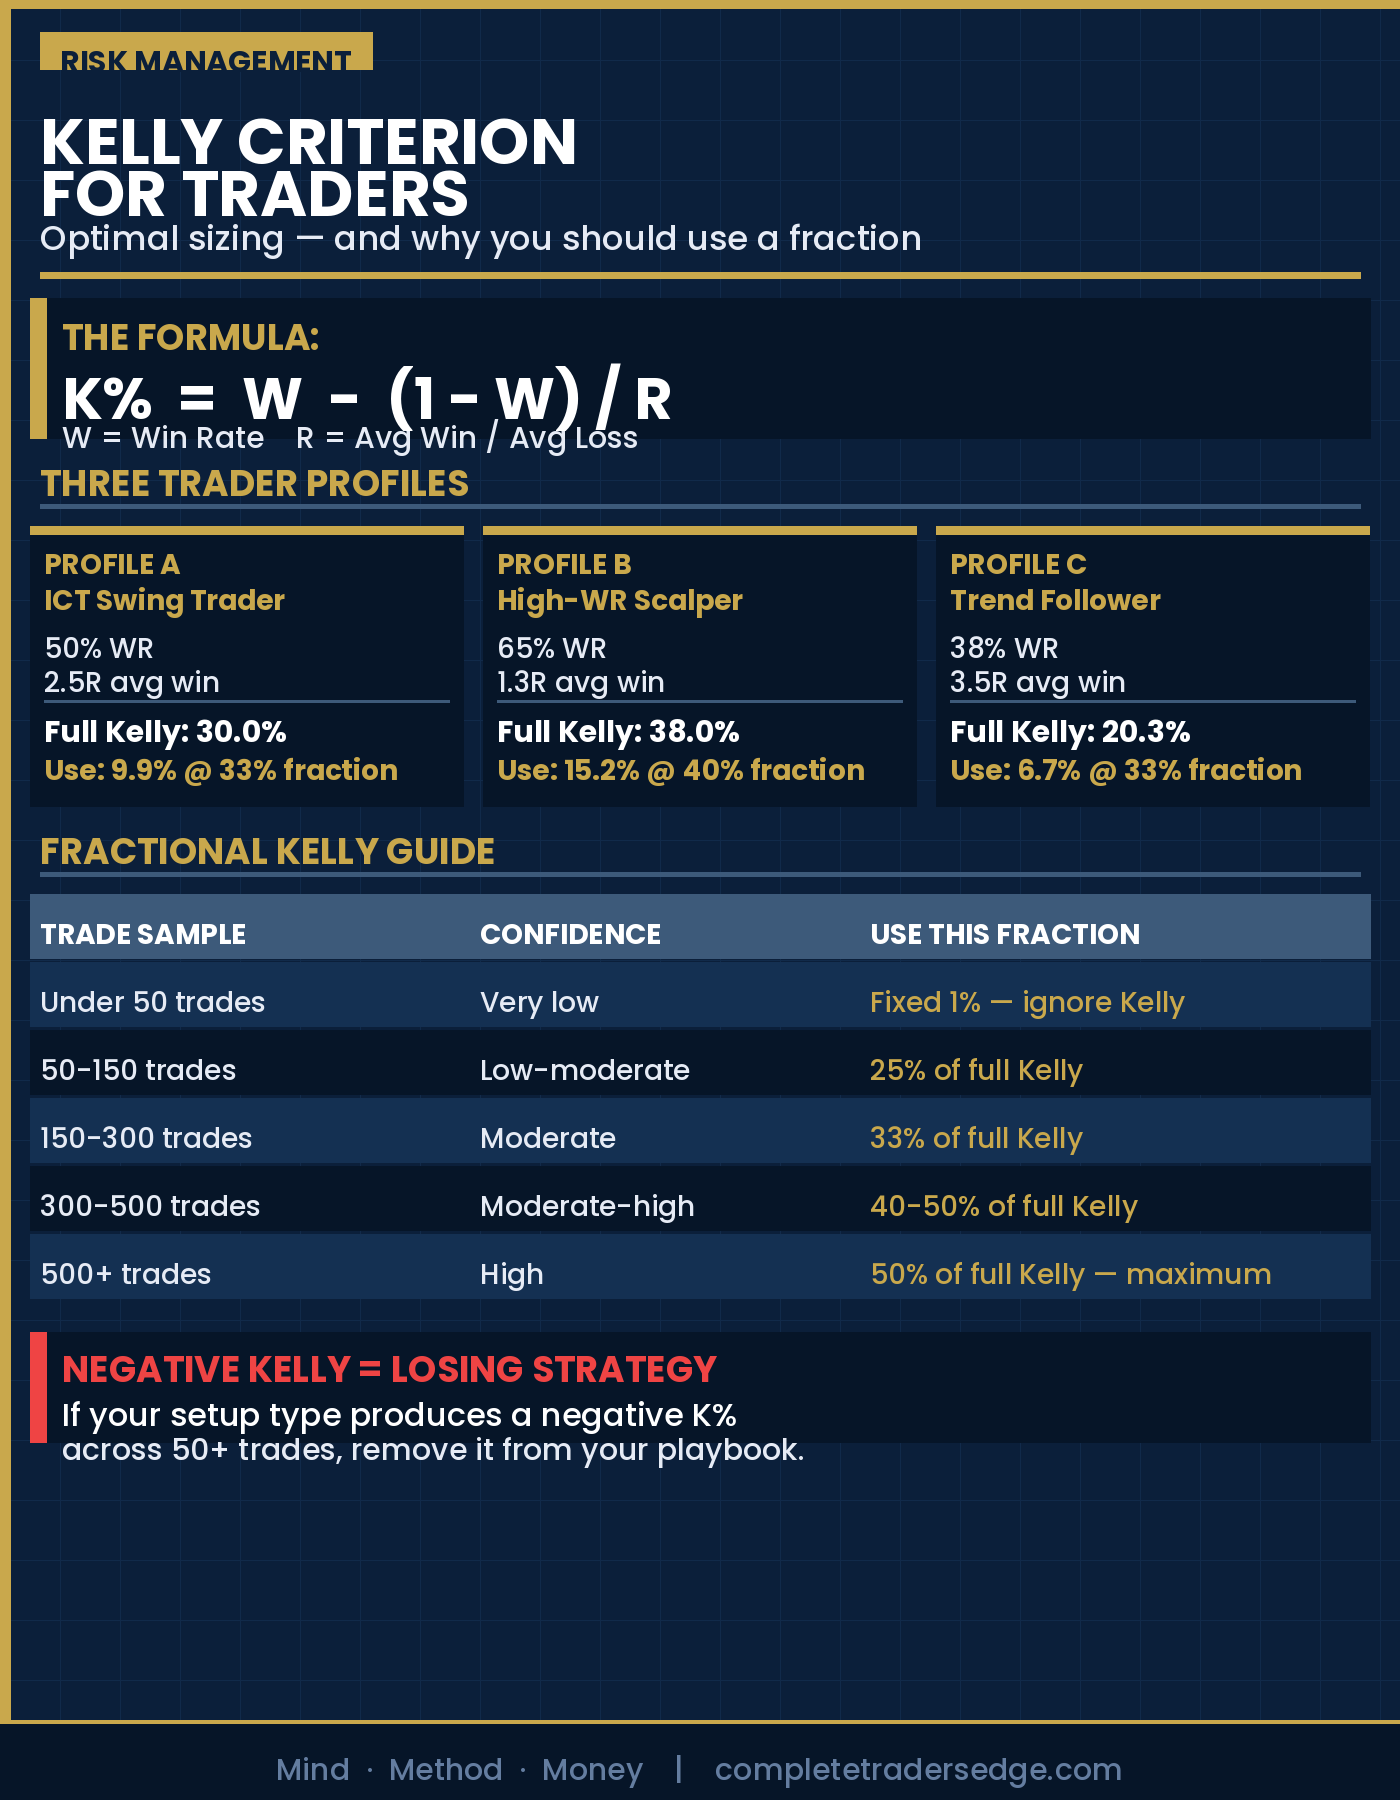
K% = W – (1 – W) / R
Where:
- K% = the percentage of your capital to risk per trade
- W = your win rate as a decimal (e.g. 0.55 for 55%)
- R = your average win divided by your average loss (the win/loss ratio)
Example: You have a 55% win rate and your average winner returns 2R while your average loser costs 1R. Your R ratio is 2.0.
K% = 0.55 – (1 – 0.55) / 2.0 = 0.55 – 0.225 = 0.325 = 32.5%
According to Kelly, you should risk 32.5% of your capital on each trade. If you do this consistently with these exact statistics, your capital grows at the maximum possible rate over time. In practice, you will never risk 32.5% per trade. Here’s why.
Why Full Kelly Will Destroy Most Traders
Full Kelly is mathematically optimal under conditions that almost never hold in real trading:
Kelly assumes your statistics are precisely known. A 55% win rate based on 100 trades has a confidence interval of roughly ±10%. Your true win rate might be anywhere from 45% to 65%. At 45% win rate with a 2R ratio, the full Kelly drops to 7.5%. Applying the 32.5% number when your actual win rate is 45% produces catastrophic drawdowns.
Kelly assumes independent, identical trades. Real trades are neither. Market conditions change. Execution varies. A string of correlated losses in a single market regime can hit far harder than a random distribution would suggest.
Kelly drawdowns are psychologically unbearable. Full Kelly portfolios can see drawdowns of 30-50% even when the underlying statistics are sound. Very few traders can maintain discipline through a 40% drawdown, regardless of mathematical optimality.
The solution is fractional Kelly.
Fractional Kelly: The Practical Approach
Fractional Kelly means using a fraction of the Kelly number, typically between 25% and 50% of the full Kelly recommendation. This sacrifices some theoretical growth rate in exchange for dramatically smaller drawdowns and more consistent compounding.
| Trade Sample Size | Statistical Confidence | Recommended Fraction |
|---|---|---|
| Under 50 trades | Very low | Use fixed 1% — ignore Kelly |
| 50-150 trades | Low-moderate | 25% of full Kelly |
| 150-300 trades | Moderate | 33% of full Kelly |
| 300-500 trades | Moderate-high | 40-50% of full Kelly |
| 500+ trades | High (stable conditions) | 50% of full Kelly max |
Almost no discretionary retail trader should go above 50% Kelly. The theoretical advantages of higher fractions are real only in conditions of near-perfect statistical certainty that retail trading cannot provide.
Calculating Your Kelly Number: Three Real Profiles
Profile A: Conservative ICT Trader
Win rate: 50% | Average winner: 2.5R | Average loser: 1R | R ratio: 2.5
Full Kelly: 0.50 – (0.50 / 2.5) = 0.50 – 0.20 = 30%
At 150 trades (33% fraction): 30% × 0.33 = 9.9% per trade. Still far above a sensible personal cap. Apply a hard maximum of 1-2% regardless.
Profile B: Higher Win Rate Scalper
Win rate: 65% | Average winner: 1.3R | Average loser: 1R | R ratio: 1.3
Full Kelly: 0.65 – (0.35 / 1.3) = 0.65 – 0.27 = 38%
At 300 trades (40% fraction): 38% × 0.40 = 15.2%. Again, Kelly confirms strong edge. It doesn’t mean stake 15% per trade.
Profile C: Low Win Rate Trend Trader
Win rate: 38% | Average winner: 3.5R | Average loser: 1R | R ratio: 3.5
Full Kelly: 0.38 – (0.62 / 3.5) = 0.38 – 0.177 = 20.3%
At 200 trades (33% fraction): 20.3% × 0.33 = 6.7%. Positive Kelly across all three profiles. The most important insight: Kelly is most useful as an edge confirmation test, not as a position sizing formula to apply literally.
The Real Use Case: Using Kelly to Validate Your Edge
Most discretionary retail traders should not mechanically apply Kelly to their position sizing. The variance is too high and the psychological tolerance for Kelly-level drawdowns is too low.
Where Kelly is genuinely valuable is as a quarterly edge validation test:
Calculate your Kelly number every 90 days using your rolling trade statistics. A positive and stable Kelly number is the single best quantitative confirmation that your strategy has real edge. A declining Kelly number over three consecutive quarters signals that your edge is eroding and requires investigation before you continue scaling.
Compare Kelly across setup types. Calculate Kelly separately for your OB setups, FVG setups, and sweep-and-rally setups. The setup with the highest Kelly number is your strongest edge. Allocate more of your trading attention to it.
Use negative Kelly as a hard stop signal. If a specific setup type produces a negative Kelly number across 50+ trades, it is a losing pattern. Remove it from your playbook regardless of how good it looks on charts. The math doesn’t lie.
Kelly and the 1% Rule
The standard 1% risk rule is approximately equivalent to a very conservative fractional Kelly, roughly 5-10% of full Kelly for most strategies with positive expectancy. This conservatism is entirely deliberate. The 1% rule exists to keep you in the game long enough for your edge to express itself statistically.
A positive-expectancy strategy needs enough trades to overcome short-term variance. At 1% risk, even a 20-trade losing streak produces only a 20% drawdown — painful but survivable. At 3% risk, the same streak produces a 60% drawdown, from which recovery requires a 150% gain. The 1% rule is not leaving money on the table. It is the minimum variance path to letting your edge compound.
Frequently Asked Questions
What win rate do I need for Kelly to show positive edge?
The Kelly number is positive whenever your win rate multiplied by your average win/loss ratio exceeds your loss rate. The minimum win rate at a 2R average winner is 33.3%. At 1.5R average winner the minimum is 40%. At 1R even (breakeven ratio) you need above 50%. For a meaningful positive Kelly, aim to be at least 5-10 percentage points above the break-even minimum for your R ratio.
How often should I recalculate my Kelly number?
Quarterly, using a rolling 90-day trade sample. This is frequent enough to catch meaningful changes in your edge while smoothing out short-term variance. Never recalculate after a single winning or losing streak — the sample is too small to be meaningful. If your Kelly number shifts dramatically between quarters, investigate whether market conditions have changed or your execution has drifted before adjusting your sizing.
Can I use Kelly for prop firm accounts?
In theory yes, but in practice the prop firm’s daily loss limit and drawdown ceiling will almost always be the binding constraint before the Kelly number becomes relevant. Use Kelly for edge validation on prop firm accounts. Use the daily loss limit framework (never more than 25-30% of your daily limit per trade) for actual position sizing. The two frameworks complement rather than compete with each other.
Does Kelly work differently for long vs short trades?
Kelly makes no distinction between long and short. However, if your win rate on longs differs meaningfully from your win rate on shorts (common among ICT traders in equity indices, where the long bias is structurally stronger), calculate Kelly separately for each direction. Applying a combined Kelly to a strategy where longs have 60% win rate and shorts have 38% will underrepresent your long edge and overstate the short edge. Split the calculation to see where your real advantage lies.
Is Kelly applicable to trading or only to gambling?
Kelly was derived from information theory and is mathematically applicable to any binary outcome with known probabilities and payoffs. The difference between trading and the gambling scenarios Kelly was designed for is that trading statistics are estimates, not exact probabilities, and they change over time. This is precisely why fractional Kelly is the appropriate trading application rather than the theoretical full Kelly number.
▶ CONTINUE READING
Complete your position sizing framework:
▶ Prop Firm Risk Calculator: How to Size Every Trade on a Funded Account
▶ Risk of Ruin: The Math Every Trader Ignores
▶ Correlation Risk: Why Trading Gold and NQ at the Same Time Can Double Your Exposure
The Complete Trader’s Edge
Chapter 56 covers the full position sizing toolkit including Kelly Criterion, fixed fractional sizing, and how to choose the right model for your account size and risk tolerance.
 The Complete Trader's Edge
The full Mind · Method · Money framework. 70 chapters.
View on Amazon →
The Complete Trader's Edge
The full Mind · Method · Money framework. 70 chapters.
View on Amazon →
 Market Mayhem
400 years of bubbles, crashes, and the pattern that keeps repeating.
Buy on Amazon →
Market Mayhem
400 years of bubbles, crashes, and the pattern that keeps repeating.
Buy on Amazon →