Richard Wyckoff developed his method of market analysis in the early 1900s working alongside the most successful operators of his era: J.P. Morgan, Jesse Livermore, and other titans of the Wall Street tape-reading age. Nearly a century later, it remains one of the most accurate frameworks for reading institutional behaviour in markets. Smart Money Concepts, ICT, and virtually every modern institutional trading methodology traces its roots to Wyckoff’s observations.
This guide covers the complete Wyckoff framework: the three laws that govern market behaviour, the four phases of the cycle, the nine buying and nine selling tests that experienced Wyckoff traders use to confirm phase transitions, the composite operator mental model, and how every Wyckoff concept maps directly to modern ICT terminology.
What Is the Wyckoff Method?
The Wyckoff Method is a technical analysis framework that interprets market action as the deliberate work of large institutional traders. It describes how those institutions accumulate positions at low prices, mark them up to higher prices, distribute them to the public near the top, and then mark them back down to start the cycle again. By identifying which phase the market is currently in, a trader positions alongside institutional order flow rather than against it.
Who Was Richard Wyckoff?
Richard Demille Wyckoff began his Wall Street career in 1888 at age fifteen. By his forties he was one of the most respected market analysts in America, publishing The Magazine of Wall Street and operating a tape-reading school that trained thousands of traders. Unlike most of his contemporaries, Wyckoff was not a chart pattern enthusiast. He was an obsessive observer of how price moved. He noted that markets did not move randomly but rather displayed repeating, characteristic phases driven by the behaviour of large operators with capital sufficient to influence price.
His genius was in extracting that behaviour into a teachable system. The Wyckoff Method as taught today, principally through the Wyckoff Stock Market Institute and the SMI Foundation, remains substantially faithful to his original work. The frameworks ICT and Smart Money Concepts now teach are, at their structural core, simplified extensions of what Wyckoff was publishing a century ago.
The Three Wyckoff Laws
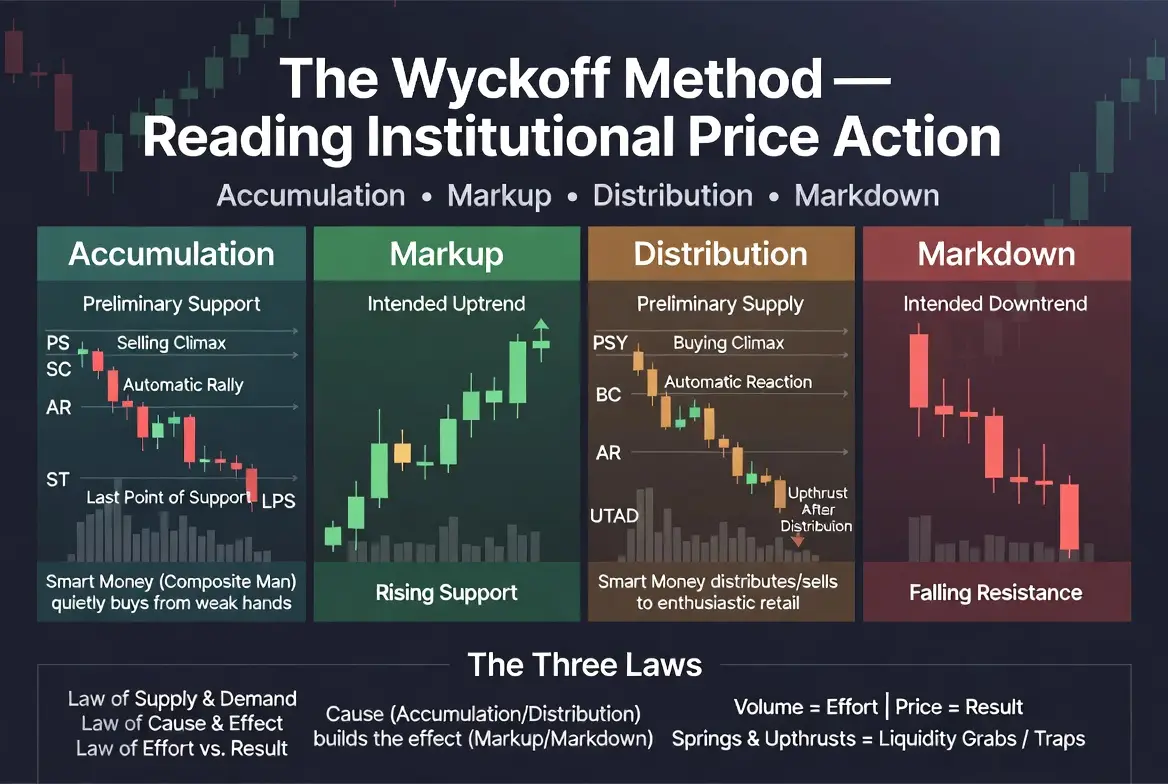
1. The Law of Supply and Demand
When demand exceeds supply, prices rise. When supply exceeds demand, prices fall. Wyckoff’s contribution was in showing how to read this imbalance through the behaviour of price and volume before the resulting move occurs. The signature is in the texture of the tape: how quickly price moves on what kind of volume, where it stalls, where it accelerates.
2. The Law of Cause and Effect
Price doesn’t move randomly. Every significant trend is the effect of a cause built up over time. A period of accumulation (cause) precedes a markup phase (effect). The size of the cause determines the size of the subsequent move. A long, wide accumulation range produces a long, sustained uptrend. A short accumulation produces a short uptrend. This relationship lets Wyckoff traders estimate target ranges before the move begins.
3. The Law of Effort vs Result
Volume represents effort. Price movement represents result. When volume and price movement are in harmony (rising volume with rising price, declining volume on pullbacks), the trend is healthy. When they diverge (high volume with little price movement, or large price movement on weak volume), a change in direction is likely. Effort-vs-result divergences are among the earliest warning signs of a phase transition.
The Composite Operator: Wyckoff’s Mental Model
Wyckoff asked traders to imagine that all market activity is orchestrated by a single large operator: the Composite Man, also called the Composite Operator. This Composite Operator has effectively unlimited capital, perfect patience, and a clear plan. He accumulates large positions at low prices when the public is fearful, marks prices up to attract retail attention, distributes those positions to a euphoric public near the top, and then marks prices back down.
This mental model aligns precisely with modern Smart Money Concepts. The Composite Operator is the aggregate of institutional flow: hedge funds, central banks, prop desks, and large family offices. His footprints are readable in price and volume because his orders are too large to fill silently. The patterns left behind by his accumulation and distribution become the order blocks, fair value gaps, and liquidity zones that ICT traders use today.
The Four Phases of the Wyckoff Cycle
Every market, on every timeframe, moves through four distinct phases. Recognising which phase is in play is the foundational Wyckoff skill.
| Wyckoff Phase | What Happens | ICT Equivalent | How to Trade It |
|---|---|---|---|
| Accumulation | Institutions quietly build long positions in a range | Demand zone / bullish Order Block formation | Mark the range. Wait for the Spring. |
| Spring (shakeout) | Price drops below range support, sweeps stops, reverses | Liquidity sweep / stop hunt | Enter long after reversal confirmation (ChoCH). |
| Markup | Price trends upward with higher highs and higher lows | BOS continuation / trend phase | Buy pullbacks to OBs and FVGs within the trend. |
| Distribution | Institutions quietly sell positions in a range at higher prices | Supply zone / bearish OB formation | Mark the range. Watch for Upthrust. |
| Upthrust (UTAD) | Price breaks above range resistance, sweeps stops, reverses | Liquidity sweep above equal highs | Enter short after reversal confirmation. |
| Markdown | Price trends downward with lower highs and lower lows | Bearish BOS / downtrend phase | Sell rallies into bearish OBs and supply zones. |
Phase 1: Accumulation (The Setup)
After a sustained downtrend, the Composite Operator begins buying large quantities without significantly moving price. The market appears sideways, often boring, often described by retail commentary as “going nowhere.” Underneath, ownership is transferring from weak hands (panicked retail) to strong hands (institutional buyers).
Key events of an accumulation range, in approximate order:
- Preliminary Support (PS): First sign that strong hands are buying. Selling pressure begins to absorb.
- Selling Climax (SC): Final flush of weak hands at the bottom of the range, often on high volume.
- Automatic Rally (AR): Rebound from the Selling Climax. Defines the upper boundary of the accumulation range.
- Secondary Test (ST): Return to the SC area on lower volume, confirming the low.
- Spring: A final stop-hunt below range support that triggers retail panic-selling before reversing. The Composite Operator fills final positions on this shakeout.
- Last Point of Support (LPS): A successful test of support, often higher than the Spring, confirming the accumulation is complete.
- Sign of Strength (SOS): Decisive bullish move out of the range on increased volume. Markup begins.
Phase 2: Markup (The Trend Up)
The Composite Operator has accumulated his position. Now he marks price up by reducing his selling and continuing to absorb supply. Volume increases on up days and decreases on pullbacks. Price prints higher highs and higher lows on the chart. The best entries during markup occur on pullbacks to rising support levels, particularly where previous resistance becomes support (role reversal).
Markup typically continues until retail enthusiasm peaks and the Composite Operator begins to look for an exit at higher prices.
Phase 3: Distribution (The Exit)
At elevated prices, with retail euphoria providing the demand he needs, the Composite Operator begins selling his position. Distribution appears as another sideways range, structurally similar to accumulation but with the imbalance now in favour of supply.
Key events of a distribution range:
- Preliminary Supply (PSY): First significant selling pressure. Strong hands begin distributing.
- Buying Climax (BC): Final retail buying frenzy at the top, often on high volume.
- Automatic Reaction (AR): Sharp decline from the Buying Climax. Defines the lower boundary of the distribution range.
- Secondary Test (ST): Return toward the BC area on lower volume.
- Upthrust (UT) or Upthrust After Distribution (UTAD): A false break above range resistance that traps late buyers. Mirror image of the Spring.
- Sign of Weakness (SOW): Decisive bearish move out of the range. Markdown begins.
Phase 4: Markdown (The Trend Down)
Distribution complete, prices fall. Volume increases on down days. Lower highs and lower lows print on the chart. The mirror image of markup. Best entries during markdown occur on rallies into former support (now resistance) and on retests of broken structure.
Eventually markdown exhausts and a new accumulation begins. The cycle repeats. This four-phase pattern plays out on every timeframe from the 5-minute chart to the multi-year secular cycle, and it has done so consistently for over a century.
Wyckoff’s Nine Buying Tests and Nine Selling Tests
This is the section most modern guides skip, and it’s where Wyckoff’s real practical value lies. To confirm that an accumulation phase is complete and a markup is about to begin, Wyckoff used a checklist of nine buying tests. To confirm distribution into markdown, he used nine selling tests. A position should only be opened when a sufficient number of tests have been passed.
The Nine Buying Tests (confirms accumulation is complete, markup beginning)
- Downside price objective has been accomplished
- Preliminary Support, Selling Climax, Secondary Test have occurred
- Activity is bullish (volume increases on rallies, decreases on reactions)
- Downward stride has been broken (a trendline drawn from prior highs has been violated to the upside)
- Higher supports and higher tops are forming
- A potential Spring or test of the Selling Climax has occurred
- Higher lows are forming on the bar chart
- The relative strength of the stock is improving versus the broader market
- The base is large enough to allow for a substantial upside move (Law of Cause and Effect)
The Nine Selling Tests (confirms distribution is complete, markdown beginning)
- Upside price objective has been accomplished
- Preliminary Supply, Buying Climax, Secondary Test have occurred
- Activity is bearish (volume increases on declines, decreases on rallies)
- Upward stride has been broken (a trendline drawn from prior lows has been violated to the downside)
- Lower tops and lower bottoms are forming
- A potential Upthrust or test of the Buying Climax has occurred
- Lower highs are forming on the bar chart
- The relative strength of the stock is deteriorating versus the broader market
- The top is large enough to allow for a substantial downside move
A real Wyckoff trader rarely enters on fewer than 5–6 confirmed tests. This systematic verification is what separates the Wyckoff approach from naive trend-following: the patience to wait for structural confirmation rather than chasing every potential reversal.
The Spring and the Upthrust: The Most Tradable Wyckoff Events
If you take only one thing from the Wyckoff framework into your trading, it should be Spring and Upthrust identification. These two events represent the highest-probability entries in the entire methodology.
A Spring is a brief penetration below the support of an accumulation range. Price drops below support, triggering retail stop-loss orders. Those stop orders provide the final block of liquidity the Composite Operator needs to complete his accumulation. Price then quickly reverses back into the range and begins the markup phase. Entry: long, after price closes back inside the range. Stop: below the Spring low.
An Upthrust is the mirror: a brief penetration above the resistance of a distribution range that traps late buyers and provides liquidity for the Composite Operator to complete his distribution. Entry: short, after price closes back inside the range. Stop: above the Upthrust high.
In ICT terminology, both Springs and Upthrusts are liquidity sweeps. The structural logic is identical; only the vocabulary differs.
Wyckoff and ICT: Two Frameworks, One Truth
ICT concepts are, at their core, a modern granular extension of Wyckoff’s original observations. The vocabulary differs but the mechanics are identical:
| Wyckoff Term | ICT / SMC Equivalent |
|---|---|
| Accumulation range | Demand zone formation |
| Spring | Liquidity sweep / stop hunt below equal lows |
| Sign of Strength (SOS) | Break of Structure (BOS) |
| Last Point of Support (LPS) | Order Block retest |
| Distribution range | Supply zone formation |
| Upthrust (UTAD) | Liquidity sweep above equal highs |
| Composite Operator | Smart Money / institutional flow |
Understanding Wyckoff gives you the macro structure. ICT gives you the entry precision. Together, they form a complete picture of institutional price delivery. The most sophisticated price action traders run both frameworks simultaneously: Wyckoff for phase identification, ICT for execution timing.
Wyckoff and the Classical Chart Patterns
Wyckoff’s accumulation schematic and the classical rectangle pattern are the same object described by two traditions. A rectangle is a sideways range between two flat boundaries. Accumulation is a sideways range in which a large operator absorbs supply without moving the price against themselves. The chartist names the shape; Wyckoff explains the cause. Distribution and the rectangle top work the same way in reverse.
The overlap is worth knowing, because the classical tradition has something Wyckoff does not: a large body of published outcome data. Across nine years of live breakout signals covering more than two thousand completed formations, the rectangle posted the highest success rate of the eight classical patterns tracked. That is external corroboration, from a completely different analytical tradition, for the central Wyckoff claim that ranges are where the meaningful work gets done. The complete chart patterns guide sets out that data and the full translation between the two vocabularies.
Wyckoff in Modern Markets
Modern markets are faster, more liquid, and operate 24 hours. The schematics don’t always play out exactly as drawn in textbooks from the 1930s. What hasn’t changed is the underlying human behaviour and institutional logic. Use Wyckoff not as a rigid schematic to overlay on a chart, but as a mental model for interpreting why price is doing what it’s doing.
If anything, the patterns Wyckoff identified are more systematic in modern markets, not less. Algorithmic trading executes institutional strategies with greater precision than human traders ever could. The accumulation-markup-distribution-markdown cycle now repeats with greater regularity because it has been systematised by the very institutions Wyckoff was studying.
How to Start Trading the Wyckoff Method
- Step 1: Identify the current phase on the higher timeframe (Daily or Weekly). Is the market in accumulation, markup, distribution, or markdown?
- Step 2: If in accumulation or distribution, mark the range boundaries (range high, range low). Watch for Springs (longs) or Upthrusts (shorts).
- Step 3: If in markup or markdown, identify the trend structure. Mark the most recent swing levels. Plan entries on pullbacks to former resistance (now support) for markups, and former support (now resistance) for markdowns.
- Step 4: Use the buying or selling tests as a checklist before any entry. The more confirmed, the higher the probability.
- Step 5: Drop to a lower timeframe (1H or 15M) for entry timing only. The higher timeframe defines the trade; the lower timeframe just times it.
Frequently Asked Questions
What is the Wyckoff Method?
The Wyckoff Method is a technical analysis framework developed by Richard D. Wyckoff in the early 1900s. It describes how large institutional traders (the “Composite Operator”) accumulate and distribute positions through four distinct phases: accumulation, markup, distribution, and markdown. By identifying which phase the market is in, traders can position themselves alongside institutional order flow rather than against it.
What is the Wyckoff Spring?
The Spring is a brief penetration below the support of an accumulation range that triggers stop losses, providing liquidity for institutions to complete their buying. Price quickly reverses back into the range and then begins the markup phase. In ICT terminology, this is a liquidity sweep. The Spring is one of the highest-probability entry signals in the entire Wyckoff framework.
What are the nine Wyckoff buying tests?
The nine buying tests are a checklist Wyckoff used to confirm that an accumulation phase was complete and a markup was about to begin: downside objective accomplished, the structural events (PS, SC, ST) have occurred, activity is bullish, downward stride broken, higher supports forming, a Spring or test occurred, higher lows forming, relative strength improving versus the broader market, and the base is large enough for a substantial move. A real Wyckoff trader waits for at least 5–6 tests to be confirmed before entering long.
How does Wyckoff relate to ICT concepts?
Wyckoff and ICT describe the same institutional behaviour through different vocabularies. Wyckoff’s accumulation is ICT’s demand zone. The Spring is a liquidity sweep. The Sign of Strength (SOS) is a Break of Structure. The Composite Operator is smart money. Learning both frameworks gives you a more complete understanding of institutional price delivery because each provides insights the other does not emphasise.
Can I combine Wyckoff with ICT trading?
Yes, and this combination is powerful. Wyckoff provides the macro framework (identifying accumulation/distribution phases on higher timeframes). ICT provides the precision entry tools (Order Blocks, Fair Value Gaps, Kill Zone timing). Use Wyckoff to identify the phase and ICT to time the entry.
Is the Wyckoff Method still relevant in 2026?
More relevant than ever. The Wyckoff Method describes how large participants engineer price movement to fill their orders. This dynamic has not changed in 100 years and has been amplified by algorithmic trading, which executes institutional strategies with greater precision and speed. The patterns Wyckoff identified are more systematic and repeatable in modern markets, not less.
What’s the difference between a Spring and a regular false breakout?
A Spring is a false breakout below the support of an accumulation range — meaning there is structural context (a developed range, prior Selling Climax, prior Secondary Test) that classifies it as a Spring. A random false breakout in a trending market is not a Spring; it’s just noise. Context is what differentiates the two. The Spring is the engineered false breakout designed to trigger one final round of stop-loss orders before the real markup begins.
How long can a Wyckoff accumulation phase last?
From hours to years, depending on the timeframe and the instrument. On a 1-hour chart, accumulation may complete in 8–24 hours. On a daily chart, it commonly spans 2–6 months. Major macro accumulations after bear markets can take 1–3 years. The Law of Cause and Effect predicts that the longer the accumulation, the larger the subsequent markup. Patient Wyckoff traders look for long, well-developed accumulations on higher timeframes because the resulting moves are correspondingly large.
From The Book
This article covers concepts from Chapter 34 of The Complete Trader’s Edge.
 The Complete Trader's Edge
The full Mind · Method · Money framework. 70 chapters.
View on Amazon →
The Complete Trader's Edge
The full Mind · Method · Money framework. 70 chapters.
View on Amazon →
 Market Mayhem
400 years of bubbles, crashes, and the pattern that keeps repeating.
Buy on Amazon →
Market Mayhem
400 years of bubbles, crashes, and the pattern that keeps repeating.
Buy on Amazon →
 Greatest Companies
How the world's greatest companies were built — and what traders learn from them.
View on Amazon →
Greatest Companies
How the world's greatest companies were built — and what traders learn from them.
View on Amazon →
 Greatest Traders
Eighty-six lives that explain the markets — Livermore to Madoff, told with the losses left in.
View on Amazon →
Greatest Traders
Eighty-six lives that explain the markets — Livermore to Madoff, told with the losses left in.
View on Amazon →