Stop-hunts are not random. They are engineered liquidity events where smart money sweeps retail stop losses to fill institutional orders at better prices.
You have been there. You identify a clean setup. You place your stop loss at a logical level, just below the recent swing low. Price moves in your direction, then suddenly spikes through your stop, takes you out, and immediately reverses in the direction you originally anticipated. The trade was right. The stop was wrong. Or more accurately, the stop was exactly where the market needed it to be.
| Stop Hunt Signal | What You See | What It Means | How to Trade It |
|---|---|---|---|
| Wick beyond swing high/low | Long wick through the level, body closes back inside | Stops were triggered, but no genuine follow-through | Enter on reversal candle with stop beyond the wick |
| Equal highs/lows taken | Price pushes through a double top/bottom and immediately reverses | Concentrated liquidity was harvested by institutions | Wait for ChoCH on LTF, enter in reversal direction |
| Previous day high/low swept | Price breaks PDH/PDL during Kill Zone then reverses | Session liquidity target reached. Real move beginning. | Classic ICT Kill Zone entry after sweep confirmation |
| Asian range sweep | London or NY takes out Asian high or low, then reverses | AMD cycle manipulation phase complete | Enter the distribution phase after manipulation reversal |
This is a stop-hunt, and it is not random. It is one of the most consistent patterns in price action because it serves a critical function in market mechanics. Large institutional orders need liquidity to fill. Stop losses are liquidity. Every stop loss below a swing low is a sell order waiting to be triggered. When a bank needs to fill a large buy order, sweeping those stops provides the necessary supply.
Why Stop-Hunts Happen: The Liquidity Problem
Retail traders think of their stop loss as a personal risk management tool. Institutions see a cluster of stop losses as a pool of available orders. A bank that needs to buy 10,000 contracts cannot simply hit the ask — the slippage would be enormous. Instead, they engineer price into zones where stop losses are concentrated, triggering a cascade of sell orders that provides the liquidity needed to fill their buy.
This is why price so frequently sweeps below obvious support levels, triggers a wall of stops, and then reverses violently. The sweep was not an accident. It was the mechanism by which the institutional order was filled.
The Anatomy of a Stop-Hunt
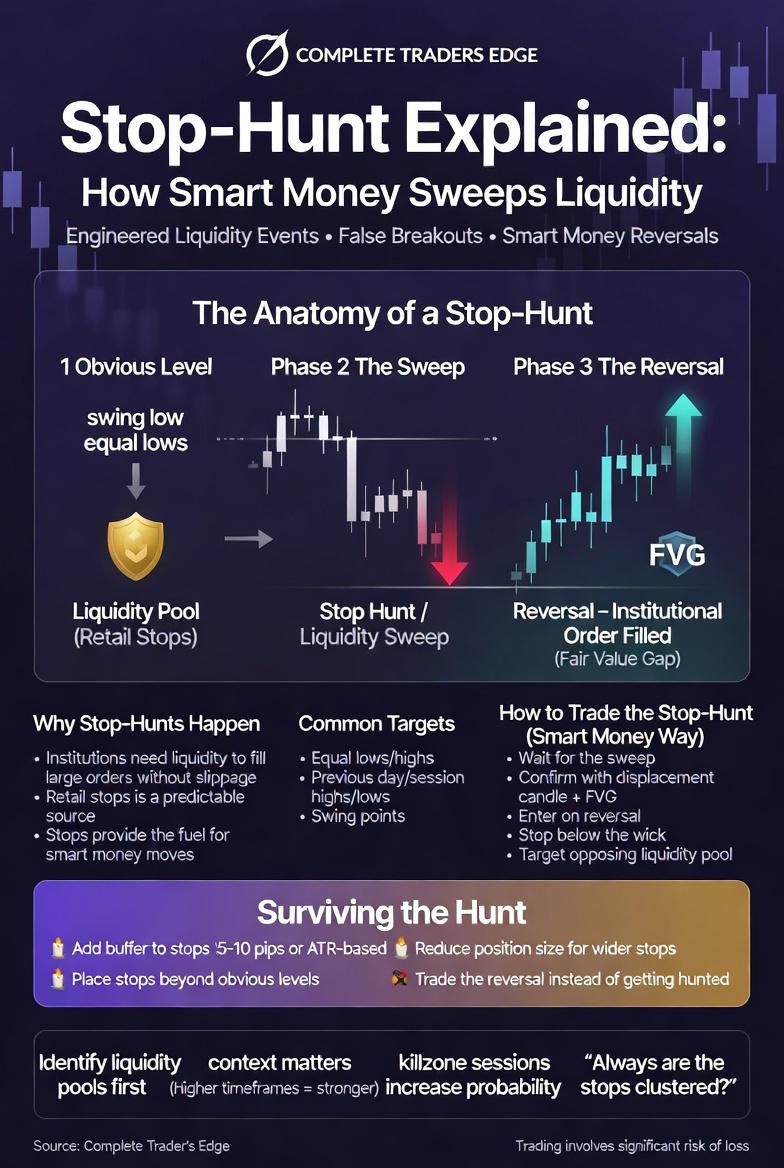
Phase 1: The Obvious Level Forms
Price creates a clear swing low or swing high that every retail trader can see. The more times price touches this level without breaking it, the more stops accumulate just beyond it. Equal lows are the most dangerous formation for long traders because the liquidity pool is perfectly visible.
Phase 2: The Sweep
Price breaks through the obvious level, triggering the clustered stop losses. This creates a spike of volume as the stops execute. On a candle chart, this typically appears as a long wick through the level. On order flow, you see a burst of aggressive selling at the bid as stops are triggered, immediately followed by aggressive buying as the institutional order fills.
Phase 3: The Reversal
Once the institutional order is filled, price has no reason to continue lower. The stops have been taken, the liquidity has been consumed, and the large order is now positioned. Price reverses, often aggressively, and moves in the original direction. Traders who were stopped out watch the market do exactly what they expected, without them.
How to Identify Stop-Hunt Setups Before They Happen
The key is learning to see the world from the perspective of the liquidity provider, not the retail participant. Ask yourself where the stops are. If you were a bank that needed to buy, where would you find the largest pool of sell orders? That is where price is going before it goes where you think it is going.
Equal lows are the clearest signal. When price creates two or more lows at approximately the same level, every retail trader sees support. Every institution sees a liquidity pool. The more equal the lows, the more concentrated the stops, and the more likely a sweep becomes.
Previous day’s low and high are obvious stop-hunt targets because they represent levels where a large number of traders have placed their stops. Session lows and highs serve the same function during intraday trading.
Trading the Stop-Hunt: The Smart Money Entry
Instead of placing your stop at the obvious level and getting swept, use the stop-hunt as your entry signal. Wait for the sweep to happen, then enter after confirmation that the reversal is underway.
The confirmation you need is a displacement candle, a strong impulsive candle moving away from the sweep level that creates a fair value gap. When price sweeps liquidity below a swing low and then produces a bullish displacement candle with a visible FVG, you have your entry. Your stop goes below the wick of the sweep candle, and your target is the opposing liquidity above the range.
Where to Place Stops That Survive
Professional stop placement accounts for the stop-hunt. Instead of placing stops just below a swing low, place them below the zone where a sweep would logically end. This means giving your stop extra room, which requires smaller position sizes for the same dollar risk, but it dramatically increases the probability of your stop surviving the sweep.
Using ATR-based stops that account for current volatility, placing stops beyond institutional levels rather than retail levels, and sizing positions to accommodate wider stops are the three practical adjustments that make the biggest difference.
📚 Related Articles:
Stop clustering is documented in market microstructure research. The claim that an algorithm deliberately engineers the sweep is a separate and much larger one. We keep the two apart in the full story of the Inner Circle Trader.
This article is adapted from The Complete Trader’s Edge
70 chapters covering Mind · Method · Money — the most comprehensive trading education framework available.
Frequently Asked Questions
What is a stop hunt in trading?
A stop hunt (or liquidity sweep) occurs when price briefly pushes beyond an obvious level where retail traders have placed their stop losses, triggering those stops to provide liquidity for institutional orders. Price then reverses sharply in the opposite direction. The false breakout above a swing high or below a swing low followed by an immediate reversal is the classic stop hunt signature.
How do I avoid being stopped out by stop hunts?
Two approaches: (1) Place your stop loss beyond the obvious level where stops cluster, adding 5-10 pips of buffer. If everyone’s stop is at $2,340, place yours at $2,335. (2) Wait for the stop hunt to happen before entering. Instead of buying at support and hoping it holds, let the sweep occur and enter on the reversal confirmation. This way, the hunt works for you.
Do stop hunts happen on all timeframes?
Yes, but higher timeframe stop hunts are more significant. A daily swing low sweep represents institutional operations at a much larger scale than a 5-minute sweep. Focus on identifying and trading stop hunts at levels visible on the 4-hour and daily charts for the highest probability setups.
How do I trade a stop hunt reversal?
The sequence: (1) Identify the obvious liquidity level (equal highs, equal lows, previous session high/low). (2) Wait for price to sweep beyond it. (3) Look for a Change of Character or reversal candle on the 15-minute or 1-hour chart. (4) Enter in the reversal direction with stop beyond the sweep wick. (5) Target the opposite liquidity pool.
Are all false breakouts stop hunts?
Not all, but many are. A false breakout that occurs during a Kill Zone at an obvious liquidity level with a sharp reversal is very likely a stop hunt. A false breakout during low-volume hours that drifts slowly back may simply be indecisive price action. Context matters: the combination of timing, level, and reversal speed distinguishes institutional stop hunts from random noise.
From The Book
This article covers concepts from Chapter 32 of The Complete Trader’s Edge.
 The Complete Trader's Edge
The full Mind · Method · Money framework. 70 chapters.
View on Amazon →
The Complete Trader's Edge
The full Mind · Method · Money framework. 70 chapters.
View on Amazon →
 Market Mayhem
400 years of bubbles, crashes, and the pattern that keeps repeating.
Buy on Amazon →
Market Mayhem
400 years of bubbles, crashes, and the pattern that keeps repeating.
Buy on Amazon →
 Greatest Companies
How the world's greatest companies were built — and what traders learn from them.
View on Amazon →
Greatest Companies
How the world's greatest companies were built — and what traders learn from them.
View on Amazon →