Gold is the most technically clean instrument on the planet. It respects order blocks, fills fair value gaps with precision, trends for weeks at a time, and produces some of the highest R:R setups available in any market. It is also the instrument that destroys more retail accounts than almost any other, because the same qualities that make it technically beautiful make it brutally unforgiving when your risk management slips.
XAU/USD moves 200 to 400 pips on a normal day. On high-impact news days, 600 to 1,000 pips is common. If you are trading gold with the same position sizing and stop placement you use on EUR/USD, you are already in trouble. This guide covers everything you need to trade gold professionally: what drives it, when to trade it, how to apply ICT and Smart Money Concepts to it, and the specific risk management adjustments that separate gold traders who survive from those who do not.
What Makes Gold Different from Forex and Indices
Gold trades as XAU/USD on most retail platforms, priced in US dollars per troy ounce. At the time of writing, gold sits above $3,000 per ounce, which means a single pip (0.01 move) is worth approximately $0.01 per 0.01 lot, $0.10 per 0.10 lot, and $1.00 per 1.0 standard lot. This is where most beginners miscalculate their risk. A 300-pip stop loss on gold with a standard lot is $300. On EUR/USD, a 30-pip stop with the same lot size is also $300. The numbers are similar, but the volatility profile is completely different.
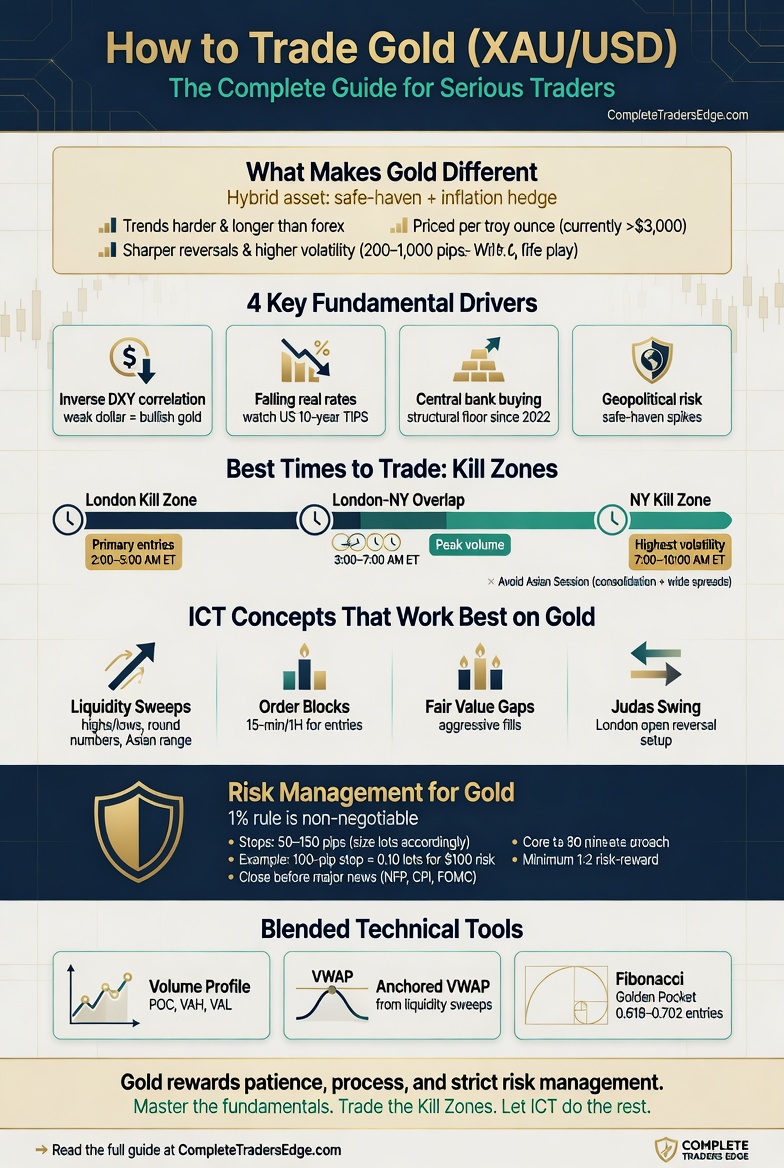
Gold behaves as a hybrid asset. It is simultaneously a commodity, a currency, a safe-haven asset, and an inflation hedge. This means it responds to a wider range of fundamental drivers than a pure forex pair. The US dollar, real interest rates, central bank policy, geopolitical risk, inflation expectations, and physical demand from central banks and jewellery markets all influence its price. For technical traders, the practical implication is that gold trends harder and longer than most forex pairs, but it also produces sharper and more violent reversals when the fundamental narrative shifts.
Gold also has a unique relationship with liquidity. The London Bullion Market Association (LBMA) gold fix occurs twice daily at 10:30 AM and 3:00 PM London time. These fixes create institutional order flow events that frequently correspond with intraday turning points. The CME COMEX gold futures contract (GC) is the primary exchange-traded instrument, and open interest and volume data from the CME can provide valuable context for spot XAU/USD traders.
What Drives Gold Prices: The Fundamental Framework
You do not need to be a fundamental analyst to trade gold successfully. But you do need to understand the forces that create the trends and volatility you are trading. The four primary drivers are interconnected, and understanding how they interact gives you a directional bias that filters out low-probability setups.
The US Dollar (DXY)
Gold and the US dollar have a well-documented inverse correlation. When the dollar strengthens, gold tends to fall. When the dollar weakens, gold tends to rise. This correlation is not perfect and it breaks down during periods of extreme market stress, but as a directional filter it is one of the most reliable in all of intermarket analysis. Before taking any gold trade, check the DXY chart. If you are looking to go long gold but the dollar index is breaking out to new highs, you are fighting the macro current.
Real Interest Rates
Gold pays no yield. It does not generate dividends or interest. This means gold competes directly with yield-bearing assets, and the relevant comparison is not nominal interest rates but real interest rates: the nominal rate minus inflation. When real rates are falling or negative, the opportunity cost of holding gold decreases and capital flows into it. When real rates are rising, gold faces headwinds. The US 10-year Treasury Inflation-Protected Securities (TIPS) yield is the most commonly watched proxy for real rates. A falling TIPS yield is bullish for gold. A rising TIPS yield is bearish.
Central Bank Buying
Central banks have been net buyers of gold for over a decade, with purchases accelerating significantly since 2022. China, Poland, India, Turkey, and several other nations have been adding gold reserves at a pace not seen in decades. This structural demand provides a floor under gold prices that did not exist in previous decades. It does not tell you where to enter a trade, but it shapes the macro bias: the demand side of the gold market has a large, persistent, and price-insensitive buyer that is unlikely to stop any time soon.
Geopolitical Risk and Safe-Haven Flows
Gold is the original safe-haven asset. When geopolitical tensions escalate, when banking systems come under stress, or when equity markets sell off sharply, capital tends to flow into gold. These moves can be explosive but are often temporary. The practical rule for traders: geopolitical spikes in gold are difficult to trade profitably because they reverse quickly once the immediate fear subsides. The safer approach is to trade the established trend that emerges after the initial spike, not the spike itself.
When to Trade Gold: Session Timing and Kill Zones
Gold is a 23-hour market (CME futures trade Sunday 6:00 PM to Friday 5:00 PM Eastern, with a daily maintenance break from 5:00 PM to 6:00 PM ET). But like every other instrument, gold does not move uniformly throughout the day. Understanding which sessions produce the highest-probability setups is critical for gold traders.
Asian Session (7:00 PM to 2:00 AM ET)
The Asian session for gold is typically a consolidation phase. Price builds a range, establishing the Asian high and the Asian low. These levels become the liquidity pools that the London session targets. In ICT terms, the Asian range is where liquidity accumulates on both sides. Do not trade gold during the Asian session unless you have a very specific strategy designed for range-bound conditions. The volatility is lower, the spreads are wider, and the moves are less decisive.
London Kill Zone (2:00 AM to 5:00 AM ET)
This is where gold comes alive. The London session opens with European banks and institutional desks beginning their day, and the first significant directional move in gold almost always originates here. The classic ICT pattern applies: the London open sweeps one side of the Asian range (the Judas Swing), collects the liquidity sitting above the Asian high or below the Asian low, and then reverses into the true daily direction.
For gold traders, the London Kill Zone between 2:00 AM and 5:00 AM Eastern is the primary entry window. If you can only trade one session on gold, trade London. The moves are cleaner, the institutional participation is highest, and the Judas Swing setup appears with remarkable consistency.
New York Kill Zone (7:00 AM to 10:00 AM ET)
The New York session adds the second layer of institutional order flow. US economic data releases (NFP, CPI, FOMC decisions) land during this window and create the highest-volatility events in the gold market. The New York Kill Zone often continues the directional move established during London, or it reverses it entirely. Both outcomes are tradeable, but you need to be prepared for both.
The London-New York overlap (8:00 AM to 12:00 PM GMT, or roughly 3:00 AM to 7:00 AM ET during US Eastern summer time) is the highest-volume period for gold. The widest ranges, the cleanest breaks of structure, and the most decisive order flow all occur during this window.
London Close (10:00 AM to 12:00 PM ET)
The London Close is where European institutions square their books. For gold traders carrying intraday positions from the London or New York Kill Zones, this is the natural profit-taking window. Holding gold positions through the London Close and into the US afternoon is a lower-probability proposition because the institutional participation that was driving the move is withdrawing.
How to Apply ICT Concepts to Gold
The ICT framework applies to gold exceptionally well. In fact, many ICT practitioners consider gold to be the best instrument for the methodology because it trends clearly, respects institutional levels with precision, and produces textbook liquidity sweeps and fair value gap fills.
Liquidity Sweeps on Gold
Gold builds liquidity at obvious levels: equal highs, equal lows, previous session highs and lows, round numbers ($3,000, $3,050, $3,100), and the Asian session range boundaries. The London open Judas Swing is the most reliable liquidity sweep pattern on gold. Price sweeps the Asian high or low, collects the stop losses clustered at that level, and reverses. This is not a theory. It is an observable, repeatable pattern that occurs multiple times per week.
The key is patience. Wait for the sweep to occur. Wait for price to show displacement (a strong, impulsive candle moving away from the swept level). Then look for your entry on the pullback into the fair value gap or order block left behind by that displacement.
Order Blocks on Gold
Gold respects order blocks cleanly, but the key adjustment is timeframe. On gold, the 15-minute and 1-hour order blocks are the most reliable for intraday entries. The 5-minute chart produces too many false order blocks because of gold’s volatility, and the 4-hour order blocks are better suited for swing trade entries.
The ideal gold order block entry combines three elements: a higher-timeframe directional bias (daily or 4H structure is bullish or bearish), a liquidity sweep that has already occurred (the stop hunt has happened), and a pullback into a 15-minute order block that sits inside a fair value gap on the 1-hour chart. When all three align, the setup has the highest probability and the tightest stop placement.
Fair Value Gaps on Gold
Gold fills fair value gaps aggressively. This is one of its most tradeable characteristics. When gold displaces from a level and leaves an FVG, the probability of price returning to fill at least 50% of that gap before continuing is very high. Use FVGs on the 15-minute and 1-hour charts as your primary entry zones for intraday trades. On the 4-hour and daily charts, FVGs serve as swing trade entry zones and profit targets.
One important gold-specific nuance: during strong trending days (especially during NFP or FOMC), gold can leave multiple FVGs stacked on top of each other. Not all of them will fill immediately. In strong trends, price tends to fill the most recent FVG and then continue, leaving the earlier gaps to fill on a deeper pullback days or weeks later. Do not assume every FVG will fill during the current session.
The Judas Swing on Gold
The Judas Swing is arguably the single most profitable pattern on gold. It works as follows: during the London open (typically between 2:00 AM and 3:00 AM ET), price makes an initial move that sweeps one side of the Asian range. This move traps retail traders who entered in the direction of the sweep. Then price reverses sharply and moves in the true daily direction.
To trade the Judas Swing on gold, mark the Asian session high and low before the London open. Identify which side has more liquidity (equal highs or equal lows, previous day’s high or low nearby). Wait for price to sweep that level during the first 30 to 60 minutes of London. Look for a displacement candle in the opposite direction. Enter on the pullback into the FVG or OB left by the displacement. Place your stop beyond the liquidity sweep. Target the opposite side of the Asian range as your first take-profit, and the previous day’s high or low as your extended target.
Risk Management for Gold: The Non-Negotiable Adjustments
Gold’s volatility demands specific risk management adjustments. Using the same stop distances and position sizes you apply to EUR/USD will produce outsized losses on gold. Here are the rules.
Stop Loss Sizing
A typical intraday stop loss on gold ranges from 50 to 150 pips (measured as the price move from entry to stop, where 1 pip = $0.01 move in XAU/USD). On EUR/USD, a typical stop is 10 to 30 pips. The absolute dollar risk should be the same (1% of your account), which means your position size on gold must be proportionally smaller.
The formula is simple: if your 1% risk is $100 and your stop loss is 100 pips on gold, your maximum position size is 0.10 lots (because 100 pips × $0.10 per pip per 0.01 lot × 10 = $100). Never reverse-engineer your position size to fit a target lot size. Always start with the stop distance, calculate the correct lot size, and accept whatever position that calculation produces.
The 1% Rule Still Applies
Some gold traders feel that because gold moves so much, they should risk more per trade to “make the most of it.” This logic destroys accounts. Gold’s large moves work in both directions. A 300-pip move in your favour can become a 300-pip move against you on the next session. The 1% rule per trade is not optional. On gold, it is even more important than on calmer instruments because the speed and magnitude of adverse moves can turn a 2% risk into a 4% loss before you can react if you are not using proper stops.
News Events: The Red Folder Protocol
Gold is among the most news-sensitive instruments. NFP (Non-Farm Payrolls), CPI (Consumer Price Index), FOMC rate decisions, and PPI (Producer Price Index) can move gold 300 to 500 pips within minutes. The protocol is clear: do not hold unprotected gold positions through red folder news events. Either close before the release, reduce your position size to half, or ensure your stop is wide enough to survive the initial spike without being hit by the noise before the real move develops.
The safest approach is to wait. Let the initial reaction play out (usually 15 to 30 minutes), wait for the first FVG or displacement to form, and then enter in the direction of the post-news momentum. Trading the initial spike is a coin flip. Trading the continuation after the dust settles is a much higher-probability approach.
Spread Awareness
Gold spreads vary significantly by broker and by session. During the Asian session, spreads on XAU/USD can widen to 30 to 50 pips on some retail brokers. During peak London and New York hours, spreads typically tighten to 10 to 20 pips. On ECN accounts, spreads can be as low as 5 to 10 pips plus commission. Factor the spread into every trade. A 50-pip stop loss with a 30-pip spread means your effective stop is only 20 pips of actual price movement, which is far too tight for gold. Use brokers with competitive gold spreads, and avoid trading gold during off-peak hours when spreads are widest.
Gold and the Blended Approach: Volume Profile, AVWAP, and Fibonacci
The ICT framework provides the structural logic for gold trades. But the blended approach adds layers of confluence that significantly improve your accuracy. Here is how each tool applies specifically to gold.
Volume Profile on Gold
The Volume Profile on gold’s daily and weekly charts reveals where institutional volume has concentrated. The Point of Control (POC) acts as a magnet for price during consolidation phases. The Value Area High (VAH) and Value Area Low (VAL) serve as institutional support and resistance levels that gold respects with unusual precision.
When gold is trading above the previous day’s POC, the intraday bias leans bullish. When it is trading below, it leans bearish. Combine this with the ICT directional bias from the daily chart, and you have a double-confirmed directional filter before you even look for a setup.
Anchored VWAP on Gold
Anchor your VWAP from the most recent significant liquidity sweep on gold. When gold sweeps a major swing high or swing low, that is where institutional orders were filled in size. The AVWAP drawn from that point acts as dynamic support or resistance that price gravitates toward during pullbacks. On gold, the AVWAP from a weekly swing high or low is particularly powerful because the institutional orders at those levels are the largest.
Fibonacci on Gold
The Golden Pocket (0.618 to 0.702 Fibonacci retracement) works exceptionally well on gold. When gold makes an impulsive move and pulls back, the Golden Pocket is consistently where institutional re-entry occurs. Combine the Golden Pocket with an order block and an FVG that overlaps the same zone, and you have a triple-confluence entry that is among the highest-probability setups available on any instrument.
For targets, the 1.272 and 1.618 Fibonacci extensions from the most recent swing give you objective profit levels. Gold’s tendency to trend means that 1.618 extensions are reached more frequently than on range-bound forex pairs.
CME Gaps on Gold
Gold futures on the CME close every day from 5:00 PM to 6:00 PM Eastern and over the weekend from Friday 5:00 PM to Sunday 6:00 PM Eastern. Gaps that form during these closures have a historically high fill rate. Weekend gaps on gold fill within the same week more than 70% of the time.
Check for open CME gaps on gold every Monday morning and every day after the 5:00 PM close. An unfilled gap above the current price is a potential upside target. An unfilled gap below is a potential downside target. These are not entry signals on their own, but they are powerful target confirmations when your ICT setup points in the same direction as the gap fill.
Gold Trading Mistakes That Destroy Accounts
Gold is not more dangerous than other instruments. It is more punishing of specific mistakes. Here are the ones that account for the majority of gold trading losses.
Overleveraging. The single biggest killer. Gold’s wide ranges tempt traders into using the same lot sizes they use on forex. A 1.0 lot position on gold with a 200-pip adverse move is a $2,000 loss. On a $10,000 account, that is 20% gone in one trade. Size your positions based on the stop distance, not on how much you want to make.
Trading the Asian session. Gold during Asian hours is a different instrument. It ranges, it chops, it produces false signals that look convincing on the 5-minute chart but go nowhere. Save your capital and your psychology for the London and New York Kill Zones.
Ignoring the DXY. Trading gold without checking the dollar index is like driving without mirrors. If DXY is breaking out to the upside, your long gold setup has a fundamental headwind regardless of how clean it looks technically. Always check intermarket context before executing.
Holding through news without a plan. Gold can move 300 pips in five minutes during NFP or FOMC. If you are holding a position with a 100-pip stop, it will be hit before you can react. Have a news protocol. Know when every red folder event is scheduled. Either be flat, hedged, or sized down.
Chasing extended moves. Gold trends hard, and when you miss the London open entry, it is tempting to chase at extended prices. Do not do this. Wait for the pullback into the FVG. It almost always comes. And if it does not, there will be another setup tomorrow. Discipline beats desperation every time.
A Complete Gold Trading Checklist
Before every gold trade, run through these checks:
| Check | Question | Action |
|---|---|---|
| Session | Am I in a Kill Zone? | If no, do not trade. |
| DXY | What is the dollar doing? | DXY weak = gold bullish lean. DXY strong = gold bearish lean. |
| HTF Bias | What is the daily/4H structure? | Trade with the higher timeframe, not against it. |
| Liquidity | Has a sweep occurred? | If no sweep, wait. The setup is not ready. |
| Entry | Is there an OB/FVG at my level? | If no confluent entry zone, skip the trade. |
| Risk | Is my position sized to 1% risk? | Calculate from stop distance. Never estimate. |
| News | Any red folder events within 1 hour? | If yes, wait until after the release settles. |
| R:R | Is the setup offering minimum 1:2? | If not, the trade does not qualify. |
Recommended Brokers and Platforms for Gold Trading
Not all brokers offer competitive gold trading conditions. The key factors to compare are spreads (look for under 20 pips during London/NY), swap rates (gold carries a daily interest charge that varies by broker), execution speed, and whether the broker offers the gold contract you want (XAU/USD spot or gold futures).
For a detailed comparison of the brokers we have tested and recommend, visit our Trading Tools page. If you trade gold on a prop firm account, check the firm’s specific rules around gold, as many prop firms have different leverage and position limits for XAU/USD compared to forex pairs.
Gold and Prop Firm Trading
Gold is one of the most popular instruments among prop firm traders because its volatility allows you to hit profit targets quickly. But that same volatility makes drawdown management critical. Most prop firms set daily loss limits at 4 to 5% and maximum drawdown at 8 to 10%. A single overleveraged gold trade can breach the daily limit in minutes.
The prop firm approach to gold should emphasise smaller position sizes and higher R:R targets. Instead of risking 1% to make 2%, consider risking 0.5% to make 1.5% or 2%. The reduced risk per trade gives you more room to absorb gold’s intraday volatility without breaching drawdown limits. The R:R compensates for the smaller risk by producing proportionally larger winners relative to your maximum allowed loss.
5 Frequently Asked Questions About Trading Gold
What is the best timeframe for trading gold?
For intraday traders, the 15-minute chart for entries and the 1-hour chart for structure and bias works best. The 5-minute chart is useful for precision entries but produces more noise on gold than on forex pairs. For swing traders, the 4-hour and daily charts provide the clearest setups with the highest R:R potential.
How much capital do I need to trade gold?
With a micro lot (0.01) position, gold requires relatively little capital. A typical intraday stop of 100 pips on 0.01 lots risks $1.00. To trade gold responsibly with 1% risk per trade, you need an account where $1.00 represents 1% of your balance, meaning at least $100. Realistically, a $500 to $1,000 account allows for proper gold trading at micro lot sizes. For standard lots, $10,000 or more is appropriate.
Is gold harder to trade than forex?
Gold is not harder; it is less forgiving. The same ICT concepts, risk management principles, and price action logic apply. The difference is volatility. Mistakes that cost you 10 pips on EUR/USD cost you 100 pips on gold. If your process is solid and your position sizing is correct, gold is one of the best instruments available. If either of those is missing, gold will expose the gap quickly.
Should I trade gold spot (XAU/USD) or gold futures (GC)?
For most retail traders, XAU/USD spot through a forex broker is simpler and more accessible. Gold futures (GC) require a futures account, have specific margin requirements, and trade in contract sizes that may be too large for smaller accounts. The micro gold futures contract (MGC) at 10 troy ounces per contract is a good middle ground for traders who want exchange-traded execution with smaller position sizing.
What is the best time to trade gold?
The London Kill Zone (2:00 AM to 5:00 AM ET) and the New York Kill Zone (7:00 AM to 10:00 AM ET) are the highest-probability windows. The London-New York overlap is the single best period for gold trading. Avoid the Asian session and the US afternoon unless you have a specific strategy designed for those lower-volatility conditions.
▶ Continue Reading
▸ Intermarket Analysis: How DXY, Bonds, and Correlations Give You an Institutional Edge
▸ Trading Sessions Explained: London, New York, and Asian Session Breakdown
▸ CME Gaps Explained: How Weekend and Session Gaps Create High-Probability Setups
▸ Fair Value Gaps (FVG): The Complete ICT Guide to Trading Imbalances
The Complete Trader’s Edge
This article is adapted from The Complete Trader’s Edge by Louw van Riet. The book covers gold trading strategy, ICT concepts, risk management, and the complete Mind · Method · Money framework across 70 chapters.
 The Complete Trader's Edge
The full Mind · Method · Money framework. 70 chapters.
View on Amazon →
The Complete Trader's Edge
The full Mind · Method · Money framework. 70 chapters.
View on Amazon →
 Market Mayhem
400 years of bubbles, crashes, and the pattern that keeps repeating.
Buy on Amazon →
Market Mayhem
400 years of bubbles, crashes, and the pattern that keeps repeating.
Buy on Amazon →
 Greatest Companies
How the world's greatest companies were built — and what traders learn from them.
View on Amazon →
Greatest Companies
How the world's greatest companies were built — and what traders learn from them.
View on Amazon →