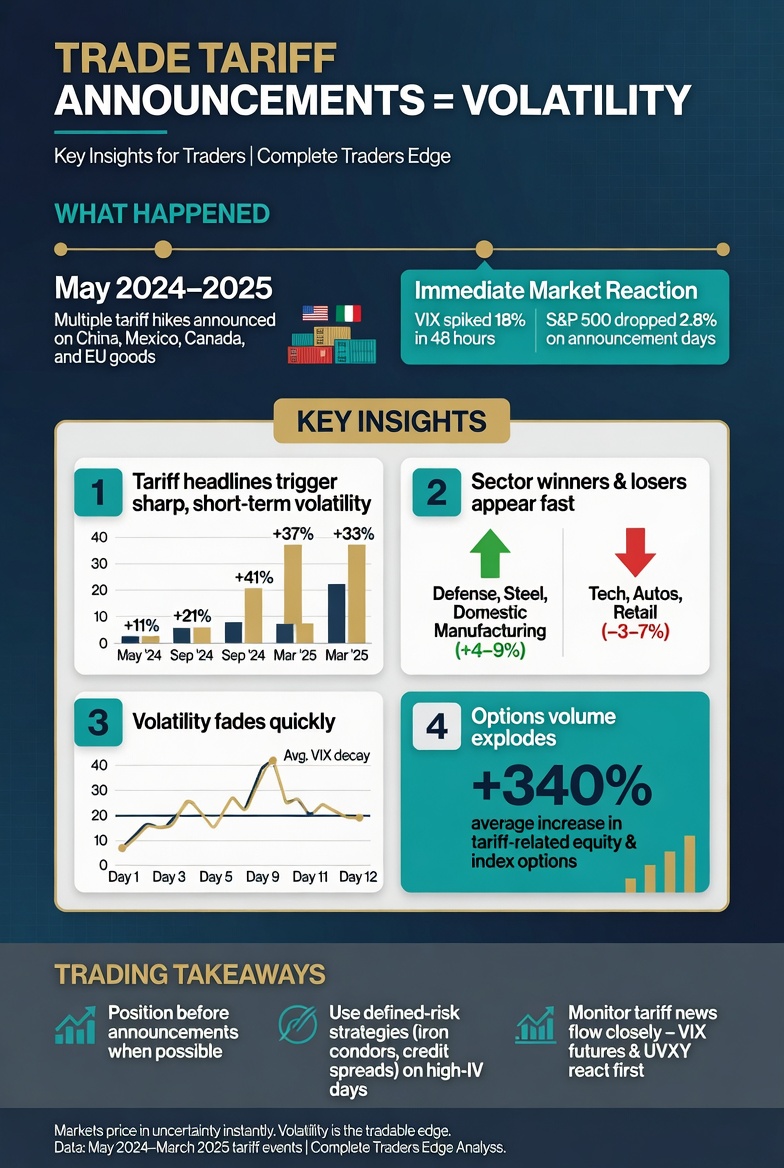
Tariff announcements have become one of the most frequent and violent catalysts in global markets. A single headline about new tariffs on Chinese goods, European cars, or Canadian lumber can move the S&P 500 by 2-3% in minutes, send gold up 300 pips, and crash the currencies of affected nations, all before most retail traders have opened their platforms. Then, 48 hours later, a “tariff pause” headline reverses half the move. Welcome to trading in an era of trade war volatility.
This guide is not about predicting trade policy. It is about having a system for trading the volatility that trade policy announcements create, protecting your open positions when headlines land without warning, and identifying the high-probability setups that emerge in the aftermath of tariff shocks.
How Tariff Announcements Move Markets
Tariffs are taxes on imported goods. When Country A imposes a 25% tariff on goods from Country B, the cost of those goods rises for businesses and consumers in Country A. The market implications cascade through multiple asset classes simultaneously.
| Asset Class | Typical Reaction to New Tariffs | Why |
|---|---|---|
| Equities (ES, NQ) | Sell off sharply | Higher costs squeeze corporate margins; uncertainty kills investment |
| Gold (XAU/USD) | Rallies as safe-haven demand rises | Capital flows to safety; inflation expectations rise |
| US Dollar (DXY) | Mixed; initially rises on safe-haven, then weakens on growth fears | Competing forces: safety demand vs economic slowdown |
| Affected country’s currency | Weakens (CNY, MXN, CAD, EUR) | Export revenue expectations fall; capital outflows |
| Bonds (Treasuries) | Rally (yields fall) | Risk-off flow; rate cut expectations increase |
| Crypto (BTC) | Sells off initially; may rally later | Correlates with risk-on equities initially; narrative-dependent later |
The key insight is that tariff headlines create correlated moves across markets. When you see equities dropping and gold rising simultaneously, that is the trade war playbook in action. Understanding these correlations allows you to position in the highest-probability instrument rather than guessing which headline comes next.
The Anatomy of a Tariff-Driven Trading Day
Tariff announcements tend to follow a predictable emotional arc, even though the timing of the headline itself is unpredictable.
| Phase | Duration | What Happens | Your Strategy |
|---|---|---|---|
| 1. Shock | 0-15 minutes | Algos react instantly. Spreads widen. Violent move in one direction. | Do NOT enter. Protect existing positions. Widen stops or flatten. |
| 2. Overreaction | 15-60 minutes | Market overshoots as retail piles in. Liquidity is swept. | Watch for displacement and FVG formation. Prepare for entry. |
| 3. Reassessment | 1-4 hours | Institutional traders digest the actual impact. FVGs begin to fill. | Enter on FVG pullbacks in the direction of the institutional move. |
| 4. Continuation or Reversal | 4-24 hours | Either the move continues as the market prices in the full impact, or a counter-headline reverses it. | Trail stops. Take partials at key levels. Be ready for reversal headlines. |
The most profitable approach is to trade Phase 3, the reassessment period. By then, spreads have normalised, the initial spike has created clear FVGs and OBs on the chart, and you can calculate your risk properly. Phase 1 is a coin flip with wide spreads. Phase 2 traps retail traders who chased. Phase 3 is where the clean setups form.
Protecting Open Positions During Trade War Headlines
Tariff headlines arrive without warning. A tweet, a press conference, a leaked document. If you have open positions, you need a pre-defined protocol.
Rule 1: Never hold unprotected positions overnight during active trade war periods. If tariff negotiations are ongoing and headlines could land at any time, either close intraday positions before the session ends, or ensure your stop loss is wide enough to survive a 1-2% overnight gap.
Rule 2: Reduce position size during elevated headline risk. If trade talks are dominating the news cycle, drop your risk from 1% to 0.5% per trade. The reduced size gives you the same structural exposure but halves the dollar impact of an adverse gap.
Rule 3: Diversify your directional exposure. If you are long equities and a tariff headline hits, equities drop and gold rallies. A portfolio with a long gold position alongside equity longs has natural hedging. You do not need to perfectly hedge, but awareness of correlated exposure prevents catastrophic single-direction losses.
Rule 4: Keep a “headline response” template. Before the trading day, write down: “If a tariff headline lands while I am in a trade, I will [close immediately / widen my stop to X / do nothing because my stop is already wide enough].” The decision made in advance, during calm conditions, is always better than the decision made in the chaos of a 200-pip spike.
The Best Instruments for Trade War Volatility
| Instrument | Trade War Play | Advantage | Risk |
|---|---|---|---|
| Gold (XAU/USD) | Long on tariff escalation | Clean trending moves; clear ICT setups post-headline | Reversal risk if “deal” headline follows |
| ES / NQ | Short on escalation; long on de-escalation | Largest moves; highest R:R potential | Gaps and overnight exposure |
| USD/CNH | Long USD on China tariffs | Direct expression of China trade tension | Thin liquidity; PBOC intervention risk |
| USD/MXN | Long USD on Mexico tariffs | Direct expression of USMCA tensions | Wider spreads; less technical structure |
| EUR/USD | Short on EU auto tariffs; long on US weakness narrative | Highest liquidity; tightest spreads during chaos | Dual-sided exposure (EU and US both affected) |
Gold is the cleanest trade war instrument for most retail traders because the direction is simpler (tariff escalation = gold up, de-escalation = gold consolidation or pullback) and the technical setups that form post-headline are consistently tradeable using ICT methodology.
Three Tradeable Patterns After Tariff Headlines
1. The Gap Fill Play
When a tariff headline lands overnight or over the weekend, the resulting gap on equity indices (ES, NQ) has a historically high fill probability. Not immediately, but within 1-5 trading days. The strategy is to wait for the initial panic to subside, identify the gap level, and enter a position targeting the gap fill when the market enters Phase 3 (reassessment). Use the FVG created by the gap as your entry zone and the pre-gap level as your target.
2. The Gold Continuation After the Dust Settles
After a tariff escalation headline, gold spikes. Then it pulls back 30-50% of the spike as short-term profit-taking occurs. If the tariff is genuine (not immediately reversed), the pullback to the FVG created by the initial spike is one of the highest-probability re-entries in gold trading. Enter on the FVG fill, stop below the FVG, target the spike high and then beyond.
3. The De-escalation Reversal
When a “tariff pause” or “trade deal progress” headline follows an escalation, the reversal is often equally violent. Equities that sold off 2-3% can rally 3-4% in a single session. The play is to identify the demand zone (OB or FVG) where the initial sell-off stalled, wait for the de-escalation headline to create displacement through that zone, and enter the long position targeting the pre-selloff highs. The R:R on these mean-reversion plays is often 1:3 or better because the fear premium unwinds rapidly.
The Trade War Risk Protocol
During periods of active trade negotiations, add these rules to your standard trading plan:
| Rule | Implementation |
|---|---|
| Reduce risk per trade | 0.5% instead of 1% during active headline risk periods |
| Check news before every session | Scan Reuters/Bloomberg for scheduled trade meetings, deadlines, or pending announcements |
| No new positions 30 min before known trade events | Press conferences, G7/G20 meetings, tariff implementation deadlines |
| Trail stops aggressively on winners | A reversal headline can erase 4 hours of gains in 4 minutes |
| Avoid correlated position stacking | Do not hold long ES + long NQ + long BTC simultaneously; they move together on tariff news |
| Have a hedge instrument identified | If long equities, know your gold long level. If long USD, know your gold short level. |
5 Frequently Asked Questions About Trading Tariff Volatility
Should I trade during tariff headlines?
Not during the initial shock (Phase 1). The spreads widen, liquidity evaporates, and the direction can reverse within minutes. Wait for Phase 3, the reassessment period 1-4 hours after the headline, when spreads normalise and FVGs have formed. This is where the high-probability setups appear.
Do tariff-driven moves reverse or continue?
It depends on whether the tariff is implemented or just threatened. Actual implemented tariffs tend to produce sustained moves (equity sell-offs, gold rallies) that last days to weeks. Threatened tariffs that are later walked back produce sharp spikes followed by full reversals. The market has become increasingly sceptical of tariff threats, which means the initial move on threats is smaller than it was in 2018-2019, but the reversal when threats are confirmed is larger.
Which is safer: trading gold or equities during trade wars?
Gold is generally simpler to trade during trade wars because the direction is more predictable (escalation = gold up). Equities can be whipsawed by alternating escalation and de-escalation headlines within the same week. If you trade equities during trade war periods, reduce your holding period and take profits faster, because the risk of a reversal headline is always present.
How do I know when trade war volatility is elevated?
Watch the VIX (CBOE Volatility Index). During calm periods, VIX trades below 15. During moderate trade tension, VIX rises to 18-25. During acute escalation, VIX spikes above 25-30. When VIX is elevated, adjust your risk accordingly: wider stops, smaller positions, faster profit-taking. VIX above 25 is your signal to activate the trade war risk protocol.
Can I use ICT concepts during tariff volatility?
Absolutely. The ICT framework is designed to read institutional order flow, and tariff-driven moves are institutional events. The FVGs and OBs created by tariff-driven displacement are among the most reliable on the chart because they represent genuine institutional positioning, not thin-market noise. The key is waiting for the displacement to complete (Phase 2) before entering on the pullback (Phase 3). The principles are identical to any other ICT setup; only the catalyst is different.
▶ Continue Reading
▸ Intermarket Analysis: How DXY, Bonds, and Correlations Give You an Institutional Edge
▸ How to Read a Forex Economic Calendar Like a Professional
▸ Risk of Ruin: The Mathematics Every Trader Must Understand
▸ Managing Drawdowns Professionally: The System That Saves Accounts
The Complete Trader’s Edge
This article is adapted from The Complete Trader’s Edge by Louw van Riet. The book covers news trading, risk management, ICT methodology, and the complete Mind · Method · Money framework across 70 chapters.
 The Complete Trader's Edge
The full Mind · Method · Money framework. 70 chapters.
View on Amazon →
The Complete Trader's Edge
The full Mind · Method · Money framework. 70 chapters.
View on Amazon →
 Market Mayhem
400 years of bubbles, crashes, and the pattern that keeps repeating.
Buy on Amazon →
Market Mayhem
400 years of bubbles, crashes, and the pattern that keeps repeating.
Buy on Amazon →
 Greatest Companies
How the world's greatest companies were built — and what traders learn from them.
View on Amazon →
Greatest Companies
How the world's greatest companies were built — and what traders learn from them.
View on Amazon →