

SNAPSHOT · 17 NOVEMBER 2026
Nvidia reported third-quarter fiscal 2027 revenue of $115.8 billion, against its own guidance of $108.0 billion plus or minus 2%. Data Center revenue was $107.6 billion and non-GAAP earnings were $2.68 a share against estimates of $2.47 to $2.48.
Gross margin was 74.9% against a 74.0% guide. Fourth-quarter revenue guidance is $130.0 billion, plus or minus 3%, for a quarter with an extra week. NVDA closed the regular session at $155.46, down 0.44%, and traded about 2% higher in early trading after the release. This was the first report since the board accepted Jensen Huang’s resignation on 11 November.
Nvidia beat its own revenue guidance by 7.2%, its widest margin in the last five reports and above the $113 billion to $114 billion its recent habit pointed to. It guided fourth-quarter revenue to $130 billion against consensus of about $125 billion, although that quarter has an extra week and a lower gross margin. The stock rose about 2% in early after-hours trading.
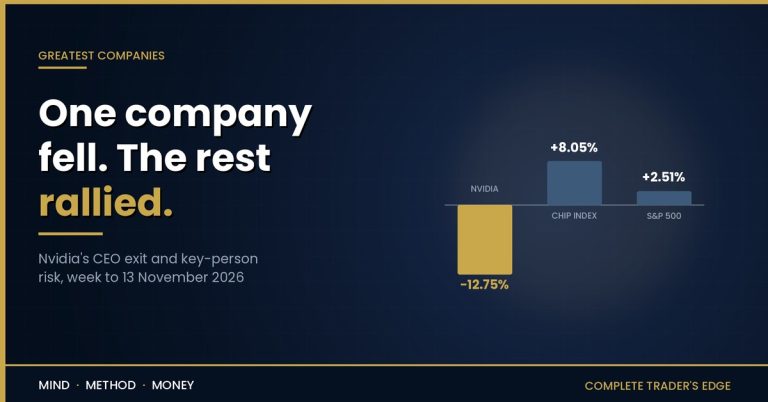
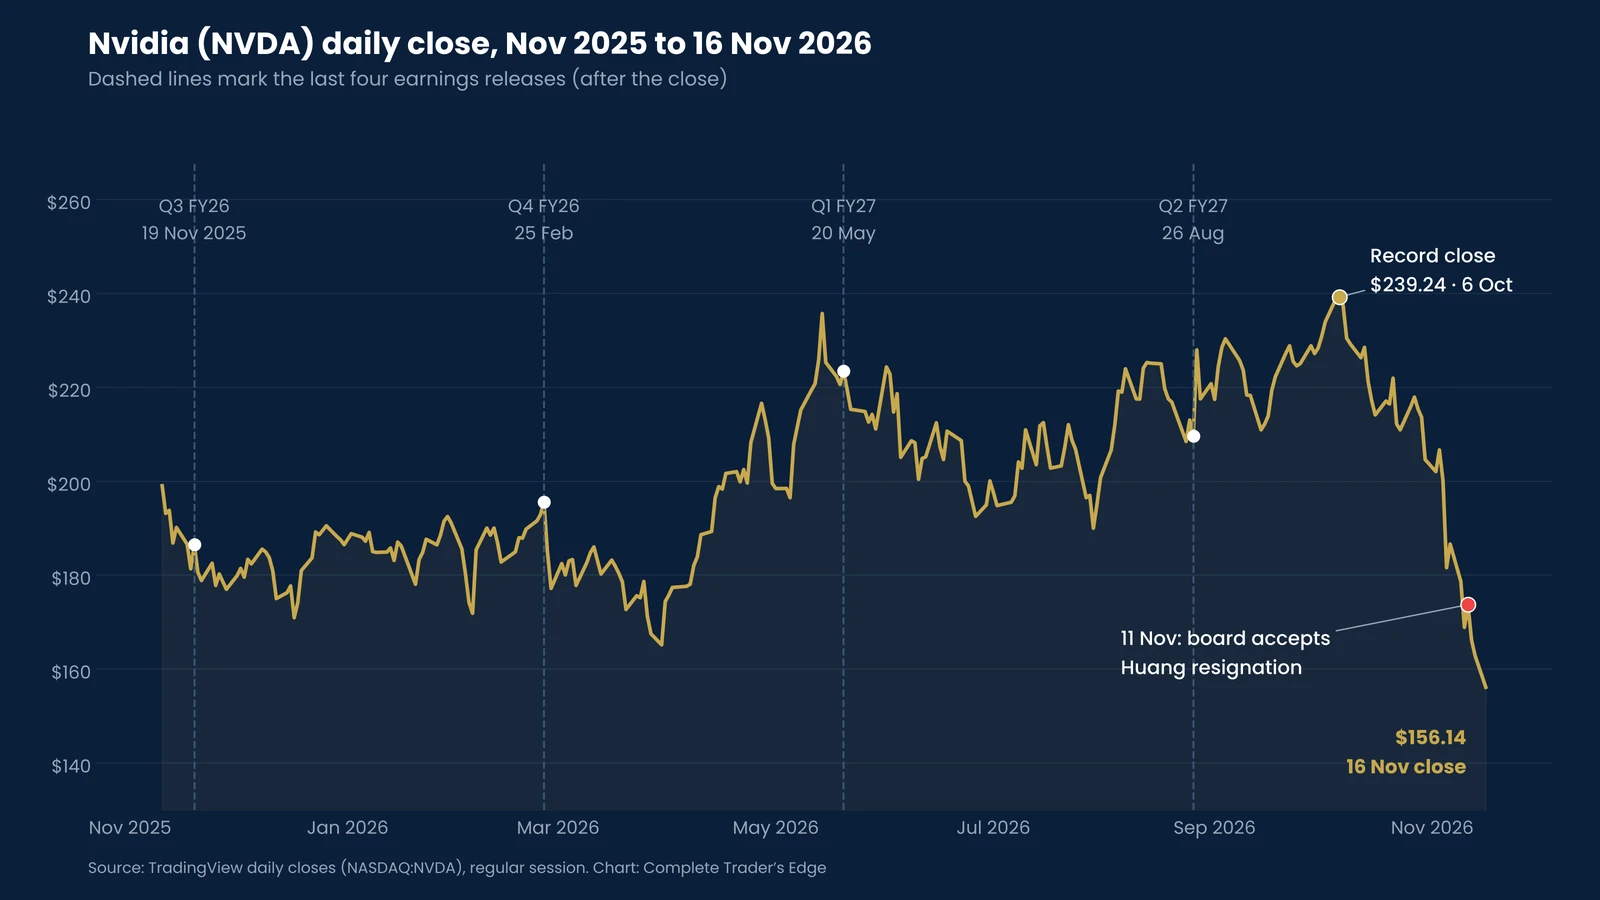
Nvidia came into this report with two separate questions attached. The first is the usual one: how far above its own guidance the company would land, and what it would guide next. The second is new. Six days before the release the board accepted Jensen Huang’s resignation, effective immediately, and made CFO Colette Kress interim chief executive while she keeps the CFO role. The stock closed at $156.14 on Monday, 34.7% below its record close of $239.24 on 6 October.
We covered the leadership change and the index-concentration risk in Nvidia Without Jensen Huang. This piece covers the numbers: what Nvidia reported, the bar it had set itself, what the last four reports did to the share price, and how to read the next few sessions.
What Nvidia Reported in Q3 Fiscal 2027
The quarter ended on 25 October 2026. The figures below come from Nvidia’s results press release of 17 November.
REVENUE
$115.8 billion, against $96.2 billion in Q2 and $57.0 billion a year ago. That is 20% on the quarter and 103% on a year ago.
DATA CENTER
$107.6 billion, against $89.0 billion in Q2. That is up 21% on the quarter and 110% on a year ago. Edge Computing contributed $8.2 billion.
MARGINS AND EARNINGS
Non-GAAP gross margin of 74.9% against guidance of 74.0% plus or minus 50 basis points. GAAP diluted EPS of $2.70; non-GAAP diluted EPS of $2.68.
OUTLOOK
Fourth-quarter revenue guidance of $130.0 billion, plus or minus 3%, gross margin guidance of 71.0% to 72.0%, GAAP and non-GAAP. Nvidia again assumes no Data Center compute revenue from China, and the quarter includes an extra week.
Q3 fiscal 2027 against guidance and consensus
| Metric | Reported | Nvidia guide | Consensus | Difference |
|---|---|---|---|---|
| Revenue | $115.8bn | $105.84bn–$110.16bn | $109.08bn | +$6.8bn |
| Data Center revenue | $107.6bn | — | — | +21% q/q |
| Non-GAAP gross margin | 74.9% | 73.5%–74.5% | — | +0.4 pts above the top |
| Non-GAAP EPS | $2.68 | — | $2.47–$2.48 | +$0.20 to +$0.21 |
| Q4 revenue guide | $130.0bn ±3% | — | $125.16bn–$125.21bn | About +$4.8bn |
Guidance from Nvidia’s Q2 fiscal 2027 release (26 August 2026). Consensus sources: Benzinga Pro (revenue, EPS, Q4 revenue), 24/7 Wall St. (EPS, Q4 revenue) and Yahoo Finance (revenue, about $109.1bn). Providers differ; figures are indicative.
The Bar Nvidia Set Itself
Nvidia gives a single revenue figure with a 2% band either side, and in each of the last four quarters it has landed above the top of that band. Over the last four quarters, reported revenue came in between 4.6% and 5.7% above the guidance midpoint.
Revenue against Nvidia’s own guidance
| Quarter | Reported | Guide midpoint | Above guide |
|---|---|---|---|
| Q3 FY26 (Oct 2025) | $57.0bn | $54.0bn | +5.6% |
| Q4 FY26 (Jan 2026) | $68.1bn | $65.0bn | +4.8% |
| Q1 FY27 (Apr 2026) | $81.6bn | $78.0bn | +4.6% |
| Q2 FY27 (Jul 2026) | $96.2bn | $91.0bn | +5.7% |
| Q3 FY27 (Oct 2026) | $115.8bn | $108.0bn | +7.2% |
Source: Nvidia quarterly results releases. Percentages are reported revenue divided by the prior quarter’s guidance midpoint.
Apply that range to $108 billion and you get roughly $113 billion to $114 billion. That is arithmetic, not a forecast, and it is not the same as consensus. But it explains why a number “above guidance” can still disappoint: the market has learned to expect the habitual overshoot, and anything inside the old range reads as a slowdown. This time revenue came in at $115.8 billion, above that range as well.
The Q2 report shows the other side. Revenue of $96.2 billion beat the $91.0 billion guide by 5.7%, the widest of the four, and the stock rose 8.74% the next session. From the 26 August close to the 6 October record, NVDA gained 14.1%.
The principle: a company that beats its own guidance every quarter has two guidance numbers, the one it publishes and the one the market actually uses. Know which one you are measuring against before you call a result a beat.
The First Report Without Jensen Huang
Huang co-founded Nvidia in 1993 and ran it for its entire life as a public company. On 11 November the board accepted his resignation with immediate effect, and an 8-K filed the next day gave no reason. Colette Kress, 59, CFO since September 2013, became interim CEO and remains CFO. Harvey C. Jones, 73, was appointed the company’s first board chair. On 13 November the board told CNBC it was selecting a search firm.
That set up an unusual call. Kress has delivered the financial commentary on every call for years, so the numbers had a familiar voice. The questions that were new were the ones only a CEO usually answers: product roadmap, the big customer relationships, and how long the search will take.
In the release, Kress spoke as interim CEO as well as CFO: “Our momentum is real. NVIDIA is an exceptional technology leader.” The release’s forward-looking statements refer to the leadership transition and the search for a new chief executive. It gives no timetable for that search, and at the time of writing we have not seen one reported from the call.
For traders, the leadership question does not get settled on one call. What the call can settle is whether the business in the quarter just ended, and the one now under way, changed at all. On that, the guide is the evidence, not the tone.
Rubin, China and Gross Margin
Four items carried over from the August guidance. Here is how each one landed.
- Vera Rubin. Coverage of the Q2 call, including MarketBeat’s transcript summary, put Rubin at about 20% of Q3 Data Center revenue, with the ramp described as supply-constrained. The release says Vera Rubin NVL72 has shipped, calls its production ramp the fastest in Nvidia’s history, and lists racks running at CoreWeave, Google Cloud, Microsoft Azure, Oracle Cloud Infrastructure and Nebius. Kress said Rubin is “off to an explosive start”. The release gives no revenue share for Rubin.
- China. The Q3 guide assumed no Data Center compute revenue from China. Any China revenue is upside to that guide; any change to the assumption for Q4 matters more. Nvidia reported no change: the Q4 guide again assumes none.
- Gross margin. Guidance was 74.0% plus or minus 50 basis points, a step down from 75.0% in Q2. A new architecture ramp usually costs margin early. Q3 came in at 74.9% non-GAAP, above the top of the 73.5% to 74.5% range. The Q4 guide is 71.0% to 72.0%. That step down is not new: on the August call Kress said margins should bottom in the fourth quarter at 71% to 72%, citing memory pricing, according to a call transcript cited by Invezz.
- Operating expenses. Guided at about $9.2 billion GAAP and $9.0 billion non-GAAP. Q3 came in at $9.2 billion GAAP and $8.8 billion non-GAAP. Q4 is guided at about $11.0 billion GAAP and $10.7 billion non-GAAP.
What the Last Four Reports Did to the Stock
Nvidia beat its own revenue guidance in all four of the last reports. The stock fell the next session after three of them.
NVDA next-session move after results
| Report | Release date | Close on release day | Next close | Move |
|---|---|---|---|---|
| Q3 FY26 | 19 Nov 2025 | $186.52 | $180.64 | −3.15% |
| Q4 FY26 | 25 Feb 2026 | $195.56 | $184.89 | −5.46% |
| Q1 FY27 | 20 May 2026 | $223.47 | $219.51 | −1.77% |
| Q2 FY27 | 26 Aug 2026 | $209.66 | $227.98 | +8.74% |
| Q3 FY27 | 17 Nov 2026 | $155.46 | — | About +2% in early after-hours trading (indicative) |
Regular-session closes from TradingView (NASDAQ:NVDA). Nvidia releases after the US close, so the next close is the first full session to price the report. After-hours figure is indicative and will change by the open.

The setup into this report was different from any of those four. NVDA fell 9.26% on 5 November during the broader AI sell-off, then fell a further 14% by Monday’s close as the leadership news landed. It went into the print down 16.3% for the year, at its lowest close in more than twelve months.
What the Headlines Get Wrong
Earnings-night coverage of Nvidia is written in minutes, and a few traps repeat every quarter.
GAAP EPS is above non-GAAP. For most companies the adjusted figure is the higher one. At Nvidia it has recently been the other way round: in Q1 fiscal 2027 GAAP diluted EPS was $2.39 against $1.87 non-GAAP, and in Q2 it was $2.46 against $2.22. The gap comes largely from gains on equity investments, which Nvidia strips out of its adjusted numbers. A headline EPS figure means nothing until you know which of the two it is.
“Beat” against what? A result can beat Nvidia’s guide, match consensus and miss the habitual overshoot at the same time. Check which bar a headline is using.
After hours is not the reaction. In February, Fortune reported the stock up more than 2% in early after-hours trading, with much of that gain quickly given back. The next regular session closed 5.46% lower. Wait for the close before you file a report as bought or sold.
The margin “warning” was in August’s script. Some first-night coverage flagged the 71% to 72% Q4 gross margin guide as a new warning sign. Kress gave that same range for Q4 on the August call. The news would have been a number below it.
The extra week. Nvidia’s fourth quarter has 14 weeks this year, and the release says so. Scale $130 billion down to 13 weeks and you get roughly $120.7 billion, about 4% above Q3 rather than 12%. That is our rough arithmetic, not a company figure, but it is the comparison that removes the calendar.
This quarter, GAAP and non-GAAP EPS were close. GAAP diluted EPS was $2.70 against $2.68 non-GAAP, a much smaller gap than in Q1 and Q2.
Nvidia publishes its press release and CFO commentary on its investor relations site at the moment of release. If a number moves you, find it there first.
Nvidia Earnings Through Mind, Method and Money
Mind. A stock that has fallen a third in six weeks, with its founder gone, invites a story before the numbers arrive. Bulls will read a big beat as proof that nothing changed. Bears will read any softness as proof that everything did. Decide in advance which numbers would change your view, and if none would, you are not analysing the release, you are waiting for it to agree with you.
Method. The last four reports produced next-day moves of −3.15%, −5.46%, −1.77% and +8.74%. The one that rose was the one with the widest beat against guidance. Measure tonight’s result against the 4.6% to 5.7% range, not just against $108 billion, and let the first full regular session, not the after-hours tape, confirm the direction. Tonight’s 7.2% beat against guidance was the widest of the five, which on the August pattern argues for a positive reaction, but the 18 November close is the number that counts.
Money. NVDA fell 9.26% in a single session this month. Earnings add a gap on top of a stock already moving that far. Size for the move that has already happened, not the one you expect. Our trading calculators show what 1% risk allows on a stock with that range, and the position sizing guide covers why the stop distance, not conviction, sets the size.
The Short Version
Nvidia beat its own revenue guide by 7.2%, above the 4.6% to 5.7% range of the previous four quarters, and beat consensus on revenue, EPS and the Q4 guide. Data Center revenue rose 110% on a year ago to $107.6 billion.
The $130 billion Q4 guide is strong but includes an extra week, and gross margin steps down to 71% to 72%, a dip Kress had already flagged in August.
The release could not settle who runs Nvidia next. It did show that the quarter which ended three weeks before Huang left was the strongest of the year, and management is guiding higher.
The pattern we trace in Greatest Companies applies here: a great business and a good trade are different questions, and the gap between them is widest when the price has already decided what it believes.
Related Reading
- Nvidia Without Jensen Huang: Key-Person Risk in a 7% Slice of the S&P 500 – the leadership change and what it means for index holders.
- Nvidia: The 90% Drawdown That Built the AI Age – how the company survived to become the centre of AI spending.
- AI Bubble vs Dotcom Bubble: What the Data Actually Says – the comparison every sell-off revives.
- When the Bond Market Spoke First: CoreWeave, AI Debt and the Telecom Bust – Nvidia’s customers and how they pay for it.
- Anthropic IPO – the other AI listing this week.
- Tesla Q3 Earnings: The Beat It Didn’t Spend – another quarter where the headline beat was not the story.
- The M·M·M Assessment – find your weakest link before the next earnings gap does.
Frequently Asked Questions
When did Nvidia report Q3 fiscal 2027 earnings?
Nvidia released the results on Tuesday 17 November 2026, after the US market close, at about 1:20 pm Pacific time (4:20 pm Eastern), with the conference call at 2 pm Pacific (5 pm Eastern). The quarter ended on 25 October 2026.
What did Nvidia report for Q3 fiscal 2027?
Revenue was $115.8 billion, up 103% from a year ago and 20% from Q2. Data Center revenue was $107.6 billion, up 110%. Non-GAAP gross margin was 74.9%. GAAP diluted EPS was $2.70 and non-GAAP diluted EPS was $2.68.
Did Nvidia beat expectations?
Yes, on each measure we checked. Revenue was 7.2% above Nvidia’s $108.0 billion guide and above consensus of about $109.1 billion (Benzinga Pro). Adjusted EPS of $2.68 beat estimates of $2.47 to $2.48. The $130 billion Q4 guide compares with consensus of about $125.2 billion. The beat against guidance was also wider than the 4.6% to 5.7% of the previous four quarters.
What was Nvidia’s Q3 guidance?
Revenue of $108.0 billion, plus or minus 2%, which Nvidia said assumed no Data Center compute revenue from China. GAAP and non-GAAP gross margins were guided at 74.0%, plus or minus 50 basis points, with operating expenses of about $9.2 billion GAAP and $9.0 billion non-GAAP.
Who is running Nvidia now?
Colette Kress, the company’s CFO since September 2013, is interim CEO and remains CFO. The board accepted Jensen Huang’s resignation on 11 November 2026 and appointed Harvey C. Jones as its first chair. The board said on 13 November that it was selecting a search firm. The Q3 release refers to the search for a new chief executive but gives no timetable.
The takeaway. Nvidia delivered its widest beat against its own guidance in five reports and guided higher, with a margin dip it had flagged in August. The leadership question is still open, and the next regular session, not the after-hours tape, will show which of the two the market weighs more.
Size for the gap, not the narrative. The CTE trading calculators will show you what your risk rules actually allow.
This article is educational and is not financial advice. It does not recommend buying or selling Nvidia, NVDA or any security. Figures are taken from Nvidia’s quarterly results releases for Q3 fiscal 2026 to Q3 fiscal 2027, Nvidia’s 8-K of 12 November 2026, TradingView price data, and contemporaneous reporting by CNBC, Fortune, MarketBeat and Benzinga, Yahoo Finance, 24/7 Wall St. and Invezz. Consensus figures vary between providers. After-hours prices are indicative. Prices change constantly; verify current figures against primary sources before making any decision. Trading and investing carry risk, including the loss of capital.
 The Complete Trader's Edge
The full Mind · Method · Money framework. 70 chapters.
View on Amazon →
 Market Mayhem
400 years of bubbles, crashes, and the pattern that keeps repeating.
Buy on Amazon →
 Greatest Companies
How the world's greatest companies were built — and what traders learn from them.
View on Amazon →
 Greatest Traders
Eighty-six lives that explain the markets — Livermore to Madoff, told with the losses left in.
View on Amazon →