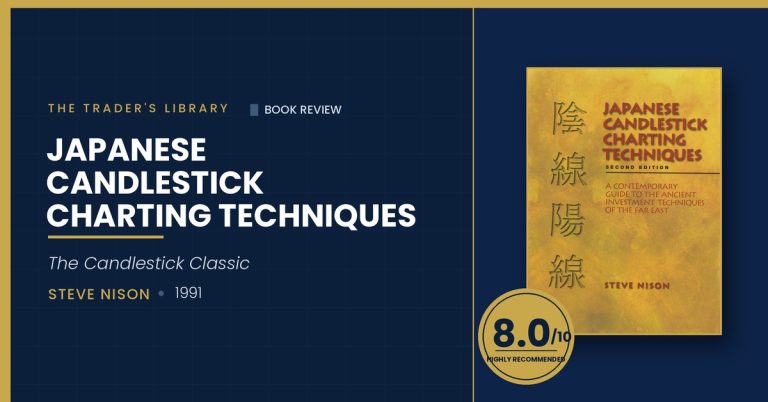
Candlestick charts were developed in 18th century Japan by rice traders, most famously refined by Munehisa Homma, and brought to Western audiences by Steve Nison in the 1990s. They encode price information, open, high, low, close, into a visual format that makes the relationship between buyers and sellers immediately apparent. But their usefulness depends entirely on context.
Most traders learn candlestick patterns early in their development and then misapply them for the rest of their careers. They memorise dozens of pattern names, see them everywhere, and trade them without regard for where they form or what the broader market structure is doing. This article teaches you which patterns actually matter, where they carry real information, and why a pattern without context is just noise.
Reading a Single Candle: The Anatomy

Every candlestick tells a story about the battle between buyers and sellers during that time period. Learning to read that story is a foundational skill.
A candle’s body represents the distance between open and close. A long body with small wicks means one side dominated the entire period: a strong directional session with clear conviction. A small body with long wicks means neither side held control: indecision, uncertainty, or a battle that ended in a draw.
The wicks (or shadows) show price rejection. A long lower wick means price traded down significantly but buyers pushed it back up before the close. A long upper wick means price traded up but sellers pushed it back down. The longer the wick relative to the body, the stronger the rejection of that price level.
The close relative to the range is the most important single piece of information. A candle that closes in its upper 25% shows buyers won the period. A candle that closes in its lower 25% shows sellers won. Where the candle closes tells you who had the last word.
The Patterns That Matter Most

There are dozens of named candlestick patterns. Most of them add minimal value to a trading system built on price action and ICT concepts. Focus on mastering these five, which account for the vast majority of actionable candlestick signals:
Single-Candle Reversal Patterns

| Pattern | What It Looks Like | What It Tells You | Where It Matters |
|---|---|---|---|
| Pin bar / Hammer | Small body, long lower wick (2-3x body) | Buyers aggressively rejected lower prices | At support, OBs, Fibonacci levels in uptrend |
| Shooting star | Small body, long upper wick | Sellers aggressively rejected higher prices | At resistance, supply zones, in downtrend |
| Engulfing candle | Body completely engulfs previous candle’s body | Momentum shift: the new side took complete control | At key structural levels after a pullback |
| Inside bar | Entire candle within previous candle’s range | Consolidation. Energy building before a move. | After an impulsive move, before continuation |
| Doji | Open and close at nearly the same price | Perfect indecision. Buyers and sellers in equilibrium. | At trend exhaustion points, especially after extended moves |
Multi-Candle Reversal Patterns


The morning star (bullish) and evening star (bearish) are three-candle reversal patterns. The morning star consists of a bearish candle, followed by a small-bodied candle or doji (the indecision), followed by a bullish candle that closes into the body of the first candle. It signals that selling exhaustion has occurred and buyers are taking control. The evening star is the bearish mirror.
These patterns are most reliable on the daily chart at significant structural levels. On intraday charts, the signal-to-noise ratio decreases substantially.
The Critical Caveat: Context Is Everything
Candlestick patterns are confirmation signals, not standalone strategies. A pin bar at a significant support level in an uptrend, after a measured pullback to an Order Block, with the 15-minute timeframe inside the New York Kill Zone: this is a trade. A pin bar in the middle of a range on a 1-minute chart with no structural context is noise.
The context hierarchy for evaluating any candlestick pattern:
1. Market structure bias. Is the pattern forming in the direction of the trend? A bullish engulfing in an uptrend pullback is significantly more reliable than one forming in a downtrend.
2. Key level. Is the pattern forming at a level that matters? Order Block, Fair Value Gap, Fibonacci golden pocket, Volume Profile level? A pattern at a high-confluence zone is a signal. The same pattern in no-man’s land between levels is not.
3. Timeframe. Higher timeframe patterns carry more weight. A daily engulfing candle is significantly more meaningful than a 5-minute one because it represents an entire day of participation, not five minutes of noise.
4. Session timing. Patterns forming during active Kill Zone hours (London open, New York open) carry more weight than those forming during the Asian session or between sessions, when volume is thin and patterns are less reliable.
Key Lessons
- Candlesticks encode buyer/seller dynamics visually. Body size and wick length carry specific information about who won the period.
- Pin bars, engulfing candles, inside bars, doji, and morning/evening stars are the highest-utility patterns.
- Context is everything. Evaluate every pattern through four filters: structure, level, timeframe, and session.
- Patterns at significant structural levels on higher timeframes carry far more weight than isolated patterns on low timeframes.
- A pattern without context is noise. A pattern with context is a signal.
Frequently Asked Questions
How many candlestick patterns do I need to learn?
Five is sufficient for most strategies: pin bar (hammer/shooting star), engulfing candle, inside bar, doji, and morning/evening star. Learning 30+ patterns adds minimal value and creates pattern-hunting behaviour where you see signals that are not there. Master the five core patterns at key levels, and you will have a more reliable system than a trader who can name every pattern in the textbook but cannot read context.
Do candlestick patterns work on all timeframes?
The patterns are valid on all timeframes, but reliability increases with timeframe. A daily pin bar represents 24 hours of trading and thousands of participants. A 1-minute pin bar represents 60 seconds and may reflect a single large order. For most traders, the 4-hour and daily charts produce the most reliable candlestick signals. Use 1-hour and 15-minute patterns only when they confirm higher timeframe setups at key levels.
Should I use candlestick patterns as my primary entry trigger?
For many price action and ICT traders, yes. The candlestick pattern serves as the final confirmation at a pre-identified level. The process is: (1) identify direction from higher timeframe market structure, (2) identify the entry zone (Order Block, FVG, Fibonacci level), (3) wait for price to reach the zone, (4) enter when a confirming candlestick pattern forms at the zone. The pattern is the trigger, not the strategy.
What is the difference between a pin bar and an Order Block?
A pin bar is a candlestick pattern that shows price rejection at a level. An Order Block is the candle or group of candles before an impulsive move where institutional orders were placed. They can overlap: a pin bar that forms at an Order Block is a high-probability setup because you have both the institutional level (OB) and the confirmation signal (pin bar) at the same price. But they answer different questions. The OB tells you where to look. The pin bar tells you when to enter.
Are there candlestick patterns I should avoid trading?
Avoid trading patterns that form in the middle of a range with no clear structural context, patterns on the 1-minute or 5-minute chart unless they confirm a higher timeframe setup, patterns that form during low-volume sessions (between Kill Zones), and patterns where the body-to-wick ratio is ambiguous (the “almost” pin bar that does not have a clear wick rejection). When in doubt about whether a pattern qualifies, it does not qualify. The best candlestick signals are obvious. If you have to squint to see it, pass.
Continue Reading
▶ Price Action Trading: Reading Markets Without Indicators
▶ Market Structure: The Complete Guide
From The Book
This article covers concepts from Chapter 24 of The Complete Trader’s Edge.
 The Complete Trader's Edge
The full Mind · Method · Money framework. 70 chapters.
View on Amazon →
The Complete Trader's Edge
The full Mind · Method · Money framework. 70 chapters.
View on Amazon →
 Market Mayhem
400 years of bubbles, crashes, and the pattern that keeps repeating.
Buy on Amazon →
Market Mayhem
400 years of bubbles, crashes, and the pattern that keeps repeating.
Buy on Amazon →