Market Mayhem · Episode 13 · 1995–2000 · USA / Global
Pets.com and a Trillion Dollars of Hope
The Dot-Com Bubble: When the Rules of Valuation Were Suspended
NASDAQ +500% in 5 years. Then -78%. $5 trillion destroyed. The most important bubble for any modern investor to understand — especially right now.
▶ Watch on YouTube🎵 Listen on Spotify
Also available on Apple Podcasts · Amazon Music · iHeart Radio
📄 Free Download · Episode Research Sheet
The Dot-Com Bubble Research Sheet (PDF)
The full timeline, key numbers, the Mind, Method, Money lessons, and further reading from this episode. Free, no email required.
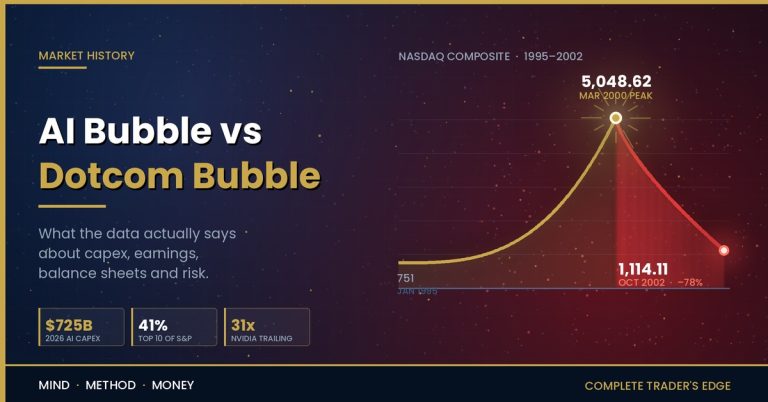
On March 10th, 2000, the NASDAQ Composite closed at 5,048 points. Its highest level in history. A gain of over five hundred percent in five years.
Companies that had never earned a profit were worth billions. Companies whose entire business model was a domain name and a PowerPoint presentation were valued at more than century-old manufacturing firms. A sock puppet — the Pets.com mascot from a $1.2 million Super Bowl advertisement — had become a cultural symbol of an era in which the rules of investment had been declared permanently changed.
Three trading days later, the NASDAQ began to fall. It would fall for two and a half years. It would lose seventy-eight percent of its value. Five trillion dollars in market capitalisation would evaporate. And the index would not see 5,000 again until 2015 — fifteen years later.
The internet changed the world. Most of the investments in it were catastrophic. The Railway Mania, four generations later, in code.
The Crisis at a Glance
| Data Point | Detail |
|---|---|
| Event | Dot-Com Bubble — speculative technology stock mania and crash |
| NASDAQ Peak | 5,048 — March 10, 2000 |
| NASDAQ Peak-to-Trough Decline | 78% — from 5,048 (Mar 2000) to ~1,100 (Oct 2002) |
| Total Market Value Destroyed | ~$5 trillion in US market capitalisation |
| Recovery to Peak | 2015 — 15 years after the peak |
| Average IPO First-Day Return (1999) | ~70% — internet IPOs routinely doubled on day one |
| theglobe.com IPO (Nov 1998) | +606% on first day of trading |
| Pets.com | Raised ~$82M including Super Bowl ad. Shut down Nov 2000. Less than 9 months after IPO. |
| Webvan | $830M in venture capital burned. Filed bankruptcy July 2001. |
| Amazon Peak-to-Trough | Lost 94% of its stock value 1999–2001. Did not go bankrupt. Eventually became the most valuable retailer in history. |
| Primary Valuation Metric Used | “Eyeballs” — website visitors — rather than revenue, earnings, or cash flow |
| M·M·M Lesson | Method — technology ≠ company quality. Money — liquidity sustains and then removes the bubble. Mind — bubbles make scepticism feel like ignorance. |
The Internet Really Was Going to Change Everything
The investment thesis of the dot-com era was not delusional at its foundation. The internet did change commerce, communication, information, entertainment, and the fundamental architecture of how economies function. Every major prediction about the internet’s transformative power has, in retrospect, proven correct or understated.
The “land-grab” theory that drove the investment mania — that first movers in any internet category would achieve network effects and scale advantages that made their positions essentially unassailable — was also not entirely wrong. Amazon’s first-mover advantage in e-commerce proved enormous. Google’s in search. Facebook’s in social networking.
The problem was the extrapolation. A thesis that was correct for five to ten companies globally in any internet vertical was applied to hundreds. The logic that made Amazon worth buying in 1997 was used to justify investments in Pets.com, in Webvan, in furniture.com, in dozens of companies whose business models had no plausible path to the economics that would justify their valuations. The technology story was real. The companies built on that story, overwhelmingly, were not.
And in the late 1990s, valuation — the boring, old-fashioned process of estimating what a business is actually worth based on its earnings and cash flows — became not just unfashionable but actively mocked. Saying “this company’s price doesn’t make sense” in 1999 meant you “didn’t get it.” The new metrics were eyeballs, page views, and the projected future moment when monetisation would justify everything. That moment was always over the horizon.
The Frenzy: When 70% First-Day Returns Were Normal
In 1999, the average internet IPO gained approximately seventy percent on its first day of trading. theglobe.com gained 606% on day one. Companies would announce their IPO date, the price would be set, and on the morning of trading, demand would be so overwhelming that the stock would open at a multiple of the offering price.
Day traders — a genuine phenomenon of the era — were leaving careers to trade technology stocks full time. CNBC ran tickers in bars. A venture capitalist named Michael Moritz at Sequoia Capital described the period as one in which “gravity had been suspended.” He meant it as an observation, not a compliment.
Pets.com spent $1.2 million on a Super Bowl advertisement. Webvan built massive warehouse infrastructure before proving anyone would pay enough for grocery delivery to cover the cost. theglobe.com sold digital community for hundreds of millions before having meaningful revenues. The IPO market was the exit. The venture capital ecosystem was the fuel. And the retail investor was the ultimate buyer.
The Crash and What Survived
March 2000: the NASDAQ peaks. There is no single trigger. Large institutional investors begin systematic rebalancing toward value. The selling is not panicked — it is methodical. But in a market sustained entirely by momentum, any sustained selling is destabilising. The NASDAQ falls. Funding tightens. Suddenly investors want to know about revenue, gross margin, and the specific month the company will be cash-flow positive.
Pets.com: shut down November 2000. Webvan: bankruptcy July 2001. Hundreds of others: gone. The NASDAQ hits its bottom at approximately 1,100 in October 2002. Down 78% from the peak in two and a half years.
But Amazon survived — despite losing 94% of its stock value between 1999 and 2001. It had a real business model underneath the hype. Google launched in 2004, profitable from the start. Apple began its extraordinary reinvention. The technology worked. The companies that had real economics underneath the story became the most valuable enterprises in human history.
The NASDAQ returned to 5,000 in 2015. By 2021, it reached 16,000. The patient investors who had survived the crash — who had not leveraged their positions, who had held companies with real businesses — were eventually rewarded beyond any projection from 1999.
The AI Mirror: Why This Episode Matters Right Now
The dot-com bubble is the most directly relevant historical episode to the current AI investment environment. The parallels are structural, not superficial.
AI is transformative. This is not debatable. The companies that will dominate AI infrastructure, AI applications, and AI-enabled services will be among the most valuable enterprises ever created. The investment thesis, at its foundation, is correct.
But the thesis is correct for perhaps five to ten companies globally. It is currently being applied to hundreds. Companies with AI in their name or pitch decks are receiving valuations disconnected from any current business reality, justified by projected future monetisation that is always just over the horizon. This is Pets.com in 1999. Different technology. Identical structure.
The discipline required: separate the technology thesis from the company thesis. AI will change the world. This specific company, at this specific price, with this specific competitive position and path to profitability — will it generate the returns that the current valuation implies? If you cannot answer that question with numbers rather than narrative, you are in a dot-com moment.
What This Means for You as a Trader
📊 METHOD — Separate the Technology from the Company
The internet changed the world. Amazon was a good investment. Pets.com was not. Both were “internet companies.” The difference was business model viability — whether the unit economics of the actual business, at scale, could generate cash flows that justified the valuation. In every technology bubble, this distinction is buried under enthusiasm for the category. Surface it. Ask: what are the revenues? What is the gross margin? What is the cash burn rate? At what scale does this business become profitable? If the answers are vague or “we’ll figure that out at scale,” you are looking at a bubble investment, not an investment in transformative technology.
💰 MONEY — Liquidity Inflates, Tightening Deflates
The dot-com bubble was sustained by extraordinary liquidity: venture capital recycling, easy credit, a retail investor public with money to deploy. When funding tightened — when VCs stopped writing checks, when the IPO market closed — the valuations that had been maintained by momentum had no floor. In modern markets: understand the liquidity environment sustaining any asset class. Low interest rates are liquidity. QE is liquidity. When they are removed, assets priced on liquidity assumptions — not fundamental value — tend to reveal what they are actually worth. The rate environment matters. Always.
🧠 MIND — Bubbles Make Scepticism Feel Like Ignorance
In 1999, saying “Pets.com’s valuation doesn’t make sense” made you sound like someone who didn’t understand how the internet worked. The bubble was psychologically structured to make scepticism feel like ignorance and enthusiasm feel like insight. Every major bubble does this — it creates a narrative in which the sceptics are the fools and the believers are the visionaries. The moment you notice that being cautious feels embarrassing, that questioning a valuation makes you seem unsophisticated, that the burden of proof has shifted onto the sceptic rather than the buyer — that is the signal. That psychological environment is the bubble revealing itself.
Frequently Asked Questions
What was the “eyeballs” metric and why was it used instead of profits?
“Eyeballs” referred to the number of unique visitors to a website — a measure of audience size rather than economic value. It replaced traditional metrics because internet companies, almost by definition, had no profits in their early stages: they were spending to acquire users as fast as possible on the theory that monetisation would follow at scale. The justification was that audience was the asset, and profitability was a downstream consequence of audience size. This was true for a small number of companies — Google’s search audience was genuinely the asset that advertising monetised. For most dot-com companies, the audience they acquired never generated enough revenue to justify the cost of acquiring it.
How did Amazon survive when so many others didn’t?
Amazon had several structural advantages that its less successful peers lacked. It had a genuine first-mover advantage in online retail that was building durable customer relationships and logistics infrastructure. Its business model — taking a small percentage of a large volume of transactions — was fundamentally sound even if it was not yet profitable at scale. Jeff Bezos was explicit about sacrificing near-term profits for long-term market position, but he was building toward an endgame where the economics actually worked. Crucially, Amazon had also raised enough capital during the boom — including through debt issuance — to survive the drought of funding that followed the crash. Many dot-com companies that had more plausible business models than Pets.com still failed simply because they ran out of money before the market recovered.
Is the current AI investment environment comparable to the dot-com bubble?
Structurally, there are meaningful parallels: a genuinely transformative technology, correct thesis applied to a far larger number of companies than will ultimately capture significant value, valuations built on projected future monetisation rather than current business economics, and a narrative environment in which scepticism feels unfashionable. The differences: the companies at the core of the AI ecosystem — Microsoft, Nvidia, Google, Amazon — are profitable businesses with real revenue, not pre-revenue startups. The speculation is more concentrated in the layer above the infrastructure, in AI application companies and AI-adjacent businesses. Whether the current environment resolves with a 2000-style crash, a gradual multiple compression, or a genuine sustained boom driven by AI productivity gains is genuinely uncertain. The dot-com lesson is not “AI will crash” — it is “distinguish the Amazons from the Pets.coms before the market does it for you.”
What happened to the day traders of the dot-com era?
Most lost significant amounts of money in the crash. The strategy of buying technology stocks in the morning and selling in the afternoon — which had worked brilliantly in a market with a consistent upward momentum — was utterly destroyed by a market that fell, on balance, for two and a half years. Many day traders returned to conventional employment. A small number developed the discipline and analytical rigour to trade effectively across all market conditions. The era did produce a generation of retail market participants who were far more financially literate about technology companies than their predecessors — knowledge that proved valuable in the recovery and beyond.
What is the “greater fool” theory and how does it apply to bubbles?
The Greater Fool theory holds that it can be rational to buy an overpriced asset if you believe you can sell it to someone who will pay an even higher price — the “greater fool.” In a bubble’s rising phase, this is not entirely irrational: if prices are going up and the IPO market consistently produces first-day gains of 70%, buying at an unsustainable valuation and selling immediately can be profitable. The theory breaks down when it becomes universally adopted, because at that point everyone is relying on someone else to be the greater fool. When the music stops — when the market stops providing a readily available greater fool — everyone holding an overvalued asset simultaneously discovers that the valuation was always the problem.
What is the most important thing to check before any technology investment?
The unit economics: what does it cost to acquire a customer, and what does that customer generate in lifetime revenue and margin? This single metric distinguishes Pets.com — where acquiring a customer cost more than the customer would ever generate in purchasing pet food online — from Amazon, where customer acquisition costs were justified by the lifetime purchasing behaviour of a loyal, high-spending, repeat customer. If a company cannot state its unit economics clearly, or if those economics are negative at current scale and the path to positive is not clearly defined, the investment case depends on something other than the fundamental business. That something is usually a story about future scale that may or may not materialise.
Continue the Market Mayhem Series
Next: Corralito — When They Locked the Banks
Argentina, 2001. The government froze its citizens’ bank accounts. Five presidents in ten days. The largest sovereign default in history. And a lesson about what your money in the bank actually means.
Market Mayhem is a historical education series produced by The Complete Trader’s Edge. All figures are sourced from historical records. Content is for educational purposes only and does not constitute financial or investment advice. Trading involves significant risk of loss.
 The Complete Trader's Edge
The full Mind · Method · Money framework. 70 chapters.
View on Amazon →
The Complete Trader's Edge
The full Mind · Method · Money framework. 70 chapters.
View on Amazon →
 Market Mayhem
400 years of bubbles, crashes, and the pattern that keeps repeating.
Buy on Amazon →
Market Mayhem
400 years of bubbles, crashes, and the pattern that keeps repeating.
Buy on Amazon →
 Greatest Companies
How the world's greatest companies were built — and what traders learn from them.
View on Amazon →
Greatest Companies
How the world's greatest companies were built — and what traders learn from them.
View on Amazon →
 Greatest Traders
Eighty-six lives that explain the markets — Livermore to Madoff, told with the losses left in.
View on Amazon →
Greatest Traders
Eighty-six lives that explain the markets — Livermore to Madoff, told with the losses left in.
View on Amazon →