

Explore all 80 books in the Trader’s Library →
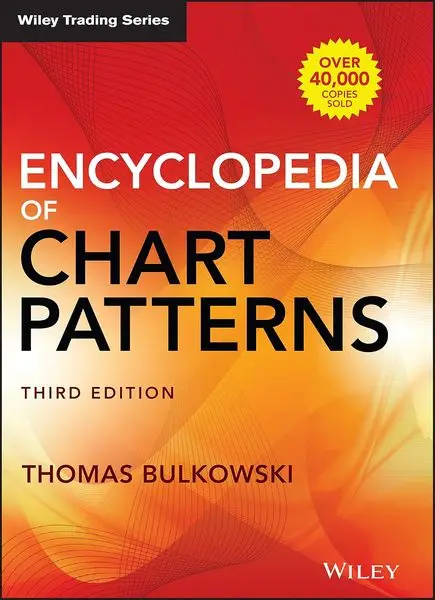
Most books that teach chart patterns tell you a head-and-shoulders is bearish and leave it there. Thomas Bulkowski did something almost nobody else has bothered to do: he tested them. Encyclopedia of Chart Patterns is the result, a vast statistical reference that catalogues dozens of patterns and reports, with hard numbers, how often each one actually works.
This is not a book you read cover to cover. It is a reference you keep on the shelf and reach for when you want to know whether the pattern in front of you has any real edge, and what the data says about how to trade it. For a technical trader who values evidence over folklore, it is in a category of its own.
At a Glance
| Author | Thomas N. Bulkowski |
| First Published | 2000 · expanded editions since |
| Pages | ~1,000 (reference) |
| Genre | Technical analysis / reference |
| Difficulty | Intermediate — not hard, but dense and statistical |
| Best For | Technical traders who want data on pattern reliability |
| Skip If | You want a narrative read or trade purely on price action without patterns |
OVERALL RATING: 8.0 / 10
Who Should Read This Book
| Reader | Verdict | Why |
|---|---|---|
| New trader (0–1 year) | Reference, not first read | Learn patterns from a teaching book first, then use this to check their real reliability |
| Intermediate (1–3 years) | Own it | The data will sharpen which patterns you trust and which you quietly drop |
| Advanced / professional | Desk reference | A standard lookup for pattern statistics, identification rules, and trading tactics |
| Pattern / swing trader | Essential | If you trade classical patterns, this is the most rigorous source on how they actually behave |
| Pure price-action trader | Optional | Useful context, but less essential if you do not trade named patterns |
| Reader who wants a story | Wrong book | This is a statistical reference, organised for lookup, not narrative reading |
The Book in Context
Chart patterns have always lived under a cloud of suspicion. Critics dismiss them as wishful pattern-matching; believers swear by them. Thomas Bulkowski, an engineer by training, decided to settle the argument with data. He identified thousands of instances of each pattern across a large sample of charts and measured what happened next: how often the pattern reached its target, how often it failed, the average move, and how features like volume or a pullback affected the outcome.
The result is the most evidence-based treatment of chart patterns available. Whatever you think of technical analysis, Bulkowski’s approach, define the pattern precisely, then measure it, brings a discipline to the subject that most pattern books completely lack.
The Core Value: Numbers, Not Opinions
The book’s contribution is turning vague claims into measured ones. For each pattern, Bulkowski reports identification guidelines, a break-even failure rate, the average rise or decline, the frequency of pullbacks and throwbacks, and practical trading tactics. Instead of “this pattern is reliable,” you get a number you can weigh against your own plan.
That reframing changes how you use patterns. Some that traders revere turn out to have high failure rates; others that get little attention perform surprisingly well. Knowing the base rates lets you size and manage trades around evidence rather than reputation.
“A pattern is only as good as its measured performance, not its reputation.”
— The evidence-first spirit of the Encyclopedia
What Each Entry Gives You
| Element | What It Tells You |
|---|---|
| Identification guidelines | Precise rules for recognising the pattern, so you are not guessing |
| Failure rate | How often the pattern fails to deliver a meaningful move, the number most books hide |
| Average move & pullbacks | Typical size of the resulting move and how often price returns to the breakout first |
| Trading tactics | Practical entry, stop, and target guidance grounded in the statistics |
Where the Book Falls Short
- It is a reference, not a read. Dense tables and repetitive structure make it a lookup tool rather than something you sit and read through. That is by design, but worth knowing.
- The data is sample-bound. The statistics come from specific markets and historical periods, largely stocks. They may not transfer cleanly to other instruments, timeframes, or today’s conditions, so treat the numbers as guidance, not guarantees.
- Patterns remain contested. Plenty of traders question whether chart patterns hold any edge at all. Bulkowski’s rigour helps, but it does not end the debate.
- Large and pricey. The full encyclopedia is a substantial, expensive volume that is overkill for a casual trader.
How the Book Fits the Mind · Method · Money Framework
| Pillar | Contribution | What the Book Delivers |
|---|---|---|
| MIND | SECONDARY | Trading from base rates rather than belief instils a healthier, evidence-led mindset |
| METHOD | PRIMARY | A measured, evidence-based reference for pattern identification and tactics |
| MONEY | SECONDARY | Failure rates and average moves help you size positions and set realistic targets |
This is a Method-pillar reference with an evidence-first spirit that complements the Mind · Method · Money framework. Use it to ground your pattern trading in measured base rates rather than received wisdom.
Read This Instead Of / Read This After
| Relationship | Book | Why |
|---|---|---|
| Read after | Technical Analysis of the Financial Markets by John Murphy | Murphy teaches you the patterns; Bulkowski tells you which ones the data supports |
| Read alongside | Trading Price Action: Trends by Al Brooks | Brooks reads bars; Bulkowski measures patterns. Together they cover intuition and evidence. |
| Read instead of | Pattern cheat-sheets online | Free cheat-sheets give you the shape; Bulkowski gives you the failure rate |
Final Verdict: Should You Read This Book in 2026?
Yes, if you trade chart patterns, but read it as a reference, not a novel. Encyclopedia of Chart Patterns is the most rigorous, data-driven catalogue of patterns available, and its evidence-first approach is exactly the discipline pattern trading usually lacks.
Keep it on the shelf, learn the patterns elsewhere, and turn to Bulkowski when you want to know whether the setup in front of you has a measured edge. Just remember the statistics come from a particular sample, so use them as informed guidance rather than as promises about today’s market.
CTE Rating Breakdown
8.0/10
The Data Behind the Patterns
| Readability | 5 | |
| Actionability | 8 | |
| Timelessness | 8 | |
| Beginner-Friendly | 5 | |
| Reference Value | 10 |
Frequently Asked Questions
What is Encyclopedia of Chart Patterns?
It is a statistical reference that catalogues dozens of chart patterns and reports measured data on each, including failure rates, average moves, and trading tactics. It is the most evidence-based pattern reference available.
Should I read it cover to cover?
No. It is designed as a lookup reference. Learn patterns from a teaching book, then use Bulkowski to check the statistics on whichever pattern you are considering trading.
Is the data still reliable today?
Treat it as guidance, not guarantee. The statistics are drawn from specific markets and historical periods, mainly stocks, and may not transfer cleanly to other instruments, timeframes, or current conditions.
Is it good for beginners?
As a reference rather than a first read. Beginners should learn how patterns work from an introductory book, then use this to understand which patterns the data actually supports.
Do chart patterns even work?
It is genuinely debated. Bulkowski’s value is that he measures rather than assumes, so you can see the failure rates for yourself and decide which patterns, if any, earn a place in your trading.
What is the single most important takeaway?
Trade patterns on base rates, not reputation. Knowing a pattern’s measured failure rate and average move lets you size and manage trades around evidence instead of belief.
About the Author
Thomas N. Bulkowski
Thomas Bulkowski is a former engineer and full-time trader who brought a researcher’s discipline to chart patterns, cataloguing and measuring them on a scale no one else had attempted. His work turned a subject often dismissed as guesswork into something testable.
Related work: a series of companion volumes on candlestick patterns, event patterns, and trading tactics, all built on the same measure-it-first philosophy.
Continue Learning
- Technical Analysis of the Financial Markets Book Review (2026)
- Trading Price Action: Trends Book Review (2026)
- Japanese Candlestick Charting Techniques Book Review (2026)
- The Three Pillars: Mind, Method, Money
- The Complete Trader’s Edge — The Book
 The Complete Trader's Edge
The full Mind · Method · Money framework. 70 chapters.
View on Amazon →
 Market Mayhem
400 years of bubbles, crashes, and the pattern that keeps repeating.
Buy on Amazon →
 Greatest Companies
How the world's greatest companies were built — and what traders learn from them.
View on Amazon →
 Greatest Traders
Eighty-six lives that explain the markets — Livermore to Madoff, told with the losses left in.
View on Amazon →