Flags and pennants are the market’s pause button. They form when a strong trend takes a breath before continuing, and they are among the most reliable continuation patterns in technical analysis.
| Feature | Flag | Pennant |
|---|---|---|
| Shape | Rectangular channel (parallel lines) | Small symmetrical triangle (converging lines) |
| Slope | Slants against the prior trend | Converges to a point (no directional slope) |
| Duration | Typically 1-3 weeks (daily chart) | Typically shorter, 1-2 weeks |
| Volume | Decreases during flag, increases on breakout | Decreases during pennant, increases on breakout |
| Target | Flagpole height projected from breakout | Flagpole height projected from breakout |
When a market moves aggressively in one direction and then consolidates briefly before continuing, it creates one of two patterns: a flag or a pennant. These are continuation patterns, meaning they signal that the existing trend is likely to resume after the pause. Among all chart patterns, flags and pennants have some of the highest completion rates, making them essential tools for trend-following traders.
What Makes a Flag
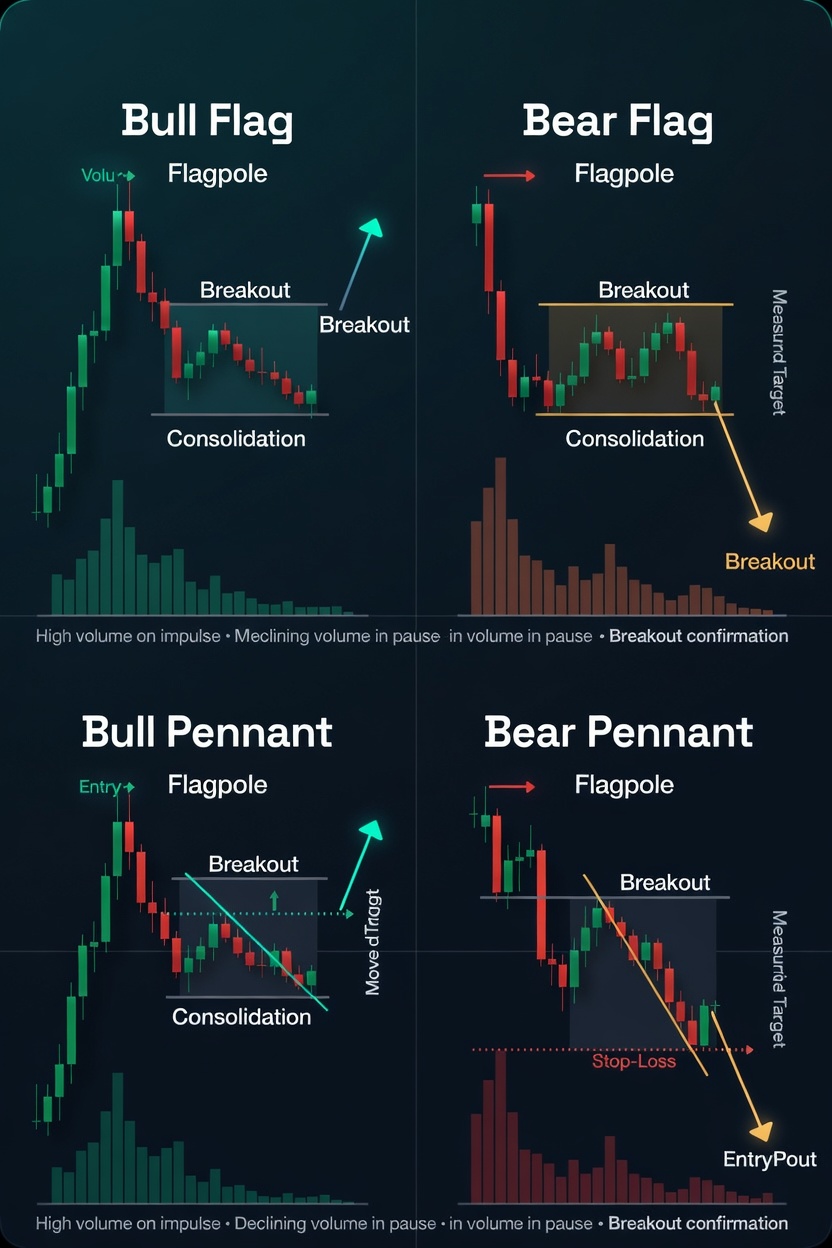
A flag forms when a strong impulsive move, called the flagpole, is followed by a shallow counter-trend consolidation contained within two parallel lines. A bull flag has a flagpole of rapid price increase followed by a slight downward-sloping channel. A bear flag has a flagpole of rapid price decrease followed by a slight upward-sloping channel.
The consolidation phase represents profit-taking by short-term participants while the underlying institutional order flow remains intact. The flag should retrace no more than 38.2% to 50% of the flagpole. If the counter-trend move retraces beyond 61.8%, the pattern becomes unreliable and the trend may be reversing rather than pausing.
Volume provides the most important confirmation. During the flagpole, volume should be high, showing strong conviction. During the flag consolidation, volume should decline progressively, indicating that the counter-trend move lacks participation. When price breaks out of the flag pattern, volume should expand again, confirming the continuation.
What Makes a Pennant
A pennant is structurally similar to a flag, but instead of a parallel channel, the consolidation phase forms a small symmetrical triangle. Two converging trendlines contain the price action, creating a narrowing range that eventually breaks in the direction of the original trend.
Pennants typically resolve faster than flags. The converging lines create compression that forces a resolution, usually within 1 to 3 weeks on a daily chart or a few hours on an intraday chart. Like flags, the flagpole should show strong momentum and volume, while the pennant consolidation shows declining volume and narrowing range.
How to Trade the Breakout
The standard entry is on the breakout candle that closes beyond the flag or pennant boundary. For a bull flag, wait for a candle to close above the upper boundary of the flag channel. For a pennant, wait for a close above the upper converging trendline.
Stop placement goes below the lowest point of the flag or pennant consolidation. This is the level where the pattern is invalidated. If price breaks below the consolidation range, the continuation thesis is wrong and you should exit.
The measured move target is the length of the flagpole projected from the breakout point. If the flagpole was 200 pips and the breakout occurs at the top of the flag pattern, your target is 200 pips above the breakout level. This measured move target has a historically high completion rate for well-formed flag patterns.
Flags Through a Smart Money Lens
In the ICT framework, the flag consolidation often contains fair value gaps from the flagpole that have not yet been filled. The consolidation is price returning to fill those imbalances before continuing. When a flag retracement fills into a bullish FVG from the flagpole and then reverses at that level, you have both a classical pattern breakout and an ICT level confluence.
The manipulation phase of the Power of 3 often creates a false break of the flag pattern before the true continuation. Price may briefly spike below the flag’s lower boundary, sweep the stops of traders already positioned long within the flag, and then reverse and break out to the upside. Recognising this false break as a liquidity sweep rather than a pattern failure is the difference between getting stopped out and entering the best trade of the day.
Flags on Multiple Timeframes
Flags and pennants are fractal. They appear on every timeframe from 1-minute charts to monthly charts. The most reliable flags are those visible on higher timeframes, such as daily or weekly, because they represent more significant institutional order flow.
A powerful technique is identifying a higher-timeframe flag and then dropping to a lower timeframe to find a precise entry within the consolidation. A daily bull flag might show a 4-hour order block retest or a 15-minute FVG fill that provides a low-risk entry before the breakout occurs on the daily chart.
Common Mistakes with Flags
The most common error is identifying patterns that are not actually flags. A genuine flag requires a sharp, impulsive flagpole. Without the initial momentum, the pattern is just a random consolidation. The flagpole should be clearly the dominant feature of the pattern, with the consolidation being a relatively brief pause.
The second mistake is entering before the breakout confirms. Anticipating the breakout and entering within the flag saves you a few pips on the entry but dramatically increases the probability of being stopped out if the pattern fails or if the manipulation phase sweeps the flag before continuing.
The third mistake is ignoring volume. A flag breakout on declining volume is far less reliable than one on expanding volume. Volume is the conviction signal that separates genuine breakouts from false ones.
📚 Related Articles:
This article is adapted from The Complete Trader’s Edge
70 chapters covering Mind · Method · Money — the most comprehensive trading education framework available.
Frequently Asked Questions
What is the difference between a flag and a pennant?
A flag is a rectangular consolidation pattern where the pullback channel runs parallel (slanting against the prior trend). A pennant is a small symmetrical triangle where the pullback channel converges to a point. Both are continuation patterns that form after an impulsive move (the “flagpole”). The trading approach is identical: enter on the breakout from the pattern in the direction of the prior impulse, with a stop below the pattern low (for bullish setups) and a target measured by the flagpole height.
How reliable are flag and pennant patterns?
When they form after genuine impulsive moves with clear market structure breaks, flags and pennants are among the most reliable continuation patterns. Their reliability increases when they appear on higher timeframes (4-hour, daily), when volume decreases during the consolidation phase, and when the breakout aligns with the higher timeframe trend direction. On lower timeframes or in ranging markets, they produce more false breakouts.
Where do I place my stop loss on a flag or pennant trade?
Place your stop loss below the low of the flag or pennant pattern (for bullish setups). This is the point where the consolidation pattern is broken and the continuation thesis is invalidated. The stop should be beyond the pattern boundary, not at it, to avoid being swept by a minor wick before the breakout occurs.
How do I set a profit target for flag and pennant trades?
The standard target is the height of the flagpole (the impulsive move that preceded the pattern) projected from the breakout point. If the flagpole was 80 pips and the breakout occurs at 1.1050, the target is 1.1130. This typically produces excellent risk-to-reward ratios because the stop (pattern height) is smaller than the target (flagpole height).
Can flags and pennants appear in downtrends?
Yes. Bearish flags and pennants are the mirror image: an impulsive move down (the flagpole), followed by a brief consolidation that drifts slightly upward or converges (the flag/pennant), followed by a breakout to the downside. The same rules apply in reverse. Bearish flags in confirmed downtrends are just as reliable as bullish ones in uptrends.
Continue Reading
▶ Chart Patterns: The Complete Guide
▶ Trend Trading: The Highest Probability Approach
From The Book
This article covers concepts from Chapter 33 of The Complete Trader’s Edge.
 The Complete Trader's Edge
The full Mind · Method · Money framework. 70 chapters.
View on Amazon →
The Complete Trader's Edge
The full Mind · Method · Money framework. 70 chapters.
View on Amazon →
 Market Mayhem
400 years of bubbles, crashes, and the pattern that keeps repeating.
Buy on Amazon →
Market Mayhem
400 years of bubbles, crashes, and the pattern that keeps repeating.
Buy on Amazon →
 Greatest Companies
How the world's greatest companies were built — and what traders learn from them.
View on Amazon →
Greatest Companies
How the world's greatest companies were built — and what traders learn from them.
View on Amazon →