

Greatest Traders · Market Wizards: The Next Generation
Kristjan Kullamägi
The $105 Million That Lasted a Few Days
Known online as Qullamaggie · Chapter 1: “From Living to Trade to Trading to Live”
Listen on Spotify
Watch on YouTube
Also available on Apple Podcasts · Amazon Music · iHeart
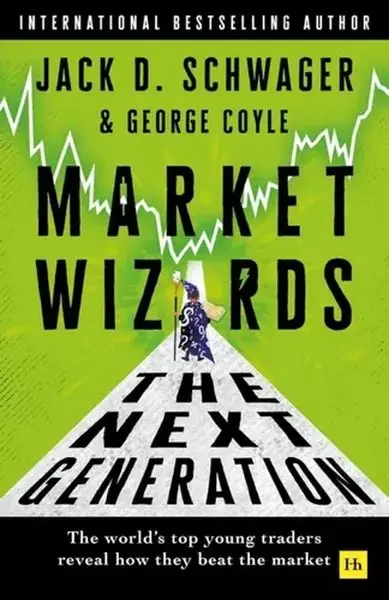
Kristjan Kullamägi turned a starting stake worth about $5,000 into a $105 million account in roughly a decade, and then gave back close to $60 million of it in the eight months that followed. Both figures come from the same chapter of Market Wizards: The Next Generation, and the second one is the reason the chapter is worth reading.

Eighty-six lives read through Mind · Method · Money, from Livermore reading a chalkboard in 1892 to the traders still working from those ideas today. Told as they happened, with the losses left in, and every quotation traced to a source.
Almost every write-up of him online stops at the first number and the three setups. That version is not wrong, but it is the part he considers the least interesting. His own account is about what happened after the peak, why it happened, and what it cost him beyond the money.

This profile covers the record as published, the three setups exactly as he defines them rather than as the internet paraphrases them, the risk architecture that kept a 25% win rate profitable, the 2022 collapse in detail, and the parts that do not transfer to a small account.
Kristjan Kullamägi at a glance
| Field | Detail |
|---|---|
| Known as | Qullamaggie |
| Based | Sweden |
| Education | Biomedical laboratory science, three years, dropped out in the final months |
| First job | Security guard, Nasdaq Stockholm building, summer 2010 |
| Started trading | Spring 2011 |
| Starting stake | About $5,000, saved from security shifts |
| Accounts blown | Three, before the fourth attempt worked |
| Equity peak | $105 million, November 2021 |
| Method | Three setups: episodic pivot, breakout, parabolic short |
| Risk per trade | 0.5% or less, 1% maximum |
| Win rate | 25% to 30%, his own estimate |
| In the book | Chapter 1 of Market Wizards: The Next Generation (2026) |
The record, and the shape of the curve
The headline is that a stake of roughly $5,000 became more than $100 million. The detail that gets left out is that he withdrew money from the account every year to pay Swedish taxes and cover living costs, so the compounding happened net of a real drag rather than in a sealed box.
The arc, as the chapter lays it out:
| When | Account | What was happening |
|---|---|---|
| Spring 2011 | About $5,000 | First live account, funded by security shifts |
| 2011 to 2013 | Three blow-ups | Two months, then five months, then almost a year |
| 2013 onwards | Profitable | Fourth attempt, after roughly two years of losses |
| January 2020 | $3.5 million | Nine consecutive profitable years behind him |
| December 2020 | $36 million | A gain close to 1,000% in a single year |
| November 2021 | $105 million | The last leg, $65m to $105m, took about six weeks |
| Mid-2022 | Roughly $45 million | Approximately $60 million lost from the peak |
That curve is the whole story in one object. The steepest part of the ascent and the beginning of the collapse are separated by about a month, and the chapter is unusually direct about why.
Why the 25% win rate is the wrong thing to stare at
Kullamägi estimates that between 25% and 30% of his trades are winners. He says he never cared about the statistic and only worked it out because so many people kept asking. Schwager agrees with the indifference and puts the reason plainly: what matters is expected gain per trade, which is the win rate multiplied by the average win minus the loss rate multiplied by the average loss. The win rate on its own tells you nothing.
It is worth making that concrete, because the arithmetic is less forgiving than most people assume. Take a 27% win rate and a loss that is capped at 1R by a stop at the low of the day. Here is what the average winner has to be worth before the method makes money at all.
| Average winner | Expectancy per trade | Verdict |
|---|---|---|
| 2.0R | −0.19R | Loses money |
| 2.7R | 0.00R | Breakeven |
| 3.0R | +0.08R | Marginal |
| 4.0R | +0.35R | Works |
| 6.0R | +0.89R | Compounds hard |
| 10.0R | +1.97R | The outlier years |
Below about 2.7R the whole thing is a slow bleed. That is the real constraint on his method, and it explains two of his rules that otherwise look arbitrary. The stop has to sit at the low of the day so the losses stay uniform and small. The winners have to be held through the moving average rather than sold into the first burst of strength, because selling early is what drags the average winner down towards the breakeven line.
George Coyle, who co-wrote the book, reviewed the underlying statements and describes what he found: loss after loss after loss, with most trading days showing several unprofitable same-day entries and exits. That is what a 27% win rate looks like from the inside, and it is the part nobody screenshots.
Three blow-ups and a night shift
In the summer of 2010 he was a college student working a summer job as a security guard, and one of his shifts was in the Nasdaq Stockholm building. He watched people in suits come and go, noticed that their offices were good and their cars were better, and had no idea what any of them actually did. He started reading, first about investing, then about trading, and decided within a year that trading was what he wanted.
He was three years into a biomedical laboratory science degree and dropped out in the final months of it. His reasoning was not complicated: he had grown tired of studying, he liked the idea of working for himself, and he could always go back to the security job or finish the degree later.
The first thing he did was open a paper trading account, where he doubled his money in two weeks. He went live, and lost 90% of it in two months.
There was no method behind any of it. He was day trading only, working from basic intraday material he had read, following day traders on social media and copying what they appeared to be doing. He went all in on every trade, which he means literally: 100% of the account in a single position. He knew nothing about position sizing and nothing about risk management.
He judged his own progress by how long it took him to blow up. Two months, then five months, then almost a year.
After the first account went, he went back to the security desk. Long hours, nights and weekends, living cheaply. Six months later he had saved about $4,000 and opened a second account. He blew that one too, then repeated the cycle a third time.
The security job was not a fallback. It was the funding mechanism and the study hall at the same time. Because he worked nights in an office full of cameras with only a few rounds to walk, he could do a 12-hour shift and spend half of it reading trading books and going through charts on his laptop. He was paid extra for nights. He describes the arrangement as a great deal, which is a strange thing to say about the job you take after losing everything three times, and it is the most useful detail in the origin story.
What actually changed on the fourth attempt
He is careful to say it was not one thing. It was a combination of taking losses faster, concentrating on high-probability trades, locking in profits and cutting out the obviously stupid decisions. In the first two years his standing error was ignoring the stop he had already decided on, which turned ordinary losses into two or three times what they should have been.
One structural change did a disproportionate amount of the work. He switched from a Swedish broker to a US-based one, which cut his commissions by around 90% and, just as importantly, let him short. Trading US stocks from Sweden had been expensive enough to eat the edge on an intraday strategy. Removing that cost did not make him a better trader, but it made a marginal method viable.
Confidence came in his third year, after four or five consecutive good months, when he realised he was making many times what he could earn in a normal job and stopped worrying about blowing up.
The three setups, as he actually defines them
He trades three setups and has done for years. He is emphatic that he invented none of them, that he took every concept from other traders, and that he has never had an original trading insight. What he did was look at thousands of historical charts until he could verify that the patterns repeated, which is a different kind of work.
He also says he does not want a fourth setup, and does not need one.
1. The episodic pivot
This is his main strategy now. He learned it from Pradeep Bonde of Stockbee, credits him by name, and notes that Bonde in turn took the idea from Paul Tudor Jones and others in the original Market Wizards books. The lineage matters to him.
The trade is buying a stock that gaps sharply higher on surging volume in response to significant news. Three ingredients have to be present at once:
The three ingredients
A major news item. Something that makes the market completely reassess the company. A surprisingly strong earnings report, or a development of similar weight.
A big gap up. The reassessment has to show in the opening price, not build slowly.
A huge increase in volume. This is the condition he will not compromise on. If the volume explosion is not there, he is not interested.
The scan is deliberately crude: every day, stocks up at least 10% on high volume. Around 99% of what comes back is discarded, either because there is no real news behind the move or because the stock is not the type that can travel. He is not going to buy a utility. Technology, biotech and small caps are where the setup pays.
The ideal candidate is a neglected stock, something that has gone sideways for months or years and then suddenly trades ten times its average daily volume. What he does not want is a stock that has already run a long way in a short time.
Entry is above the high of the first 5-minute bar if opening volume is heavy enough, and above the first 1-hour bar if he needs longer to confirm the volume. He buys into strength rather than waiting for a pullback. The protective stop is the low of the day.
Two examples from the chapter. Tempus AI in January 2025, where the company announced the release of an AI-powered healthcare app and the stock traded ten times its average volume straight out of the gate, then more than doubled over the following weeks. And Peloton in August 2024, a beaten-down pandemic highflyer that formed a textbook episodic pivot on a bullish earnings report, then gave a second, separate breakout trade a couple of months later when it broke out of a consolidation.
2. The breakout
Also learned from Bonde, who calls it a momentum burst. Bonde’s research found that when stocks make explosive moves, most of the move is finished within three to five days, and that became the holding period.
It is a purely technical setup. Strong stocks tend to move in a stair-step pattern: a leg up, a sideways consolidation, another leg up. He buys the break of the consolidation and holds for three to five days. The underlying idea, buying strength rather than waiting for a discount, runs straight back to Richard Driehaus, who built a career on buying high and selling higher.
The filters are tighter than most summaries suggest:
The breakout conditions
Leading stocks only. He scans for the 1% or 2% of stocks with the largest upward moves over the past one, three and six months. Not turnarounds, not bargains.
Short consolidations. Usually one to three weeks, not two to eight. Longer bases are not what he is looking for.
Entry above the opening range, or above the high of the first 5, 30 or 60-minute bar. The longer the interval, the worse the entry price and the lower the odds of a false breakout. That is an explicit trade-off he makes consciously.
Market direction is a condition, not a preference. Four out of five stocks move with the market, so a breakout taken in a downtrend is a different trade with worse odds.
He is blunt that false breakouts are common and that the success rate on this setup is well below 50%. It works on balance because the winners are far larger than the losers, which is the same arithmetic as the table above.
3. The parabolic short
The counter-trend setup, and the one most often described incorrectly online. It is not a two-way reversal trade. It is short only.
He shorts small-cap stocks that have run up several hundred percent over multiple consecutive days and then begin to show weakness. These are typically pump-and-dump moves. He identifies them by scanning for stocks up several hundred percent over a few days and then checking for a reason: if there are no filings, no news and no sector theme, something is being promoted, usually through Discord groups or X.
The definition of a top-quality setup is specific:
His A+ parabolic short
The stock is up three or four days in a row with a total gain of at least 300%.
Never day one, no matter how far the stock is up. He has seen stocks gain 1,000% in a single day.
Rarely day two. He usually waits for the third or fourth day. Going short too early produces a run of mid-size losses that eat the eventual winner.
The trigger is a sign of weakness: the opening range low breaking, or a break below a 5-minute bar if the stock is still climbing. The stop is the high of the day.
He is unusually honest about this one. It is frustrating, you can take several losses before you get it right, and it can hurt you mentally as well as financially. He did far more of it in his early profitable years and does much less now, waiting only for A+ setups, which do not appear often.
The clearest illustration in the chapter is Sealsq (LAES) in December 2024, which gave him both setups within three weeks and taught him something on each. More on that below, because the first half of it is a discipline failure rather than a trade.
| Episodic pivot | Breakout | Parabolic short | |
|---|---|---|---|
| Direction | Long | Long | Short only |
| Trigger | News gap on huge volume | Break of a 1 to 3 week consolidation | Weakness after 3 to 4 up days totalling 300%+ |
| Universe | Neglected stocks, tech, biotech, small caps | Top 1% to 2% of movers over 1, 3 and 6 months | Small-cap pump-and-dumps |
| Stop | Low of the day | Low of the day | High of the day |
| Hold | Days to weeks | 3 to 5 days, longer on the trailer | Days |
| Needs a bull market? | Yes | Yes | No |
The risk architecture that made a 25% win rate survivable
The setups are public and have been for years. The risk rules are where the actual engineering is, and there are only four of them.
The four rules
1. Risk 0.5% or less per trade, 1% at absolute maximum. Not a range he drifts inside. The 1% figure is a ceiling he touches on some trades, not a normal setting.
2. The stop is the low of the day on longs, the high of the day on shorts. Always inside the day’s range, which is what prevents any single trade producing a large loss.
3. If the low of the day is further away than one average daily true range, he does not take the trade. He will not widen the stop and he will not move it closer. The trade is simply skipped.
4. Take partial profit in the first three to five days, move the stop on the remainder to breakeven, then trail with a close below the 10-day or 20-day moving average. Which of the two depends on how extended the stock is.
Rule three is the one worth stealing, and almost nobody copies it because it looks like a technicality. It is not a stop-placement rule at all. It is a trade filter. The stop location is fixed by the chart, so the only variable left is whether the trade qualifies, and the average daily true range decides that. A setup that requires more room than the stock’s normal daily movement is not a worse trade to be managed carefully. It is not a trade.
Most retail risk education works the other way around: pick the position size, then find a stop that fits it. Kullamägi fixes the stop, fixes the risk, and lets those two constraints delete the trade if the arithmetic does not work. Our position sizing guide covers the mechanics; this is the filter that sits in front of them.
On leverage he is more relaxed than the rules above suggest. When things are going well he uses margin at least half the time, but he never moves from all cash to fully margined in one step, and describes the transition as taking weeks or months. He has no hard daily loss limit. If the day is going badly he gets fed up and walks away from the computer, which he freely admits is a feeling rather than a rule.
The market filter, and the fact that he ignored it
Two of his three setups need a rising market. Breakouts and episodic pivots both depend on the fact that four out of five stocks move with the index, so taking them in a downtrend means being stopped out repeatedly. Only the parabolic short is indifferent to market direction.
His filter is deliberately simple. When the 10-day moving average is above the 20-day and both are rising, the market is in an uptrend and he takes long setups. When the 10-day crosses below the 20-day, that is a signal for caution. He does not claim it is precise. His own assessment is that it keeps him out of bad markets around 80% of the time and in good markets around 80% of the time, which is a more honest description of a filter than most people manage.
Bonde and others use breadth-based models instead. Kullamägi does not follow daily breadth, though he notices the extremes, which happen a handful of times a year.
Hold that rule in mind, because the next section is entirely about what happened when he stopped obeying it.
The $105 million that lasted a few days
He started 2020 with $3.5 million and finished it at $36 million. Covid produced the conditions his method is built for, and he took them from both sides. The mask manufacturers APT and LAKE formed classic episodic pivots in late February as awareness spread, micro-caps suddenly trading hundreds of millions of dollars a day. He bought them and they rose hundreds of percent in about a week. He then caught the same names on the short side the following week as they came back down. He traded many of the smaller vaccine names on the long side and held Tesla through its move. He describes it as a year where all three setups fired repeatedly.
Then $36 million became $105 million, and the last $40 million of that arrived in roughly six weeks.
He is unsparing about what that did to him. Being over $100 million made him feel completely detached from reality. He convinced himself he would reach $200 million within six months and was certain of it. Trading had turned into a video game he kept winning.
The exposure tells the same story in a number. At the peak he was leveraged long to the tune of $150 million, a figure he remembers precisely because he remembers bragging about it to a friend.
The market topped near the end of 2021. His own trend indicator turned. He ignored it, came into December 2021 aggressive, and stayed aggressive through a downtrending 2022, buying breakouts and episodic pivots in exactly the market condition where his own rule says not to. He knew it at the time. He kept pushing anyway.
Measured from the November 2021 peak to the mid-2022 low, he lost approximately $60 million. Around half of that was the surrender of open profits as the November positions ran back to their stops.
The structure of the loss is the part that surprises people. There was no single catastrophic trade. The initial retracement was severe because he was heavily leveraged at the top, but everything after it was an accumulation of small and mid-size losses, trade after trade, in a market that was not going to reward any of them. He had stopped taking large individual losses years earlier and never took one here.
His own counterfactual is the most quotable thing in the chapter and he offers it without prompting: if he had simply followed his own 10-day and 20-day moving average rule, he would have avoided 90% of those losses.
It took him until mid-2022 to say out loud that he was trading a bear market and had no business doing so. Nine months, by Schwager’s account, before he fully registered what he was doing.
Why the worst period followed the best one
Schwager flags this as a pattern rather than an accident, and it recurs across multiple Market Wizards interviews. Marty Schwartz reduced his trading size after unusually strong profits for the same reason he reduced it after bad losses, because his largest losses had always followed his largest gains.
Two mechanisms sit underneath it. Winning streaks breed complacency, and complacency produces sloppy execution. And a period in which everything is working is by definition a period of unusually high exposure, because nothing has been stopped out. Both were true of Kullamägi in November 2021 at $150 million long.
What he changed afterwards is specific and small. If he is heavily long and the market starts stalling, particularly if the 10-day moving average turns down, he now sizes down and gets off margin rather than waiting for the stops to do it for him. He also notes that his big drawdowns arrive after especially good runs, which is a piece of self-knowledge most traders acquire only in hindsight. The counter-example worth reading beside this is Monroe Trout, who compounded 67% a year while holding his worst drawdown to 8%, which is a completely different answer to the same problem.
2024, the yacht, and a D-minus
He was profitable again in 2023 and 2024, but the returns were moderate and he is dismissive of them. His own assessment of 2024, which he calls a five-star year full of episodic pivot opportunities, is that he was off his game and deserves a D-minus.
The reasons are not market reasons. He bought a yacht at the end of 2021 and has since spent a great deal of time travelling with his girlfriend, trading from hotel rooms and from the boat. Distraction on market days costs money in a method where the entry window is the first five minutes.
He also stopped doing the work. He keeps a database in Evernote of screenshots of episodic pivots, breakouts and parabolic shorts, and he used to scroll through the collection every month to refresh his pattern recognition. He stopped the monthly review, and found that when a trade came along he no longer had the conviction he used to have.
Super Micro Computer on 19 January 2024 is the evidence. The stock opened more than 10% higher on massive volume after a preliminary earnings release indicating revenue well above expectations. By his own description it was a picture-perfect, five-star setup of exactly the type he had traded for a decade. He saw it, had only a few minutes at the open, had other things to do, and passed on it.
The lesson he draws is not that he should have worked harder. It is that he made a choice. He asked himself whether he still wanted to spend 60 hours a week on trading and concluded that he would rather stop trading than do that, because he no longer needs the income. He still trades because he loves it, and he is trying to arrange his travelling around downtrending markets, which he admits is easier to say than to do.
“I used to live to trade, and now I trade to live.”
That line is the chapter’s title and its thesis. It is worth reading as something other than a failure, because the trade-off is real and most of the audience for this article will eventually face a version of it. He is not pretending the results did not suffer. He has simply decided what the results are for.
Two losses he still remembers
The 40% morning. In his third year of trading he shorted a micro-cap because he judged the rally overextended. It kept moving higher and he added to the short, which he says you should never do. It kept rallying, he became frightened of blowing up a fourth time, and by the time he closed the position he had lost 40% of his account in a couple of hours. He had a mental stop and ignored it. It was also day one of the rally, which is the origin of the rule he now applies without exception: never short day one.
The Kodak moment. Day two of an enormous rally in Kodak, triggered by a White House announcement that the company had reached a deal to produce critical pharmaceutical ingredients in the United States. He was watching for weakness with the cursor hovering over the sell button and clicked it by accident. The stock ran from an $18 open to a $60 high that day. It halted immediately after his error, he was only partially filled when he tried to cover, and it halted again before he could finish. The fat finger cost him $1.5 million.
The second story is the more useful one, because it is not a judgement failure at all. It is an execution risk that no amount of psychological work removes, in an instrument where a halt can trap you between the mistake and the fix.
What actually transfers to a small account
Most of what makes Kullamägi work is not copyable. Ten years of 60 to 80 hour weeks, a decade of chart study, and a tolerance for volatility that Coyle points out is genuinely unusual: episodic pivots and parabolic shorts both mean deliberately trading instruments moving hundreds or thousands of percent, which is precisely where most professionals are told not to go.
Four things do transfer, and they are all rules rather than patterns.
The average daily true range filter. Fix your stop by structure, then test whether the distance is larger than the instrument normally moves in a day. If it is, skip the trade. This single rule does more for a small account than any setup, because it removes the trades that force bad sizing.
The regime filter. Two 10-day and 20-day moving averages on the index, checked before you look at anything else. It is crude and he says so. It is also the rule whose abandonment cost him $60 million.
Verify the setup yourself before you trade it. He is emphatic that you cannot borrow someone else’s setup, because without having done the research you will have no conviction and will panic the moment it goes against you. His recommendation for the reps is William O’Neil’s How to Make Money in Stocks, which contains charts of winning stocks going back to the early 1900s, and his standard is hundreds or thousands of examples of a pattern before you trade it. A backtest is the systematic version of the same exercise, but his point is about conviction rather than statistics: research you have not done yourself will not hold you in a position when it starts moving against you.
The monthly chart review. He keeps a screenshot database and reviews it monthly, and his results deteriorated when he stopped. One caveat worth naming: he only saves the setups that worked, deliberately, because he sees no value in studying a failed setup. That is a defensible choice for pattern recognition and a poor one for a trading journal, where the losers carry most of the information. A record that keeps only the wins is a pattern library, not a journal, and the losers are where most of the information lives.
The Kullamägi pre-trade test
- Is the general market in an uptrend by the 10-day and 20-day rule? If not, no long setups.
- Is this stock in the top 1% to 2% of movers over one, three and six months, or is it gapping on real news with a volume explosion?
- Where is the low of the day, and is it further away than one average daily true range? If yes, skip.
- What is the risk in currency terms, and is it 0.5% or less of the account?
- Have I personally verified this setup across hundreds of historical examples, or am I borrowing someone else’s conviction?
- Am I taking this because it meets my conditions, or because I have not had a trade in a while?
- Am I coming off an unusually good run, and should I therefore be smaller rather than larger?
Question seven is the one his own record argues for most strongly, and it is the opposite of what almost every trader does after a winning streak.
Free research sheet
Kristjan Kullamägi: The Complete Research Sheet
Six pages covering the career timeline, the three setups with their exact entry and stop conditions, the risk rules, the 2022 collapse in sequence, the expectancy arithmetic behind a 27% win rate, and the seven-question pre-trade test as a printable checklist.
The counterweight
Five things belong next to the record.
The figures are published, not audited by us. They come from Chapter 1, where Schwager and Coyle describe reviewing his statements and returns. That process is serious and we have no reason to doubt it, but Complete Trader’s Edge has not seen the underlying account statements and does not present them as independently certified.
The method is regime-dependent and he says so. Two of the three setups need a rising market. In a downtrend they do not merely underperform, they get stopped out repeatedly and, in his own words, will destroy an account. Anyone adopting the setups is adopting a bull-market engine and needs the filter that comes with it.
The volatility tolerance is not a detail. Coyle makes the point that Kullamägi’s returns came from deliberately playing in exactly the instruments most traders are warned away from, and that this suits his temperament rather than everyone’s. Coyle says plainly that the parabolic short does not fit his own personality and that he could not simply adopt it. That is the honest version of what “find what fits you” means.
The rules are free and the results are not reproducible. Tens of thousands of traders run these setups. The edge was never in the rules, which he publishes, and never in an indicator, which he does not have. It was in the chart reps, a decade of 60 to 80 hour weeks, and a market regime that rewarded high-beta momentum. His own advice to aspiring traders begins with telling them not to do it.
His public teaching differs in detail from the chapter. Several figures that circulate widely online, including consolidation lengths of two to eight weeks and a 50-day moving average condition, do not appear in his interview, where the consolidations are one to three weeks and the moving averages that matter are the 10-day and 20-day. Where the two disagree we have used the chapter, and where a rule comes from his public material we have said so.
Kullamägi against the other Next Generation traders
| Kristjan Kullamägi | Kelvin Chiu | Lance Breitstein | |
|---|---|---|---|
| Arena | US momentum stocks, small and mid-cap | Grain and oilseed spreads, later multi-market | Prop, discretionary |
| Edge | Three setups plus a hard risk filter | Bounded-downside structures | Process and relentless review |
| Origin failure | Three blown accounts in two years | $10m concave spread, 2016 | Early struggle before systemisation |
| Worst episode | $60m lost in eight months by ignoring his own market filter | Right on the thesis, nearly destroyed by the path | Walked away from more money |
| What fixed it | Sizing down after good runs, getting off margin earlier | Cognitive behavioural therapy and a rule against concave shapes | Systematised review |
| What a small account can copy | The ADTR filter and the regime rule | The nine questions and the shape test | The review habit |
The three of them converge on the same conclusion from completely different markets: the constraint is not finding trades, it is refusing the ones that do not qualify and staying flat in between. Breitstein, in the following chapter, made the identical journey from day trading to longer holds that Kullamägi did, and for the same reason.
The nine traders in Market Wizards: The Next Generation
- Kristjan Kullamägi
- Lance Breitstein
- Simon Russo
- Lukas Fröhlich
- Phil Goedeker
- Kelvin Chiu
- Jason Berry
- Kenny Sharkness
- Rick Bandazian Jr.
Profiles for the remaining traders are in production. Our full review of the book covers the cohort, the lessons that carry across all nine, and where the book falls short.
Mind, Method, Money
How Kullamägi maps to the three pillars
Mind. The method never broke. What broke was his willingness to obey it after a run that made him feel invincible, and it took nine months to notice. His stated remedy is not more discipline in the abstract but a specific behavioural rule: get smaller after unusually good performance, because that is when the exposure and the complacency are both at their highest.
Method. Three setups, taken from other people, verified across thousands of historical charts, and deliberately never expanded to four. Every one of them is defined precisely enough to say when it does not apply, which is Schwager’s actual test of whether you have a methodology at all.
Money. Half a percent per trade, a stop inside the day’s range, and a filter that deletes any trade needing more room than the stock normally moves in a day. That architecture is why a decade of mostly losing trades still compounded, and why the 2022 loss was an accumulation of small ones rather than a single hole.
The line that ties it together: he built a method simple enough that its failure could only ever be his own, and then proved that in the most expensive way available.
Frequently asked questions
Who is Qullamaggie?
Qullamaggie is the online name of Kristjan Kullamägi, a Sweden-based momentum swing trader. He began trading in spring 2011 after a summer job as a security guard at the Nasdaq Stockholm building, blew up three accounts before becoming profitable on his fourth attempt, and grew a stake of about $5,000 into a $105 million account by November 2021. He is the opening chapter of Market Wizards: The Next Generation (2026).
How much money did Kristjan Kullamägi actually make?
His equity peaked at $105 million in November 2021, up from $3.5 million at the start of 2020 and $36 million at the end of it. He then lost approximately $60 million from that peak to the mid-2022 low. The figures are reported in the book by Schwager and Coyle, who reviewed his statements; we have not independently audited them.
What are the three Qullamaggie setups?
The episodic pivot (a stock gapping sharply higher on major news with a huge volume increase), the breakout (a leading stock breaking out of a one to three week consolidation, held three to five days), and the parabolic short (shorting a small-cap that is up at least 300% over three or four consecutive days once weakness appears). He learned the first two from Pradeep Bonde of Stockbee and credits him openly.
What is his win rate?
He estimates 25% to 30%, a figure he only calculated because followers kept asking. Schwager argues the statistic is close to meaningless on its own, and that what matters is expected gain per trade. At a 27% win rate with losses capped at 1R, the average winner has to be worth more than about 2.7R before the method makes any money at all.
What is the ADTR rule?
His stop sits at the low of the day on a long. If that low is further below the current price than one average daily true range, he does not take the trade rather than widening or tightening the stop. It is a trade filter, not a stop-placement rule, and it is the single most transferable thing in his method.
How much does Kullamägi risk per trade?
Typically 0.5% of the account or less, with a maximum of 1% on some trades. The combination of that sizing and a stop inside the day’s range is what caps the damage from any single position, and it is why his worst year was an accumulation of small losses rather than one catastrophic trade.
What happened to Kullamägi in 2022?
He was heavily leveraged long at the November 2021 top, with $150 million of long exposure against a $105 million account. When the market turned, open profits ran back to their stops. He then ignored his own 10-day and 20-day moving average filter and continued taking breakouts and episodic pivots through a downtrending market for months. By his own estimate, following that one rule would have avoided 90% of the losses.
Does Qullamaggie sell a course or signals?
No. He live-streamed his sessions from 2019 to 2022 without ever charging, and says he could easily have sold a subscription to thousands of people and did not want to. He never disclosed his trades in real time on stream and only ever shared his charting platform, deliberately, so that nobody could follow him blindly into a position.
Can a retail trader copy Kristjan Kullamägi?
The rules, yes. The results, almost certainly not. The setups are public, but the edge came from a decade of 60 to 80 hour weeks, thousands of hours of chart study, a tolerance for extreme volatility that he acknowledges is unusual, and a market regime that rewarded high-beta momentum. His own first piece of advice to aspiring traders is not to do it.
Which Market Wizards book is he in?
Market Wizards: The Next Generation (2026) by Jack Schwager and George Coyle, Chapter 1, titled “From Living to Trade to Trading to Live”. See our full review of the book.
Sources and further reading
- Jack Schwager and George Coyle, Market Wizards: The Next Generation (Harriman House, 2026), Chapter 1, including Coyle’s and Schwager’s closing notes
- Pradeep Bonde, Stockbee, for the original episodic pivot and momentum burst concepts that Kullamägi credits
- William O’Neil, How to Make Money in Stocks, the chart study resource he recommends
- Jack Schwager, The Little Book of Market Wizards, for the pattern of large drawdowns following peak performance
Continue Learning
- Market Wizards: The Next Generation Book Review (2026)
- Kelvin Chiu: The Commodities Trader Who Made Asymmetry His Edge
- Lance Breitstein: $46 Million at Trillium, $71 Million on His Own
- Market Wizards vs The Next Generation: Which to Read First
- Jesse Livermore: The Greatest Speculator
- Position Sizing: The Complete Guide
- The Three Pillars: Mind, Method, Money
- The Complete Trader’s Edge — The Book
 The Complete Trader's Edge
The full Mind · Method · Money framework. 70 chapters.
View on Amazon →
 Market Mayhem
400 years of bubbles, crashes, and the pattern that keeps repeating.
Buy on Amazon →
 Greatest Companies
How the world's greatest companies were built — and what traders learn from them.
View on Amazon →
 Greatest Traders
Eighty-six lives that explain the markets — Livermore to Madoff, told with the losses left in.
View on Amazon →