Every trading strategy, no matter how well designed, goes through periods of drawdown. The question is not whether your account will experience a drawdown. It is whether you have a system in place to manage it without destroying your capital or your psychology. Professional traders treat drawdown management as one of the most important systems in their trading business.
The traders who survive drawdowns are not the ones with the best strategies. They are the ones who planned for the drawdown before it arrived. This article gives you the complete system: how to set your maximum drawdown, how to respond at each level, how to diagnose what caused it, and how to recover without making things worse.
The Mathematics: Why Drawdown Recovery Is Non-Linear

Drawdown recovery is asymmetric. A 10% loss requires an 11% gain to recover. A 20% loss requires 25%. A 50% loss requires 100%. This non-linearity is why capital preservation is the first priority in professional trading, exactly as Paul Tudor Jones preaches with “defence over offence.” Every percentage of additional drawdown makes recovery disproportionately harder.
Setting Your Maximum Drawdown
Before you trade a strategy live, you must know, from backtesting, what the maximum historical drawdown has been. This is the largest peak-to-trough decline the strategy experienced in the test period. Your live drawdown limit should be 1.5x to 2x this historical maximum.
For example, if your backtest showed a maximum drawdown of 8%, set your live limit at 12% to 16%. This gives the strategy room to behave consistently with its historical parameters without triggering a premature shutdown, while providing a hard ceiling that protects your account from catastrophic loss.
The Tiered Response System
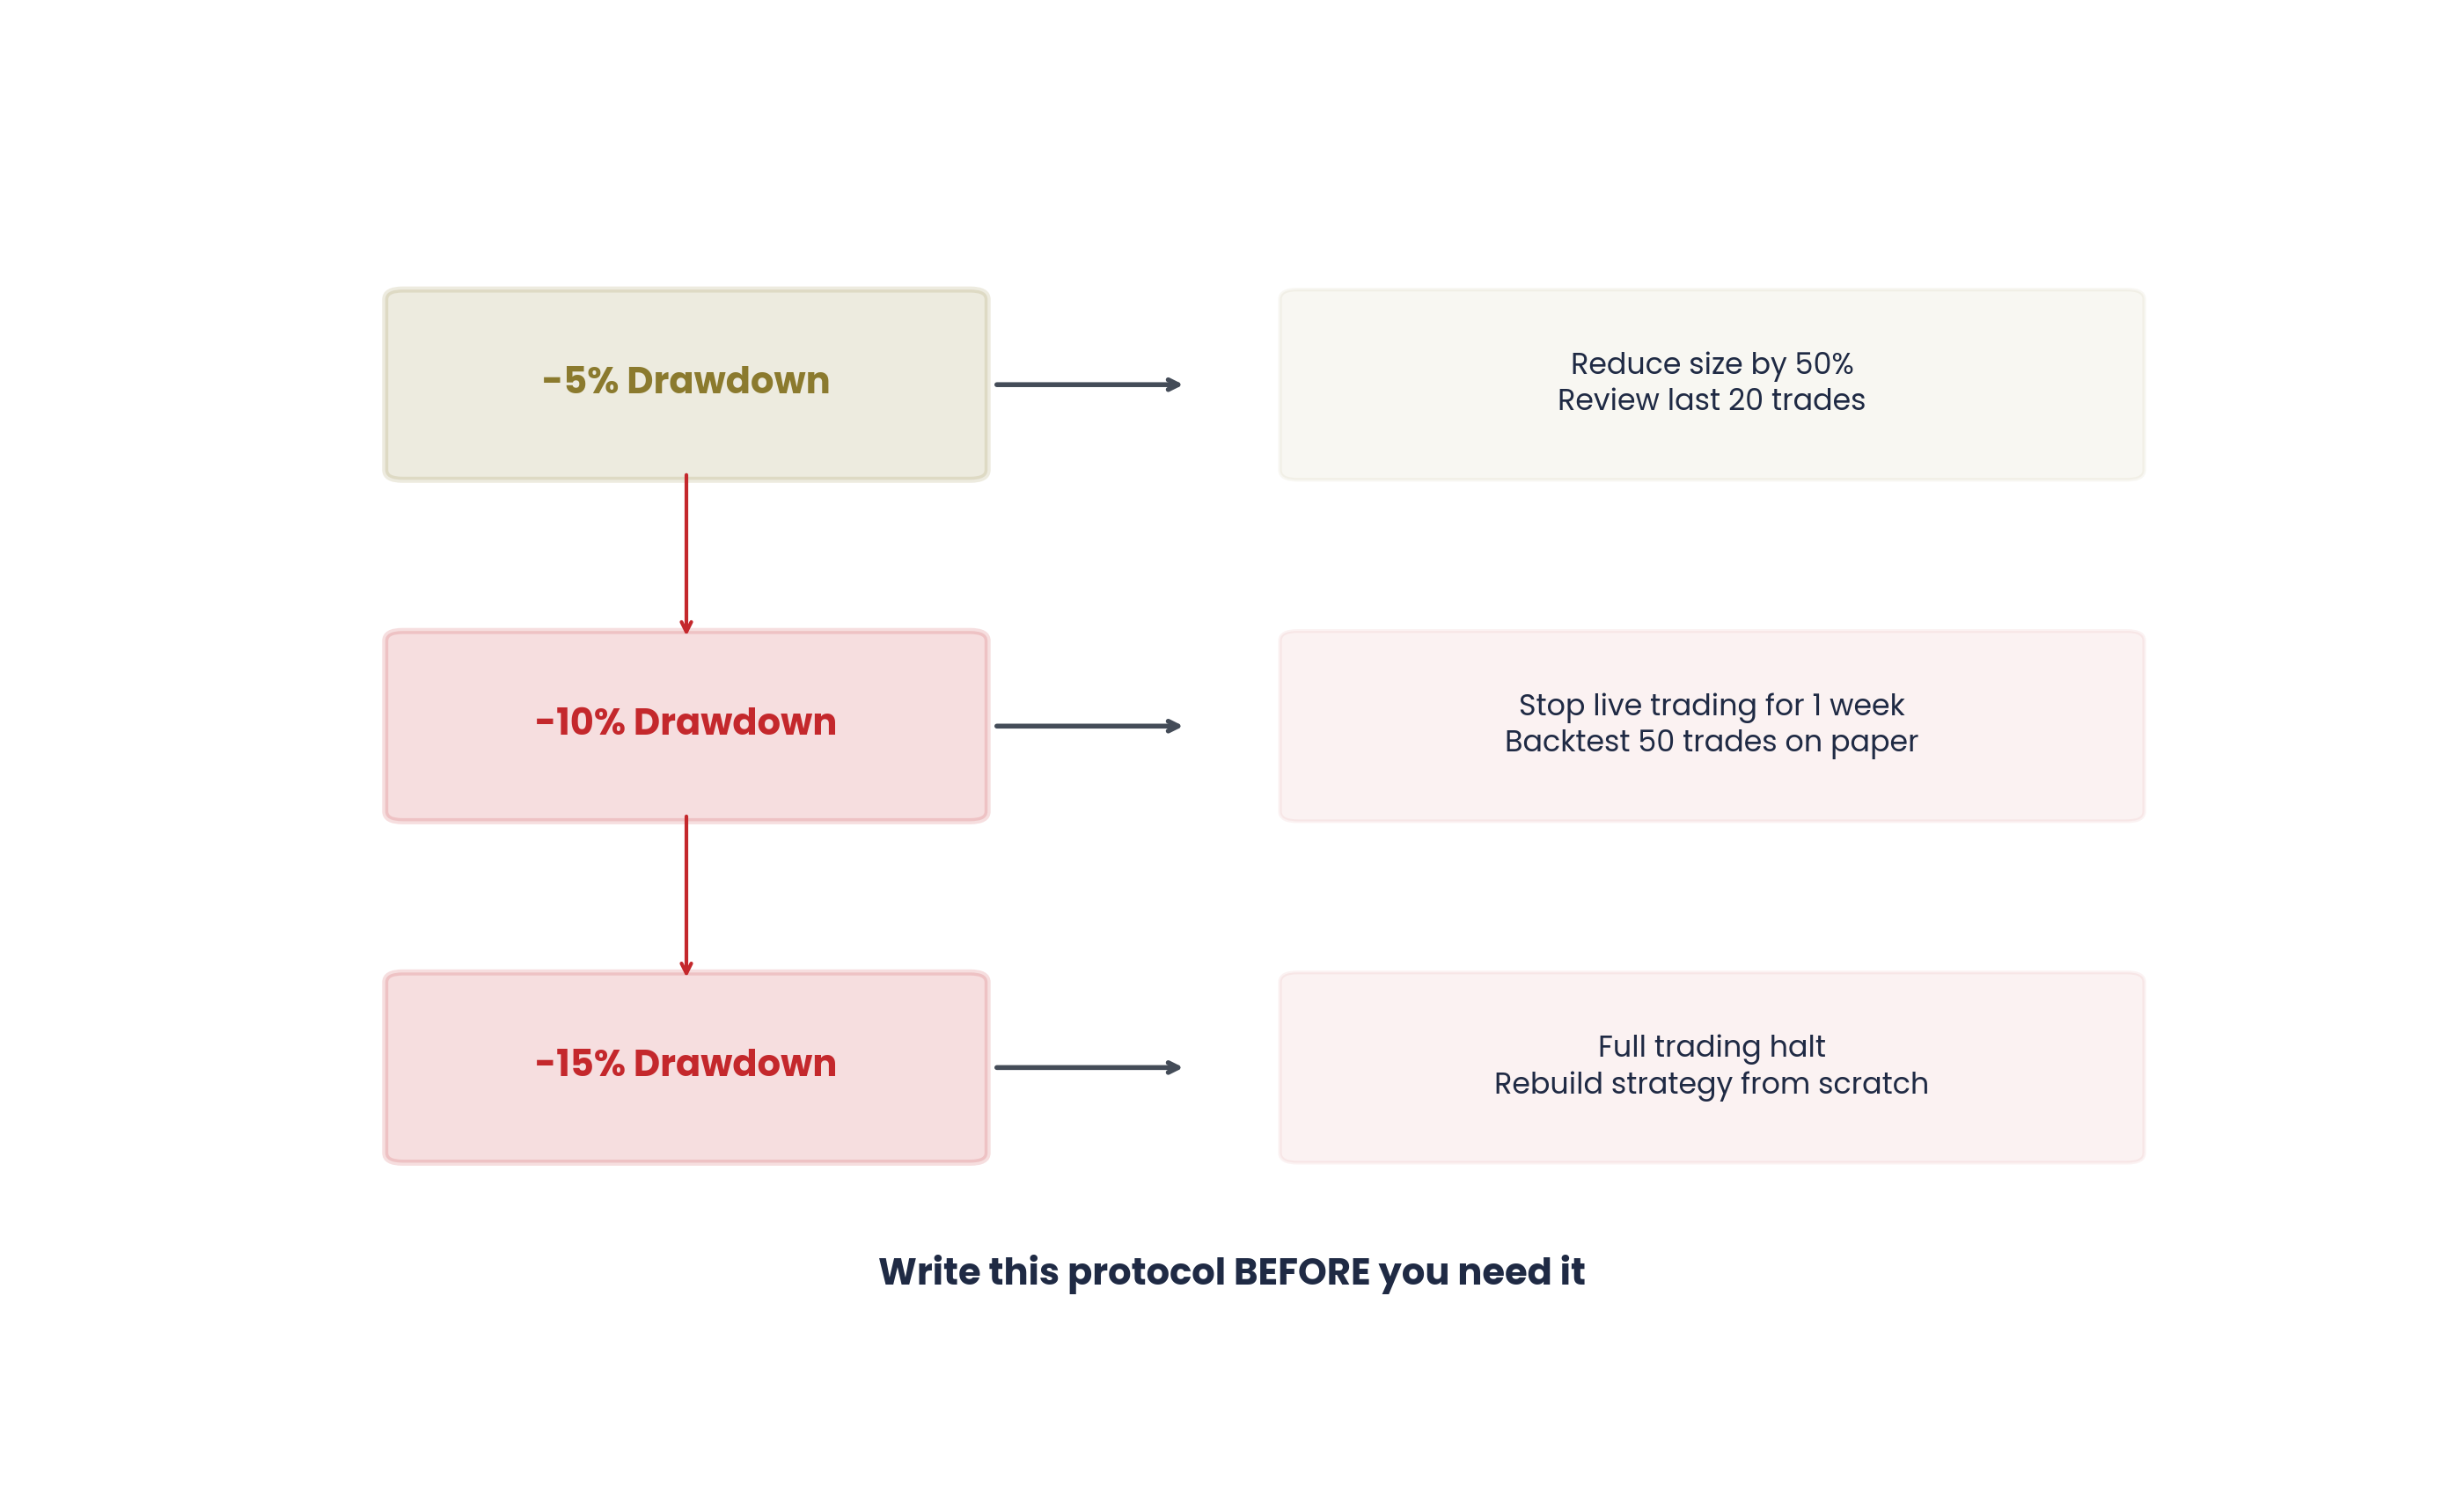
Rather than a binary “trading/not trading” approach, professional drawdown management uses a tiered system with pre-defined actions at each level.
| Drawdown Level | Position Size | Actions |
|---|---|---|
| 0-3% (normal variance) | 100% normal size | Continue trading. Review last 10 trades in journal. Check process adherence. |
| 3-5% (caution zone) | 75% of normal | Reduce size. Increase structure: mandatory checklist, no marginal setups. Only A-grade trades. |
| 5-10% (danger zone) | 50% of normal | Half size. Full day off to review journal data. Identify whether it is variance, market regime, or execution. |
| 10%+ (maximum drawdown) | 0% (stop trading) | Full stop. Move to demo for minimum 1 week. Complete formal review. Return at 25% size. |
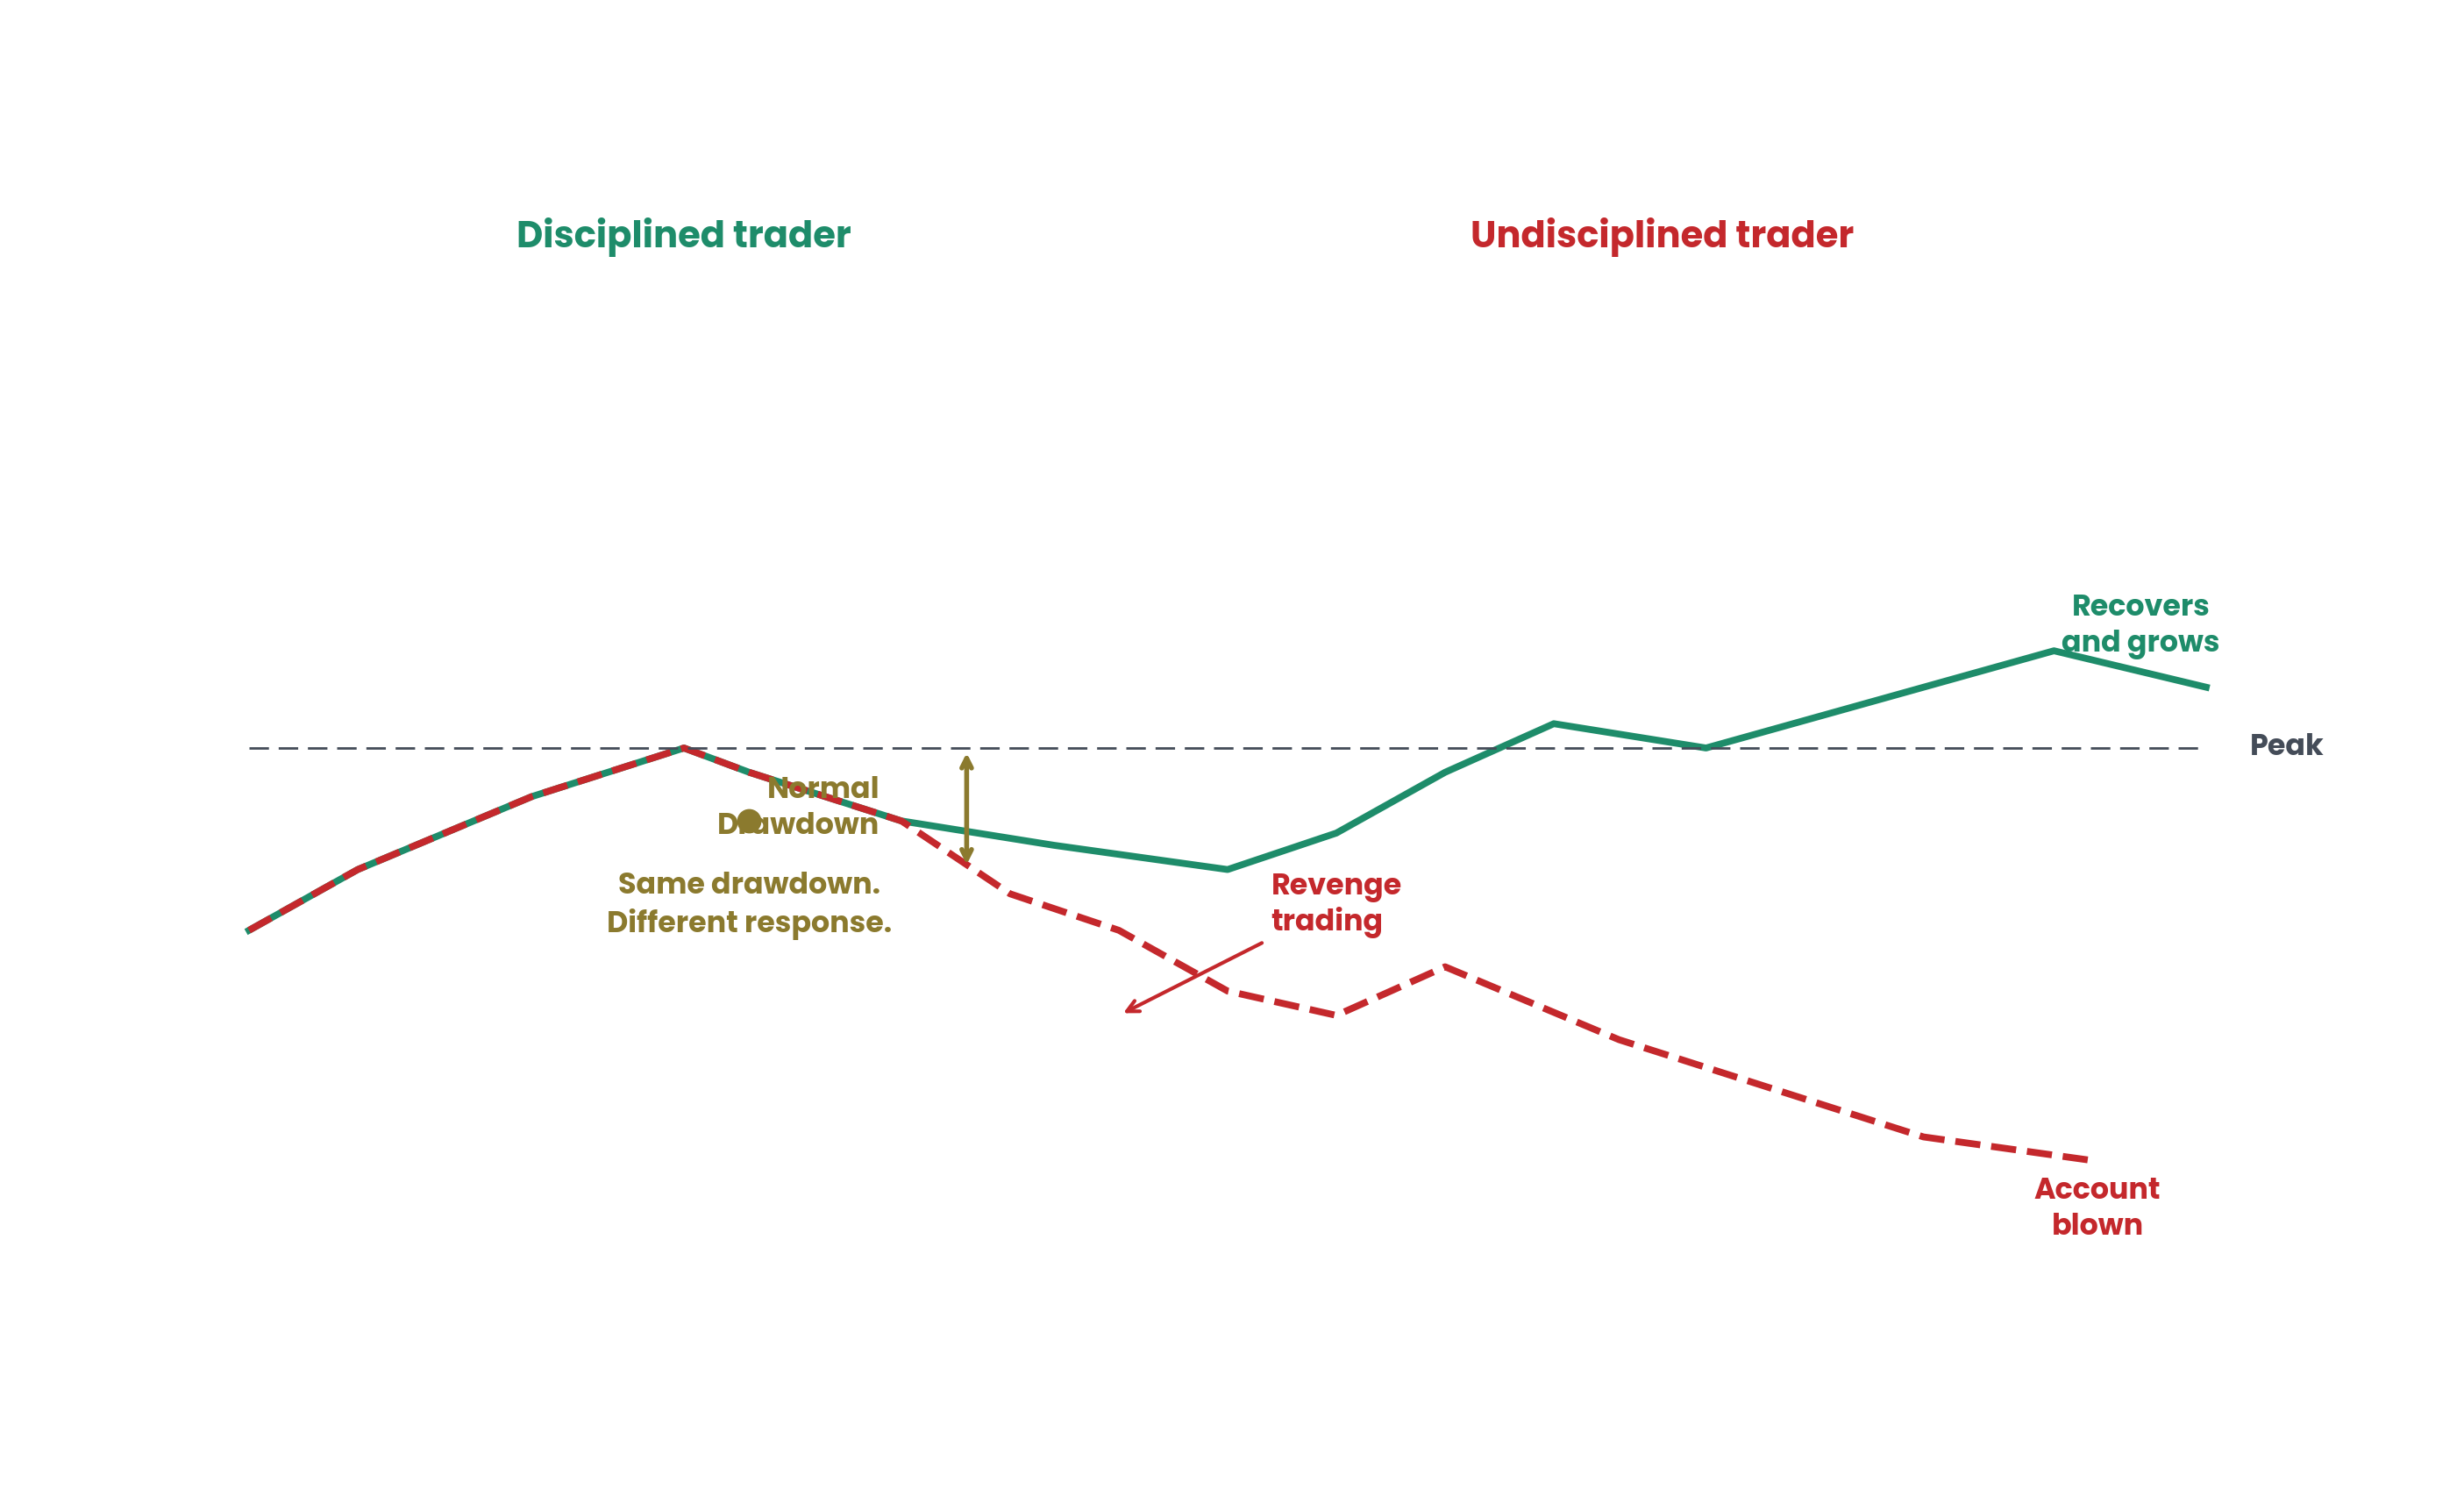
This gradual response serves two purposes: it reduces the rate of further drawdown automatically as losses mount, and it reduces emotional pressure at precisely the moment when fear and revenge impulses are most dangerous.
The Three Causes of Drawdown
Not all drawdowns are the same. Diagnosing the cause determines the correct response.
Cause 1: Normal variance. Your process is clean, you followed every rule, and the losses are within the expected range from your backtest. This is the most common cause and requires no strategic changes. Continue at reduced size and let the probability play out.
Cause 2: Market regime change. The market has shifted from trending to ranging (or vice versa), and your strategy is not designed for the current conditions. Your journal should show setups forming correctly but not following through. The correct response is to reduce exposure and wait for conditions that match your strategy, not to change the strategy.
Cause 3: Execution breakdown. Your journal shows off-plan entries, overtrading, moved stops, and rule violations. The strategy is not failing. You are failing to execute it. The correct response is to return to demo until process quality is restored, because increasing discipline under drawdown pressure is nearly impossible. You need to reset the execution habits in a lower-stakes environment.
Returning to Full Size
After a drawdown and review, return to trading at minimum size (25% of normal) and scale back up only as performance confirms the edge is working again. A practical scaling schedule: trade 25% size for 10 trades, then 50% for 10 more, then 75%, then full size. Total recovery period: roughly 40 trades.
Do not rush back to full size. The psychological cost of another drawdown immediately after returning is disproportionately high. It triggers a compounding confidence collapse that can take months to recover from. Patience during the recovery phase is an investment in long-term sustainability.
Key Lessons
- Know your strategy’s historical maximum drawdown before trading live. It will happen again.
- Drawdown recovery is non-linear: deeper drawdowns require disproportionately larger gains to recover.
- A tiered response system automatically reduces exposure as drawdown deepens.
- Diagnose the cause: normal variance, market regime change, or execution breakdown. Each requires a different response.
- Return to full size gradually after a drawdown. Confirm the edge is working before scaling up.
Frequently Asked Questions
What is a normal drawdown for a profitable strategy?
Most profitable trading strategies experience drawdowns of 10% to 20% at some point during any 12-month period. A strategy risking 1% per trade with a 50% win rate and 1:2 R:R will regularly produce 5 to 8 consecutive losses, creating a 5% to 8% drawdown. This is completely normal variance, not strategy failure. If your maximum drawdown from backtesting was 12%, expect to see similar or slightly larger drawdowns in live trading.
Should I change my strategy during a drawdown?
Almost never during the drawdown itself. Strategy changes made under emotional pressure are almost always regression. The correct sequence is: survive the drawdown with your tiered protocol, review the data calmly when it is over, then decide whether structural adjustment is warranted based on evidence. The exception is a clear market regime change that your journal data confirms, in which case reducing exposure and waiting is the correct response.
How do prop firms handle drawdowns differently?
Prop firms impose hard drawdown limits (typically 5% daily, 10% total) that are non-negotiable. Breaching them means losing the funded account. This makes the tiered response system even more critical. Many successful funded traders set their personal drawdown limits at half the firm’s limit (2.5% daily, 5% total) to give themselves a safety buffer. They treat the firm’s limit as the absolute emergency line and their own limit as the operational ceiling.
What if my drawdown is caused by one big loss rather than many small losses?
A single large loss suggests a position sizing or stop loss failure, not a strategy failure. Common causes: a stop that was not in place (or was removed), a gap event where the stop could not execute at the planned price, or correlated positions that amplified a single adverse move. The fix is mechanical: verify every trade has a hard stop, account for gap risk, and monitor correlation across simultaneous positions.
How do I stay mentally healthy during a drawdown?
Maintain your full routine even during drawdowns. Pre-session preparation, in-session discipline, and post-session journalling are more important during hard periods, not less. Physical exercise helps regulate stress hormones. Talking to a trading peer or mentor provides perspective. And reducing size is not just a financial protection: it is a psychological one. Smaller losses feel more manageable, which preserves the mental clarity you need to execute well.
Continue Reading
▶ The Psychology of Losing: How to Process Drawdowns
From The Book
This article covers concepts from Chapter 59 of The Complete Trader’s Edge.
 The Complete Trader's Edge
The full Mind · Method · Money framework. 70 chapters.
View on Amazon →
The Complete Trader's Edge
The full Mind · Method · Money framework. 70 chapters.
View on Amazon →
 Market Mayhem
400 years of bubbles, crashes, and the pattern that keeps repeating.
Buy on Amazon →
Market Mayhem
400 years of bubbles, crashes, and the pattern that keeps repeating.
Buy on Amazon →