RSI, MACD, EMAs, divergences, ATR, and Bollinger Bands — what they measure, when they help, and why price action comes first.
Every indicator you will ever use is derived from price. Moving averages smooth price. RSI measures the speed of price changes. MACD tracks the relationship between two moving averages of price. Bollinger Bands measure how far price has deviated from its average. They are all looking at the same data you already have on your chart — they just present it differently.
| Indicator | What It Measures | Best Use | Limitation |
|---|---|---|---|
| RSI (14) | Speed and magnitude of price changes (momentum) | Divergence signals, overbought/oversold in ranges | Stays overbought/oversold for extended periods in trends. Lagging. |
| MACD | Relationship between two EMAs (momentum + trend) | Trend direction confirmation, crossover signals | Slow to react. Crossovers lag the actual turn by several bars. |
| 50 EMA | Medium-term trend direction (dynamic S/R) | Trend filter. Price above = bullish bias. Below = bearish. | Whipsaws in ranging markets. Not a standalone entry signal. |
| 200 EMA | Long-term trend direction (institutional benchmark) | Macro directional filter. Institutional traders reference this. | Very slow. Not useful for timing entries or exits. |
| ATR (14) | Average True Range (volatility) | Stop loss calibration. Position sizing. Volatility filters. | Does not indicate direction. Purely a volatility measure. |
| Bollinger Bands | Price relative to standard deviation of a moving average | Mean reversion entries. Volatility squeeze identification. | Bands expand during trends, giving false mean-reversion signals. |
This matters because it means indicators cannot predict anything that price itself does not already contain. They describe. They confirm. They quantify. But they do not lead. Price leads. Everything else follows.
That said, used correctly, indicators add genuine value. They quantify momentum shifts that are hard to see visually. They provide objective readings in situations where price action is ambiguous. And they create a shared language — when RSI hits 70, every trader in the world sees the same number, which makes those levels self-fulfilling to a degree.
Moving Averages
SMA vs EMA
The Simple Moving Average (SMA) weights all periods equally. The Exponential Moving Average (EMA) gives more weight to recent prices. Most professional traders prefer EMAs for shorter timeframes and SMAs for longer timeframes where the smoothing effect is desirable. The difference is marginal in practice — what matters more is the period you choose and the consistency of your approach.
The 20/50/200 Framework
Three moving averages cover almost everything you need. The 20-period EMA tracks short-term momentum. The 50-period EMA represents medium-term trend — institutional traders frequently use it as dynamic support/resistance. The 200-period SMA is the long-term benchmark that defines the secular trend direction.
When price is above all three, the trend is strongly bullish. When price is below all three, the trend is strongly bearish. When price is between the 20 and 50, or between the 50 and 200, the market is in transition — these are the zones where most whipsaws occur.
Moving averages also act as dynamic support and resistance. In a healthy uptrend, pullbacks to the 20 EMA tend to find buyers. In a weakening uptrend, price starts spending more time below the 20 EMA and testing the 50 EMA. This progression gives you an early warning that momentum is shifting.
RSI (Relative Strength Index)
RSI measures the speed and magnitude of recent price changes on a scale from 0 to 100. The standard period is 14. Readings above 70 indicate overbought conditions. Readings below 30 indicate oversold.
The most important thing to understand about RSI is that overbought does not mean sell, and oversold does not mean buy. In a strong uptrend, RSI can stay above 70 for extended periods. RSI is most useful in ranging markets, where overbought and oversold readings reliably mark the extremes of the range.
RSI Divergence
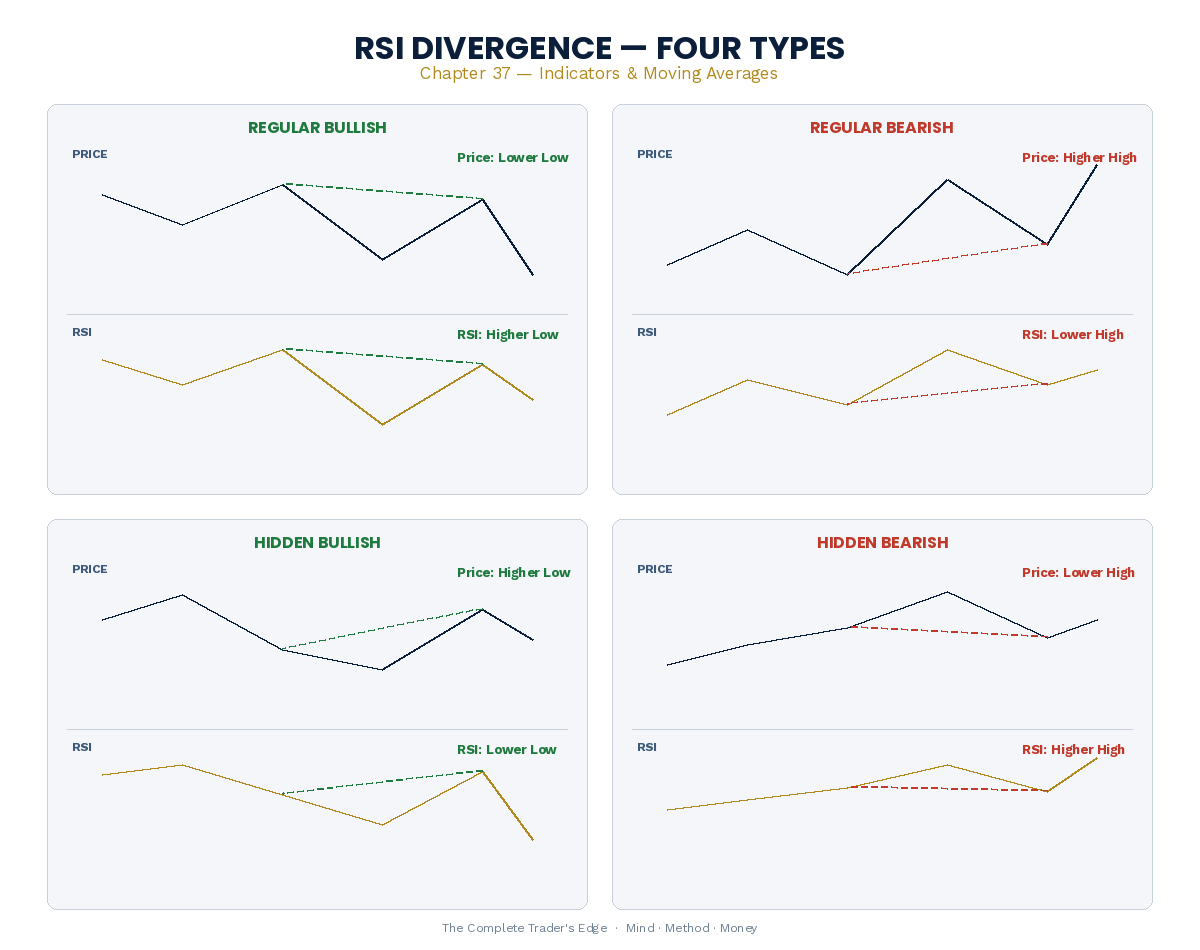
Divergence occurs when price and RSI disagree. Regular bullish divergence: price makes a lower low, but RSI makes a higher low — sellers are losing steam. Regular bearish divergence: price makes a higher high, but RSI makes a lower high — momentum is fading.
Hidden divergence signals trend continuation. Hidden bullish divergence: price makes a higher low, but RSI makes a lower low. The trend is intact but RSI has reset, creating a fresh buying opportunity.
Divergence tells you that momentum is shifting. Your SMC tools tell you where the level is. The combination is powerful: divergence at a key level is one of the highest-probability confirmations available.
MACD (Moving Average Convergence Divergence)
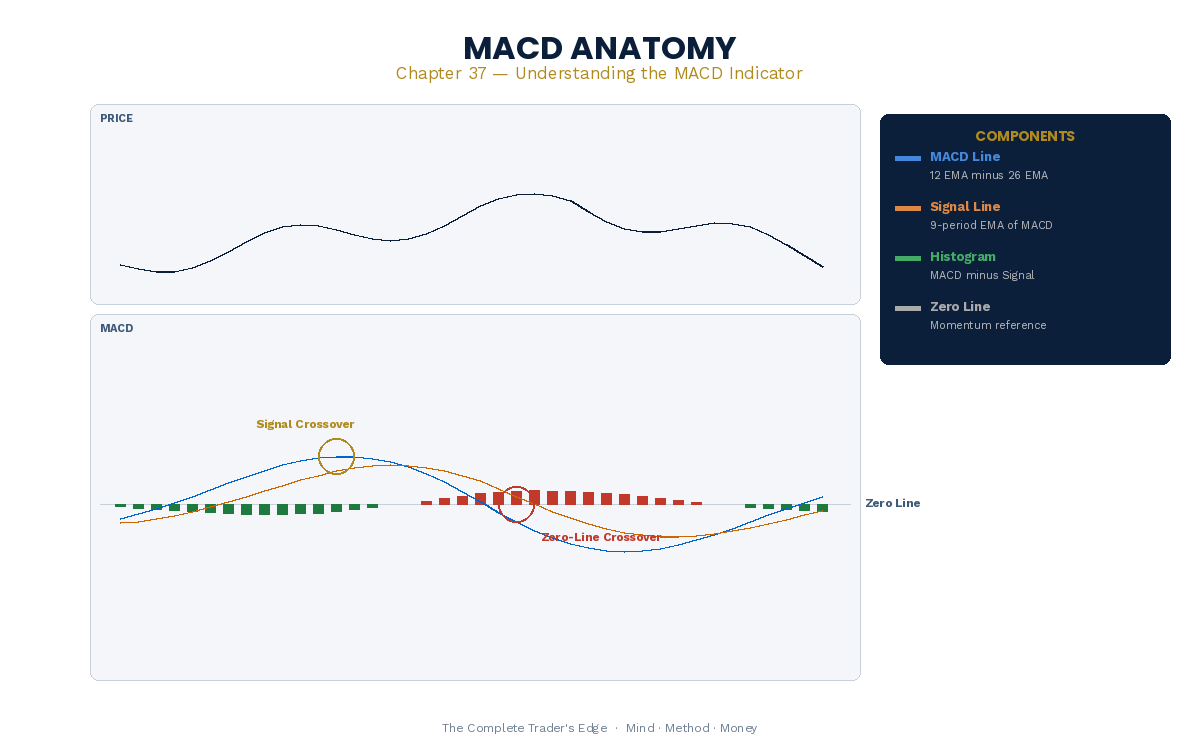
MACD measures the relationship between two exponential moving averages — typically the 12 EMA and the 26 EMA. The MACD line is the difference between them. The signal line is a 9-period EMA of the MACD line. The histogram visualises the gap between them.
When the MACD line crosses above the signal line, momentum is shifting bullish. The histogram shows the strength of that momentum — growing bars mean increasing momentum, shrinking bars mean fading momentum. The zero line is equilibrium — above zero means the short-term trend is bullish.
ATR (Average True Range)
ATR does not measure direction. It measures volatility — how much price moves per period, regardless of direction. ATR is most valuable as a stop loss and position sizing tool. Rather than placing your stop a fixed number of pips from your entry, you place it a multiple of ATR away (commonly 1.5x ATR). This means your stop automatically widens in volatile markets and tightens in quiet markets.
Bollinger Bands
Bollinger Bands consist of a 20-period SMA in the middle and two bands set at two standard deviations above and below. The key concept is mean reversion — roughly 95% of all candle closes fall within two standard deviations. Bollinger Band squeezes — when the bands contract to their narrowest point — signal that a significant move is approaching, since low volatility is always followed by high volatility.
Where Indicators Genuinely Help: Confirming a Breakout
One of the better uses for an indicator is adjudicating a structural event rather than generating a signal. When price breaks out of a rectangle or a triangle, you want to know whether the move is being funded by new participation or whether it is drifting on thin flow. Volume answers that directly: contraction through the formation, expansion on the break. ATR answers a different question – whether the move is large relative to the instrument’s recent range, which matters because a breakout that is small by ATR standards is still inside the noise.
Neither indicator told you the pattern was there. The structure did that. The indicator is settling a question the structure raised, which is the role indicators do well and the role they are least often used for. The complete chart patterns guide sets out the full confirmation sequence.
Why Indicator-Only Strategies Underperform
Every indicator-based signal can be replicated by anyone with a charting platform. There is no informational edge in signals that are visible to every participant. When everyone acts on the same signal, the edge disappears. This is why indicators work best as confirmation tools rather than primary signals. Your edge comes from reading price action, understanding market structure, and identifying institutional behaviour. Indicators confirm that the setup also has momentum on its side.
Price action tells you what is happening. Structure tells you where. Indicators tell you how strong. Use them in that order, and never in reverse.
📚 Related Articles:
This article is adapted from The Complete Trader’s Edge
70 chapters covering Mind · Method · Money — the most comprehensive trading education framework available.
Frequently Asked Questions
Are indicators necessary for trading?
No. Many successful traders use price action exclusively without any indicators. Indicators are tools that can supplement your analysis, but they should never replace understanding of market structure and candlestick patterns. The blended approach in The Complete Trader’s Edge uses indicators sparingly as confirmation tools, not primary decision-makers.
What is the best indicator for beginners?
The 200 EMA (Exponential Moving Average). It provides a simple directional filter: price above the 200 EMA suggests bullish bias, below suggests bearish. It requires no interpretation or setting optimisation. Use it as a macro filter alongside your ICT analysis, not as an entry signal.
Why do some traders say indicators are useless?
Because all indicators are derived from price and are therefore lagging. By the time an indicator signals a move, price action has already shown it. This does not make indicators useless, but it means they add confirmation, not prediction. The traders who call them useless are usually price action purists who read the source data directly.
How many indicators should I use?
One to two maximum. More than two creates conflicting signals and analysis paralysis. A common effective combination: 200 EMA for trend direction + VWAP for institutional benchmark. Or Volume Profile for value areas + a single moving average for trend. Keep it simple.
Does RSI actually work?
RSI works as a supplementary tool, not as a primary signal. RSI “overbought” (above 70) does not mean “sell now.” In strong uptrends, RSI can stay overbought for weeks. RSI is most useful for identifying divergences (price makes new high but RSI makes lower high), which signal weakening momentum. Use it to confirm what market structure is already showing you, not to generate standalone signals.
From The Book
This article covers concepts from Chapter 35 of The Complete Trader’s Edge.
 The Complete Trader's Edge
The full Mind · Method · Money framework. 70 chapters.
View on Amazon →
The Complete Trader's Edge
The full Mind · Method · Money framework. 70 chapters.
View on Amazon →
 Market Mayhem
400 years of bubbles, crashes, and the pattern that keeps repeating.
Buy on Amazon →
Market Mayhem
400 years of bubbles, crashes, and the pattern that keeps repeating.
Buy on Amazon →
 Greatest Companies
How the world's greatest companies were built — and what traders learn from them.
View on Amazon →
Greatest Companies
How the world's greatest companies were built — and what traders learn from them.
View on Amazon →
 Greatest Traders
Eighty-six lives that explain the markets — Livermore to Madoff, told with the losses left in.
View on Amazon →
Greatest Traders
Eighty-six lives that explain the markets — Livermore to Madoff, told with the losses left in.
View on Amazon →