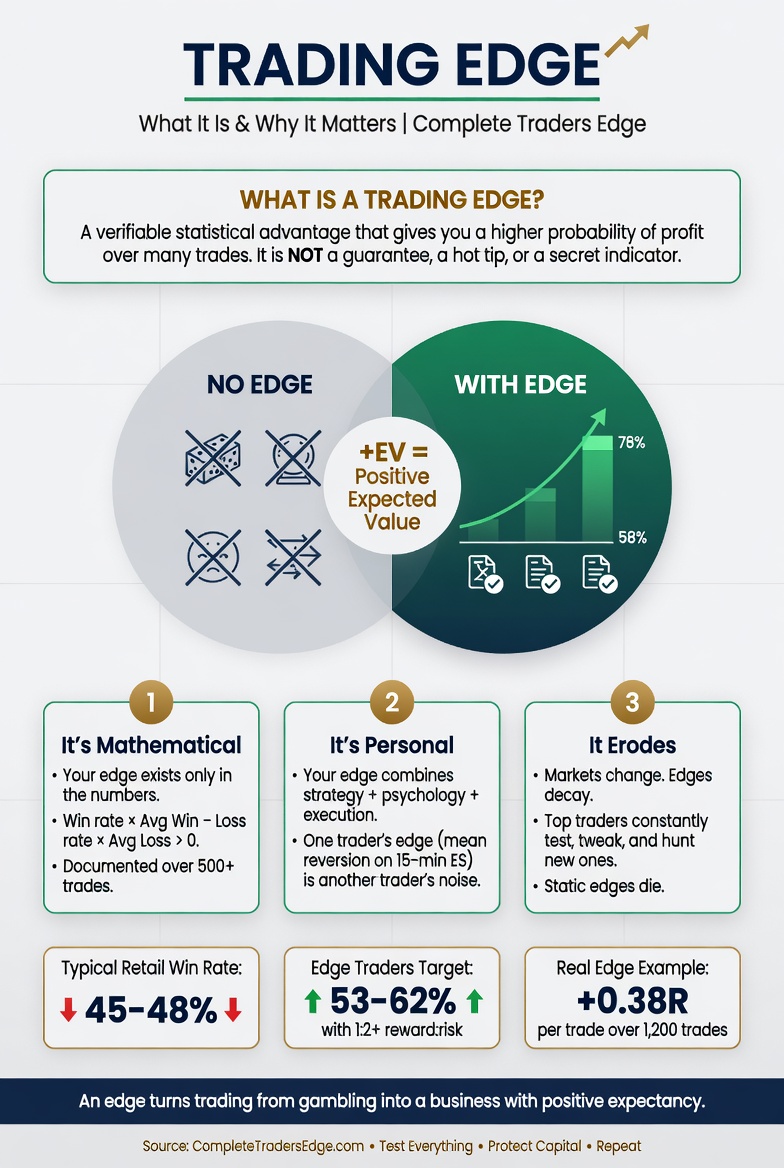
Every trader talks about edge. Very few can define what theirs actually is. They describe their strategy — “I trade Order Blocks on the 1H chart during the London session” — without recognising that a strategy is not the same thing as an edge. A strategy is the game you play. An edge is the mathematical reason why, over a large enough sample, the game is tilted in your favour.
This distinction sounds semantic. It is not. Understanding the difference between a strategy and an edge is the single most clarifying shift a developing trader can make — because it changes how you evaluate your own performance, how you respond to losing streaks, and whether you keep doing the right things long enough for the edge to prove itself.
The Casino Analogy: The Clearest Way to Understand Edge
A casino does not win because it plays better blackjack than its customers. It wins because the rules of blackjack are structured so that, over a sufficiently large sample of hands, the house collects slightly more money than it pays out. On any given hand, any player can win. Over 10,000 hands, the casino wins. This is edge — a statistical advantage that only reveals itself over a large enough sample.
The casino’s strategy is blackjack. Its edge is the built-in mathematical advantage embedded in the rules: the house hits on specific hands, pays certain odds, and benefits from players going bust before the dealer has to play. The strategy creates the framework. The edge is the mathematical property that makes that framework profitable over time.
Your trading strategy is blackjack. Your edge — if you have one — is the specific combination of win rate, average winner size, and average loser size that produces a positive expectancy over a large sample of trades. The strategy sets the rules. The edge is the measurable reason those rules produce profit.
The casino does not abandon blackjack after a table of players has a lucky night. It keeps running the game, because it knows that 1,000 nights of blackjack will produce the mathematically expected result regardless of any individual night’s outcome. This is exactly how professional traders relate to their own edge — and it is the mindset most retail traders never develop.
The Formula: What Edge Is Made Of
A trading edge has three measurable components. All three must be quantified from your actual trade data before you can claim with any confidence that your edge is real.
| Component | What it measures | Why it matters |
|---|---|---|
| Win rate | Percentage of trades that close profitably | Alone, tells you very little. Meaningful only alongside average win and loss size. |
| Average win (R) | Average size of profitable trades measured in R-multiples | A 40% win rate with 2.5R average wins beats a 70% win rate with 0.8R average wins. |
| Average loss (R) | Average size of losing trades measured in R-multiples | In a disciplined trader’s journal this should be close to 1.0R. Above 1.2R consistently indicates stop loss violations. |
Combined into the expectancy formula: (Win Rate × Average Win R) − (Loss Rate × Average Loss R)
A positive expectancy means your edge is real. A negative expectancy means it is not — regardless of how logical the strategy sounds, how many YouTube videos explain it, or how many people in a Discord group claim to be profitable using it. The number is the truth. Everything else is narrative.
Strategy vs Advantage: The Critical Distinction
Here is where most traders get lost. They assume that learning a good strategy gives them an edge. It does not — not automatically. A strategy is a set of rules about when to enter and exit markets. An edge is what happens when those rules, applied consistently over a large sample, produce positive expectancy.
The same strategy can be an edge for one trader and not an edge for another. Consider two traders using an identical FVG entry setup on Gold during the London Kill Zone:
- Trader A follows the entry checklist without exception, uses hard stop orders immediately on entry, respects the daily loss limit, and takes only trades meeting all criteria. Over 100 trades: 48% win rate, 1.9R average win, 1.0R average loss. Expectancy: +0.41R. This is an edge.
- Trader B uses the same setup but moves stops when trades go against him, exits winners early when nervous, and takes additional trades on marginal setups when bored. Over 100 trades: 52% win rate, 0.9R average win, 1.4R average loss. Expectancy: −0.20R. This is not an edge.
The strategy is identical. The edge exists for one trader and not the other. The difference is execution — which is why trading psychology and risk management are not supplementary topics to the strategy. They are what converts a strategy into an actual edge.
The Four Types of Trading Edge
Not all edges are created the same way. Understanding which type of edge your strategy is built on helps you understand when it is likely to work well and when conditions might undermine it.
| Edge type | What it exploits | Example | Durability |
|---|---|---|---|
| Structural / liquidity edge | Predictable institutional behaviour at specific price levels and times | ICT Kill Zone FVG entries, liquidity sweep reversals | High — institutional behaviour is consistent because institutions have consistent mandates |
| Statistical / pattern edge | Repeating price patterns with positive expectancy over large samples | Break and retest, Order Block reactions, FVG fills | High if the pattern reflects genuine market mechanics |
| Execution / timing edge | Trading the right instrument at the right session, with tighter entries than most participants | OTE entries within FVG during Kill Zone with defined stop placement | High — execution quality is a personal skill that compounds |
| Behavioural edge | Doing consistently what most traders cannot: following rules, managing risk, staying patient | 1% risk per trade, no revenge trading, journalling every trade | Very high — most traders never develop consistent discipline |
The strongest edges combine multiple types. A strategy that exploits institutional liquidity behaviour (structural edge), at a specific time of day (timing edge), with precise entries at a mathematically significant zone (statistical edge), executed by a trader who follows every rule without exception (behavioural edge) — this is the compound edge that produces the most durable profitability over time.
Why Most Traders Never Find Their Edge
There are four specific reasons the majority of retail traders never develop a genuine, documented edge.
Reason 1: Sample sizes are too small. A trader who takes 20 trades, experiences a losing streak, and concludes the strategy doesn’t work has made no meaningful statistical assessment. The casino does not evaluate its edge after 20 hands of blackjack. A genuine edge assessment requires a minimum of 50 trades, preferably 100 or more, under consistent conditions. Most retail traders never stay with any single approach long enough to gather meaningful data.
Reason 2: Execution destroys the edge before it can be measured. Even a genuinely positive-expectancy strategy cannot prove itself when it is executed with moved stop losses, early exits, over-trading, and marginal setups mixed in with genuine setups. The journal data produced by inconsistent execution is meaningless — it measures a blend of the strategy and the emotional reactions to it, not the strategy’s true statistical properties.
Reason 3: Conditions change without adaptation. An edge verified in a strongly trending market may not perform the same way in a choppy, range-bound environment. Traders who document an edge but then never reassess whether current market conditions still suit their strategy type discover that their edge has degraded — not because the strategy is broken, but because the market regime has shifted. Monitoring expectancy continuously, not just verifying it once, is part of maintaining an edge over time.
Reason 4: Conflating luck with skill. A trader who has 10 profitable trades in a row has not necessarily demonstrated edge. They may simply have been on the right side of a trending move that suited their approach temporarily. Edge is demonstrated over a sufficient sample that includes multiple market conditions — trending, ranging, high-volatility, and low-volatility periods. Three profitable months in a bull market is not edge. Three profitable months across different market regimes begins to suggest it.
How to Verify That Your Edge Is Real
The verification process is straightforward but requires honesty and patience.
Step 1: Define your strategy precisely. Write down every rule that governs entry, stop placement, target, and exit. The rules must be binary — either all conditions are met or they are not. Vague rules produce a strategy that cannot be consistently applied, which means the resulting trade data measures your discretion rather than the strategy’s actual statistical properties.
Step 2: Record every trade with process compliance scoring. For each trade, note whether every criterion was met before entry, whether the stop was honoured without modification, and whether the exit followed the defined rules. Score this compliance on a 1-5 scale.
Step 3: Calculate expectancy after 100 trades. Separate fully compliant trades (compliance score 4-5) from partially compliant ones (1-3). Calculate expectancy on compliant trades only. This is your strategy’s actual edge. The blended figure includes your execution errors — not useful for strategy evaluation.
Step 4: Test across market conditions. Categorise the 100 trades by market condition (trending, ranging, high volatility, news-driven). Does the edge hold across conditions, or is it concentrated in a specific environment? A strategy that only produces positive expectancy in one specific regime type is a conditional edge — valid, but requiring market condition awareness before deployment.
Step 5: Monitor continuously. Calculate your rolling 20-trade expectancy. When it drops significantly below your historical average, investigate: has compliance dropped (execution problem) or have conditions changed (market regime problem)? The answer determines the response — fix execution, or reduce size while conditions normalise.
The Mind · Method · Money Edge
The framework behind this site and the book is named after the three pillars that combine to create a complete, sustainable trading edge. Each pillar contributes a different dimension of the overall advantage:
- Mind gives you the behavioural edge — the psychological infrastructure to execute consistently, absorb losses without emotional distortion, and maintain process compliance over hundreds of trades. Without this, no strategy produces its theoretical expectancy in live trading.
- Method gives you the structural and statistical edge — the specific, defined approach to identifying where and when to enter markets with a positive-expectancy bias. This is where the strategy lives, but it only becomes an edge when combined with the other two pillars.
- Money gives you the survival edge — the position sizing, risk management, and drawdown protocol that keeps you in the game long enough for the edge to compound. A trader with a genuine edge who is reckless with position sizing will blow up before the edge has time to prove itself. Risk management is what converts a positive-expectancy strategy into actual capital growth.
An edge built on all three pillars simultaneously is the most durable available to a retail trader. It is not dependent on a single market condition, a specific instrument, or a favourable period of volatility. It is grounded in the trader’s ability to identify institutional structure (Method), execute consistently over time (Mind), and protect capital through every inevitable drawdown (Money).
Frequently Asked Questions
How do I know if I have a genuine trading edge?
The only way to know is through documented evidence from your own trading journal. A genuine edge produces a positive expectancy — calculated as (win rate × average win R) minus (loss rate × average loss R) — across a minimum of 50 to 100 trades taken under consistent conditions with high process compliance. A feeling of confidence, a profitable month, or a strategy that “makes sense” logically are not evidence of edge. Positive expectancy from your own data is the only evidence that counts.
Can an edge stop working?
Yes, though “stop working” usually means one of three things: market conditions have changed in ways that reduce the strategy’s probability (a ranging regime for a trend-following strategy, for example); the trader’s execution has deteriorated (compliance has dropped, introducing behavioural noise that degrades the expectancy); or the edge was never verified across sufficient samples to distinguish it from a lucky period. Genuine structural edges — based on consistent institutional behaviour at specific levels and times — tend to be more durable than pattern-recognition edges that may be period-specific.
Is a 50% win rate a good edge?
It depends entirely on the average win and loss size. A 50% win rate with 2.0R average wins and 1.0R average losses produces an expectancy of +0.50R per trade — an excellent edge. The same 50% win rate with 1.0R average wins and 1.5R average losses produces an expectancy of −0.25R — a losing strategy. Win rate alone is one of the most misleading metrics in trading. Always evaluate it alongside average R figures.
Does the blended ICT and Volume Profile approach have a genuine edge?
The blended approach described in The Complete Trader’s Edge — ICT concepts for structural identification and entry timing, Volume Profile for institutional confirmation, Fibonacci for precision, and Kill Zones for session filtering — creates multiple independent reasons to take a trade simultaneously (confluence), which is the core mechanism of any structural trading edge. The blended approach has been documented to produce positive expectancy by traders using it systematically. However, the edge is only real for a specific trader when that trader has executed it consistently enough to generate their own 100-trade sample with positive expectancy in their own journal data.
What is the minimum expectancy required for a viable trading edge?
Any positive expectancy after transaction costs represents a real edge. Practically, an expectancy of +0.15R or above per trade is worth developing and scaling. At 1% risk per trade and 40 trades per month, +0.15R produces a 6% monthly return on capital — a genuinely strong result. Most professional traders operate in the +0.20R to +0.40R range as a sustainable long-term expectancy. Anything above +0.50R on a sample under 100 trades should be verified with a larger sample before drawing conclusions about its durability.
▶ ▶ ▶ Continue Reading
Build all three pillars of the complete edge
The Complete Trader’s Edge
The complete system for building a genuine, documented trading edge
70 chapters covering every dimension of the Mind · Method · Money framework — from understanding what a genuine edge actually is, to building and verifying one in your own journal data, to scaling it through proper risk management and funded capital. Available on Amazon in Kindle, paperback and full-colour editions.
 The Complete Trader's Edge
The full Mind · Method · Money framework. 70 chapters.
View on Amazon →
The Complete Trader's Edge
The full Mind · Method · Money framework. 70 chapters.
View on Amazon →
 Market Mayhem
400 years of bubbles, crashes, and the pattern that keeps repeating.
Buy on Amazon →
Market Mayhem
400 years of bubbles, crashes, and the pattern that keeps repeating.
Buy on Amazon →