Breaker blocks, mitigation blocks, optimal trade entry, premium/discount arrays, and inducement — the precision tools that complete the institutional playbook.
| Advanced Concept | What It Is | When to Use It |
|---|---|---|
| Breaker block | A failed Order Block that flips polarity (support becomes resistance) | When an OB is broken and price returns to the zone from the opposite side |
| Mitigation block | A previously tested OB where remaining orders were partially filled | When price returns to a zone where it previously reacted but did not fully reverse |
| Optimal Trade Entry (OTE) | Entry at the 0.618-0.786 Fibonacci zone of a displacement move | After a BOS/ChoCH creates a new impulse leg. Enter the pullback at the golden zone. |
| Premium / Discount | Dividing the range into upper (premium) and lower (discount) halves at 50% | Buy in discount (below 50%). Sell in premium (above 50%). Never buy premium, never sell discount. |
| Inducement | A minor structural level created to lure traders into taking positions before a sweep | Identify minor highs/lows that form within a larger structure. These are traps, not entries. |
You understand order blocks. You can identify fair value gaps. You know where liquidity sits and how price hunts stops. But you are still getting stopped out on entries that looked perfect, or watching price reverse at levels that do not appear on any of your charts. The problem is not your analysis — it is that you are working with half the toolkit.
Every concept on this page traces back to one man. The complete story of Michael J. Huddleston covers where each idea originated, what the evidence supports, and what remains untestable.
This chapter gives you the other half. These are the precision tools that experienced smart money traders use to filter bad setups, refine entry points, and understand why price reacts at levels that basic SMC analysis cannot explain. None of them replace what you have already learned. All of them sharpen it.
Premium vs Discount Zones
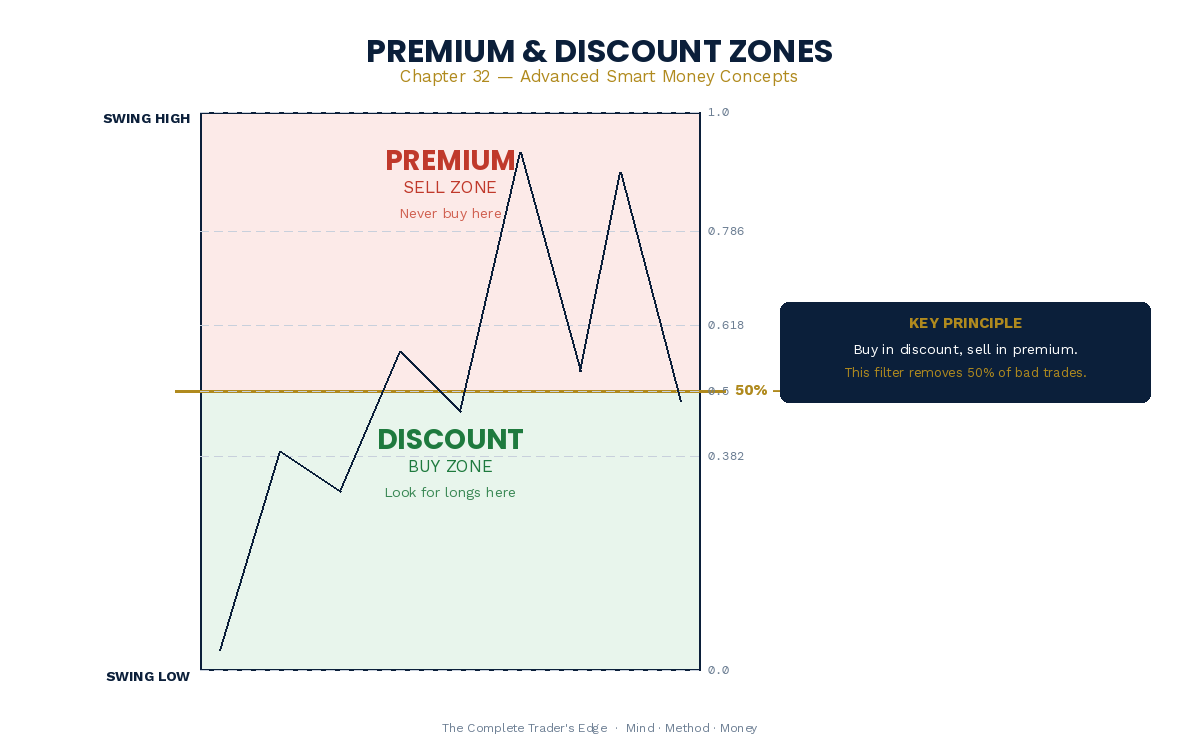
Every price range can be divided into two halves. The midpoint — the 50% level — is the equilibrium. Everything above it is premium. Everything below it is discount.
The concept is deceptively simple, but it is one of the most powerful filters in smart money trading. If your bias is bullish, you want to buy in discount — below the 50% level of the current range. If your bias is bearish, you want to sell in premium — above the 50% level. This single rule eliminates roughly half of all bad entries.
To apply it, identify the most relevant swing high and swing low on your higher timeframe. Draw the 50% level. If price is in premium and you are looking to buy, stop. Wait for a pullback into discount. If price is in discount and you are looking to sell, stop. Wait for a rally into premium.
This works because institutions accumulate positions at a discount to the range they expect price to trade through, and distribute positions at a premium. They are buying cheap and selling expensive — exactly what retail traders fail to do when they chase breakouts at the top of a range or panic-sell at the bottom.
Rule: Never buy in premium. Never sell in discount. If your entry does not pass this filter, the setup is not ready.
Optimal Trade Entry (OTE)
Once you have confirmed that price is in the correct zone — discount for longs, premium for shorts — you need a specific entry window. This is where the Optimal Trade Entry comes in.
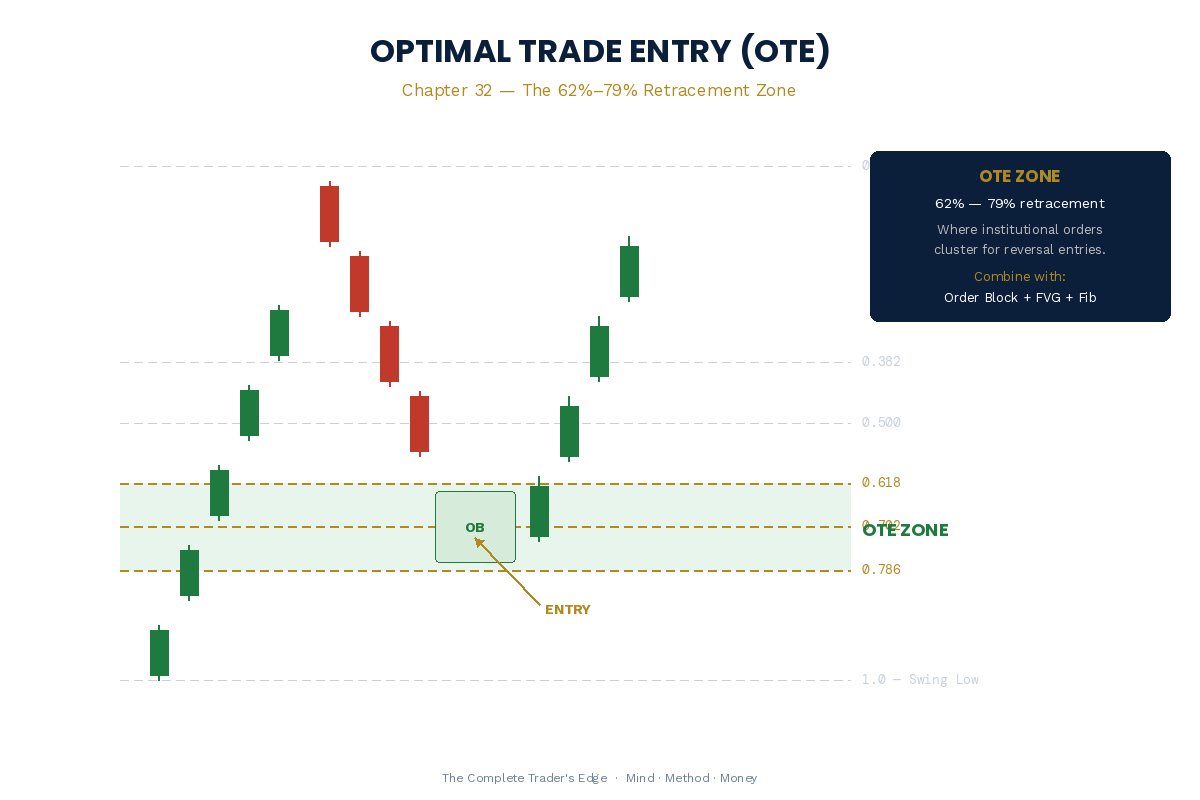
OTE is the zone between the 62% and 79% Fibonacci retracement of the most recent impulse move. It is where institutional orders cluster most densely during retracements. The concept bridges Fibonacci with smart money theory: institutions do not enter at random levels during pullbacks. They enter where the retracement is deep enough to offer value but not so deep that the structure has broken.
The 62–79% zone is not arbitrary. The 61.8% level is the golden ratio — the most watched Fibonacci level in all of technical analysis. The 70.2% level is the square root of 0.5, another key mathematical ratio. The 78.6% level is the square root of 0.618. Together, these three ratios create a dense cluster of potential reaction points.
In practice, you identify your impulse leg — the most recent strong move in the direction of your bias. You draw a Fibonacci retracement from the swing low to the swing high (for bullish setups) or swing high to swing low (for bearish setups). The zone between 62% and 79% is your OTE. You then look for a confluence factor within that zone: an order block, a fair value gap, or a previous support/resistance level.
This is what separates OTE from generic Fibonacci trading. A Fibonacci trader enters at 61.8% because the number says so. An SMC trader enters at a specific order block that happens to sit within the OTE zone — because two independent tools are agreeing.
Breaker Blocks
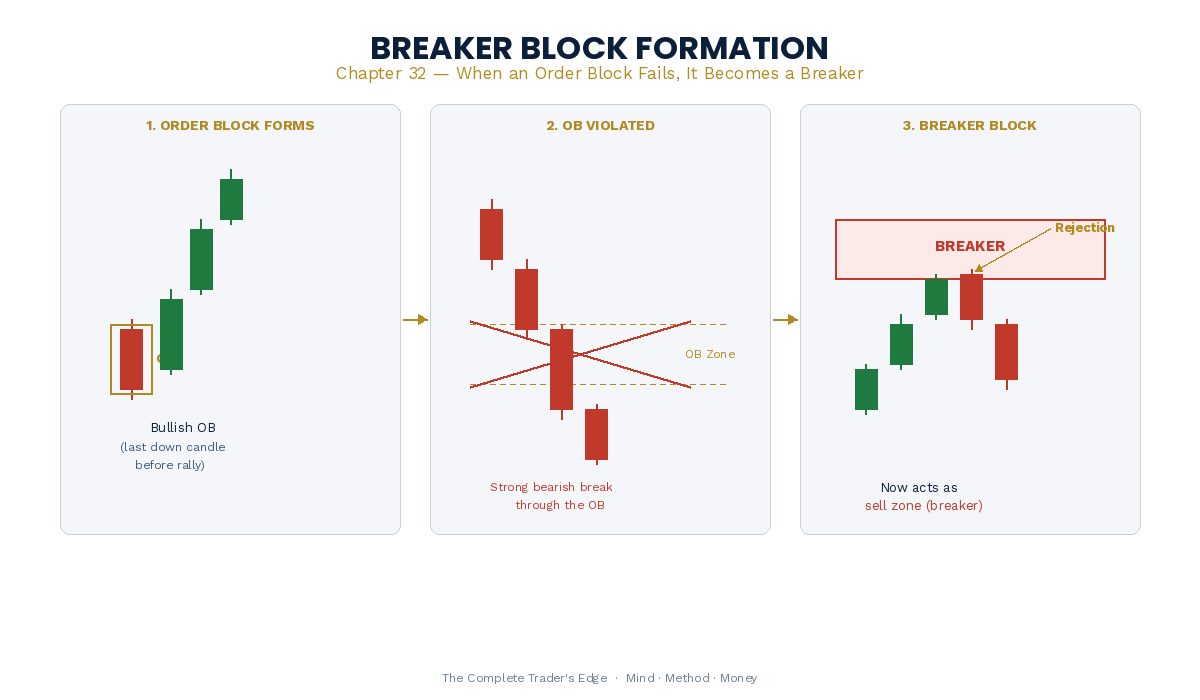
An order block that fails becomes a breaker block. This is one of the most important concepts in advanced SMC because it explains what happens when the market changes direction — when a previously valid institutional level is overwhelmed and its role reverses.
Here is the sequence. A bullish order block forms — the last down-close candle before a rally. Price respects it once, perhaps twice, bouncing from it as expected. Then, on the third or fourth approach, price drives through it with conviction. The order block has failed.
But the story does not end there. The institutions that were buying at that order block are now underwater. They have losing positions. When price eventually retraces back to that level, those institutions will look to exit at breakeven or a small loss. This creates selling pressure at a level that used to be support — classic support-turned-resistance. The failed bullish order block is now a bearish breaker block.
The inverse applies for bearish order blocks that fail. When a bearish OB is broken to the upside, it becomes a bullish breaker block — a level where institutions with losing short positions will look to cover, creating buying pressure at what was previously resistance.
Breaker blocks often produce sharper reactions than regular order blocks because the motivation behind them is stronger. Institutions protecting a winning position at an order block may or may not defend it aggressively. But institutions scrambling to exit a losing position at a breaker block are acting with urgency.
Mitigation Blocks
Mitigation blocks are related to breaker blocks but address a different institutional behaviour. Where breaker blocks form when an order block fails, mitigation blocks form when institutions need to return to a zone to close out positions from a previous move before continuing in the current direction.
Think of it this way. A bank enters a large short position during a distribution phase. Price drops, and their position is profitable. Then price retraces sharply — not enough to invalidate the downtrend, but enough that the bank’s position has given back significant unrealised profit. The bank wants to close part of that position at a better price before the next leg down. They need price to return to a specific zone — the level where they originally entered — so they can mitigate their exposure.
The mitigation block is that zone. It is typically the origin of the move that caused the loss or the area where the institution’s original entry was placed. Price returns to it, the institution offloads positions, and the trend resumes.
The practical difference between a mitigation block and an order block is intent. An order block is where institutions are building new positions. A mitigation block is where institutions are closing old ones. Both produce reactions, but mitigation blocks tend to produce a single reaction — once the old positions are closed, there is no reason for price to react there again.
Inducement
Inducement is the mechanism by which smart money creates the liquidity it needs to fill large orders. It is, in essence, the bait.
Retail traders are predictable. They place stop losses at obvious levels — below swing lows, above swing highs, just beyond consolidation ranges. They enter breakouts the moment price moves beyond a key level. Smart money knows this. And smart money needs the other side of their trades.
Inducement is any price action that lures retail traders into a position before the real move begins. It takes many forms: a minor higher high that triggers breakout buyers just before a reversal, a small lower low that triggers stop losses just before a bounce, a false break of consolidation that looks like the start of a trend.
The key to identifying inducement is context. Look for small, unconvincing breaks of structure that occur near significant levels — order blocks, supply/demand zones, or premium/discount boundaries. If price makes a minor new high or low that does not have strong momentum behind it, and it occurs at a level where retail traders would predictably enter or get stopped out, you are likely looking at inducement.
Do not trade inducement. Trade what comes after it. Once the inducement has done its job — once the stop losses have been triggered and the breakout traders have entered — wait for the reversal signal. That reversal, backed by freshly harvested liquidity, is the real move.
Inducement creates the fuel for the real move. The liquidity swept by inducement is what allows institutions to fill their orders. Without it, there would not be enough volume on the other side.
The Judas Swing
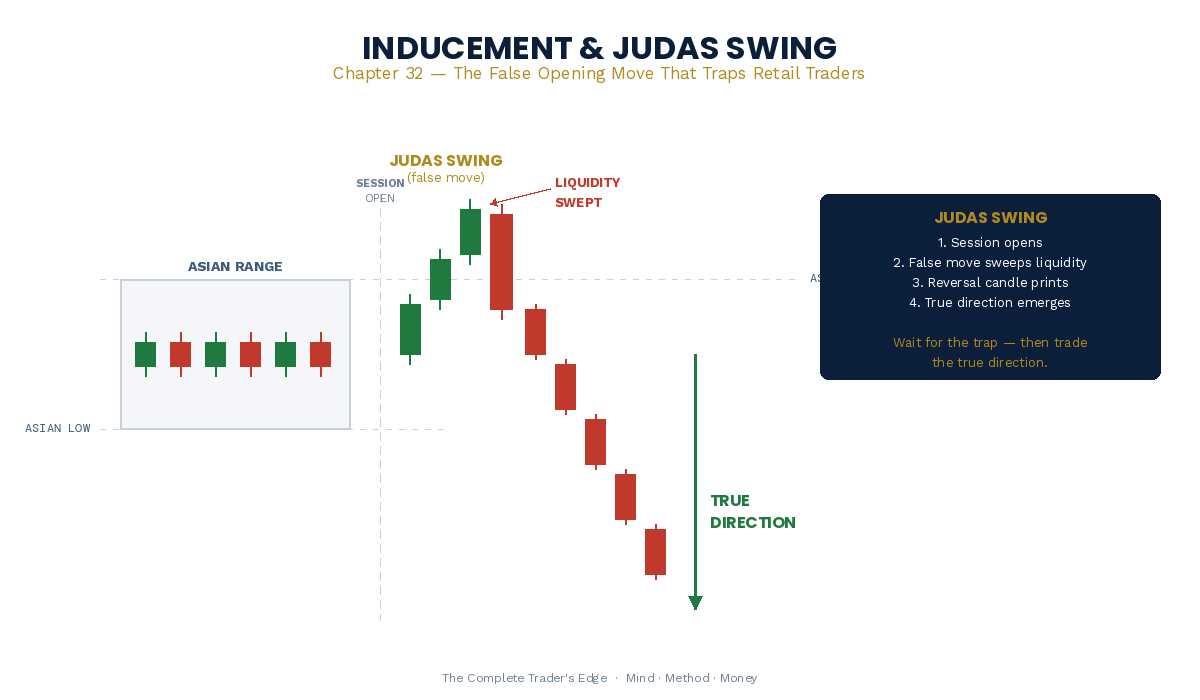
The Judas Swing is a specific form of inducement that occurs at the open of a trading session. It is named for its betrayal: the initial move of the session goes in one direction, trapping early traders, and then reverses sharply in the true direction.
This happens most frequently during the London and New York opens. The session opens and price makes an aggressive move — perhaps 20–50 pips in forex, or several points in indices. Retail traders see momentum and enter in the direction of the opening move. Stop losses are placed on the other side.
Then the reversal comes. The opening move was the Judas Swing — a false move designed to generate liquidity. The traders who entered long are now providing sell-side liquidity as their positions get stopped out. Institutions use this liquidity to fill their actual orders in the opposite direction.
To trade the Judas Swing, do not enter in the first 15–30 minutes of a session. Let the opening move play out. Wait for a clear rejection — a strong reversal candle, a break of the opening range in the opposite direction, or a return to a key level. The true session direction typically establishes itself within the first hour.
The Turtle Soup Pattern
The Turtle Soup pattern — originally described by Larry Connors and Linda Raschke — is one of the earliest formalised descriptions of what we now call a liquidity sweep. The name comes from the Turtle Traders, who famously traded breakouts. Turtle Soup is the strategy that fades those breakouts.
The setup is straightforward. Price makes a new 20-period high or low, breaking beyond a prior swing point. But instead of continuing, it fails within one to three bars and reverses back inside the range. The breakout was false — a sweep of the liquidity sitting beyond the prior swing.
What makes Turtle Soup valuable as a standalone concept is its simplicity and clear rules. You do not need to identify order blocks or fair value gaps to trade it. You need a prior swing point, a break beyond it, and a failure candle. If the failure occurs in a premium or discount zone, within an OTE, or at a higher-timeframe order block, the probability increases significantly.
Putting It All Together: The SMC Decision Tree
You now have the complete smart money toolkit. The challenge is knowing when to use which tool. Here is the decision framework that connects everything into a single analytical process:
Step one: Establish your higher-timeframe bias. Use market structure to determine whether the higher timeframe is bullish, bearish, or ranging. This is your directional filter.
Step two: Identify the premium/discount zone. Divide the current range into halves. If bullish, only look for entries in discount. If bearish, only in premium.
Step three: Find your point of interest. Scan for a fresh order block, an unfilled fair value gap, a breaker block, or a mitigation block.
Step four: Check for confluence. Does your point of interest sit within the OTE zone? Does it align with a key Fibonacci level? Is it near an unswept liquidity pool?
Step five: Wait for the entry trigger. A rejection candle, a break of lower-timeframe structure, or an engulfing pattern at your level.
Step six: Manage the trade. Stop loss beyond the trigger zone. First target at the most recent swing point. Trail to breakeven on momentum.
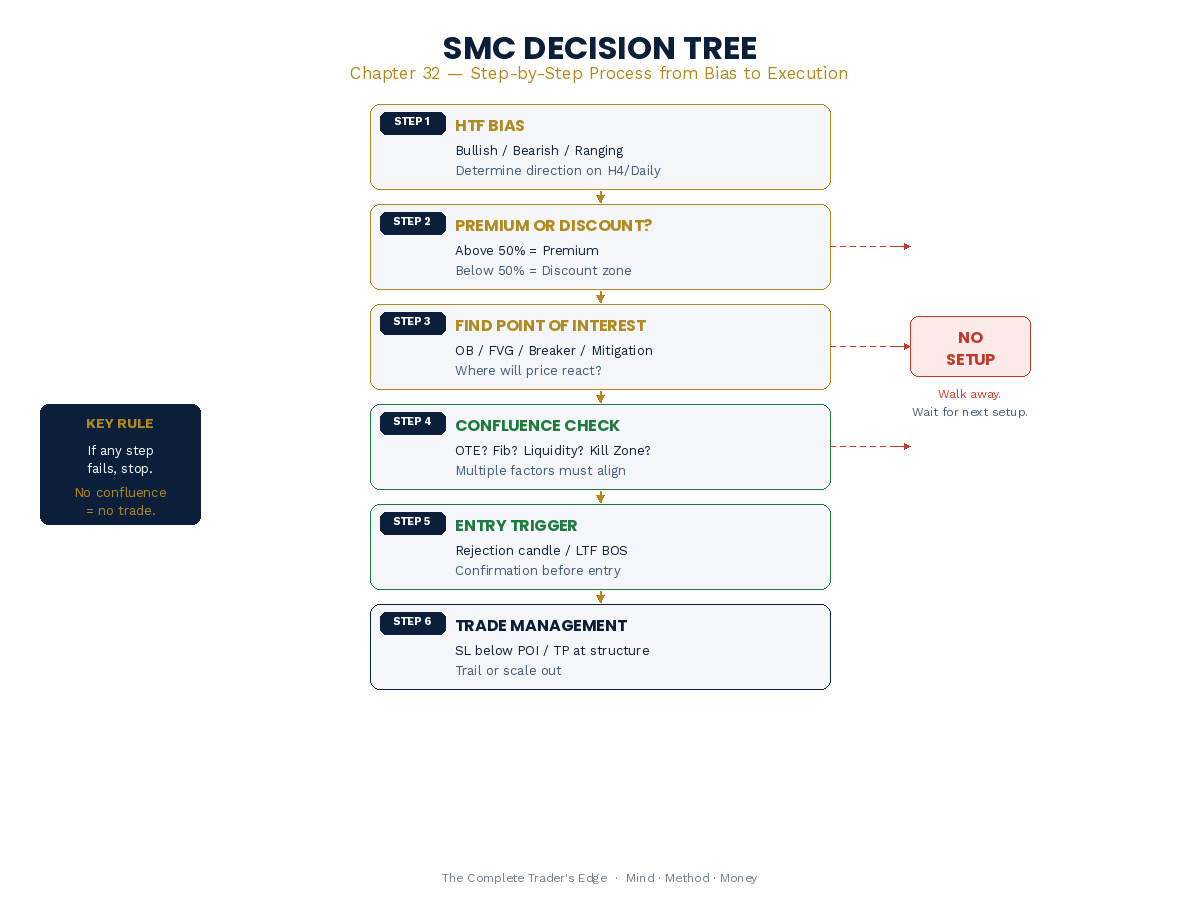
The decision tree is not a checklist that must be completed in full every time. It is a filter. Each step narrows the universe of possible trades until only the highest-probability setups remain. Some days, nothing passes all six steps. That is a good day — it means you avoided low-quality trades.
The Complete Institutional Playbook
With this chapter, you now have the full smart money framework. Order blocks tell you where institutions placed their orders. Fair value gaps tell you where price moved too fast and left an imbalance. Liquidity tells you where the orders are that institutions need to fill their positions. Liquidity sweeps tell you how price targets those orders. And now, advanced concepts tell you how to refine entries, identify failed levels, and understand the traps that catch traders who only use the basics.
The tools in this chapter are not more important than the ones before them. They are more precise. A trader who masters order blocks and fair value gaps will be profitable. A trader who adds premium/discount filtering, OTE entries, and breaker block recognition will be profitable more consistently and with tighter risk.
📚 Related Articles from The Complete Trader’s Edge:
This article is adapted from The Complete Trader’s Edge
70 chapters covering Mind · Method · Money — the most comprehensive trading education framework available.
Frequently Asked Questions
What are breaker blocks?
A breaker block is a failed Order Block that flips from support to resistance (or vice versa). When price trades through a bullish Order Block and closes below it, the OB is mitigated and becomes a bearish breaker. Breakers are powerful levels because trapped traders create predictable selling (or buying) pressure when price returns.
What is the premium and discount concept?
Premium refers to prices above the equilibrium (50% level) of a range; discount refers to prices below. ICT methodology teaches buying in the discount zone and selling in the premium zone. This concept aligns with the Fibonacci golden pocket, which sits in the discount zone of a bullish retracement.
What is Optimal Trade Entry (OTE)?
OTE is the ICT term for an entry at the 0.618-0.786 Fibonacci retracement zone of an impulsive move. It represents the “optimal” balance between getting a favourable entry price and confirming that the retracement is a pullback (not a reversal). OTE entries naturally produce excellent risk-to-reward ratios.
Should I learn basic ICT first or jump to advanced concepts?
Master the basics first: market structure, Order Blocks, Fair Value Gaps, and liquidity. Advanced concepts like breakers, OTE, and premium/discount add refinement to entries you can already identify with the basics. Adding complexity before mastering fundamentals creates confusion without improving results.
How many ICT concepts should I use simultaneously?
Focus on 3-4 core concepts for your primary setup. A complete ICT entry might use: higher timeframe market structure (direction), Order Block or FVG (entry zone), Kill Zone timing (when), and a confirmation candle (trigger). Advanced concepts like breakers and OTE add confluence but are not required for every trade.
From The Book
This article covers concepts from Chapters 28-35 of The Complete Trader’s Edge.
 The Complete Trader's Edge
The full Mind · Method · Money framework. 70 chapters.
View on Amazon →
The Complete Trader's Edge
The full Mind · Method · Money framework. 70 chapters.
View on Amazon →
 Market Mayhem
400 years of bubbles, crashes, and the pattern that keeps repeating.
Buy on Amazon →
Market Mayhem
400 years of bubbles, crashes, and the pattern that keeps repeating.
Buy on Amazon →
 Greatest Companies
How the world's greatest companies were built — and what traders learn from them.
View on Amazon →
Greatest Companies
How the world's greatest companies were built — and what traders learn from them.
View on Amazon →
 Greatest Traders
Eighty-six lives that explain the markets — Livermore to Madoff, told with the losses left in.
View on Amazon →
Greatest Traders
Eighty-six lives that explain the markets — Livermore to Madoff, told with the losses left in.
View on Amazon →