Triangles, head and shoulders, wedges, flags, double tops and bottoms — the classical formations and how to trade them with a smart money lens.
Chart patterns are the oldest tool in technical analysis. Traders have been identifying triangles, head and shoulders formations, and double tops since the early twentieth century. They predate computers, algorithms, and smart money theory by decades. And they still work — not because geometry is magic, but because patterns are a visual representation of crowd psychology.
| Pattern | Type | Signal | Smart Money Context |
|---|---|---|---|
| Head and Shoulders | Reversal | Bearish after uptrend | The right shoulder often forms at a bearish OB. The neckline break is a BOS. |
| Double Top / Bottom | Reversal | Reversal at equal highs/lows | Equal highs = liquidity target. The “break” of the double top is often a sweep before reversal. |
| Ascending Triangle | Continuation | Bullish breakout | Flat top = equal highs (liquidity). Higher lows = accumulation. Break up sweeps the liquidity. |
| Wedge (Rising/Falling) | Reversal | Counter-trend break | Wedges create obvious trendline liquidity. The break of the wedge sweeps those stops. |
| Flag / Pennant | Continuation | Trend resumes after consolidation | The flag is a pullback to an OB/FVG zone. The breakout is the distribution phase. |
A head and shoulders pattern does not cause price to reverse. It reflects a market where buyers made three attempts to push higher, each with diminishing conviction, until sellers overwhelmed them. The pattern is the symptom. The psychology is the cause. Understanding this distinction is what separates traders who use patterns effectively from traders who see patterns everywhere and wonder why they keep failing.
This chapter covers the major chart pattern families, how to measure their projected targets, and how to read them through a smart money lens. Because while patterns reveal crowd behaviour, smart money exploits that behaviour.
What Chart Patterns Actually Represent
Every chart pattern is a story about the balance of power between buyers and sellers. A symmetrical triangle is a story of decreasing conviction on both sides. A head and shoulders is a story of a trend losing momentum — the right shoulder cannot reach the height of the head, telling you that buyers are exhausted.
Patterns form because humans are predictable. When price approaches a resistance level for the third time, buyers who were stopped out on the first two attempts start placing orders in anticipation. Sellers who profited from previous rejections start placing orders at the same level. This creates a self-reinforcing dynamic that produces the geometric shapes we recognise as patterns.
The reason patterns have worked for over a century is that human psychology has not changed. Greed, fear, hope, and capitulation produce the same behaviour in 2026 as they did in 1926.
Reversal Patterns
Head and Shoulders
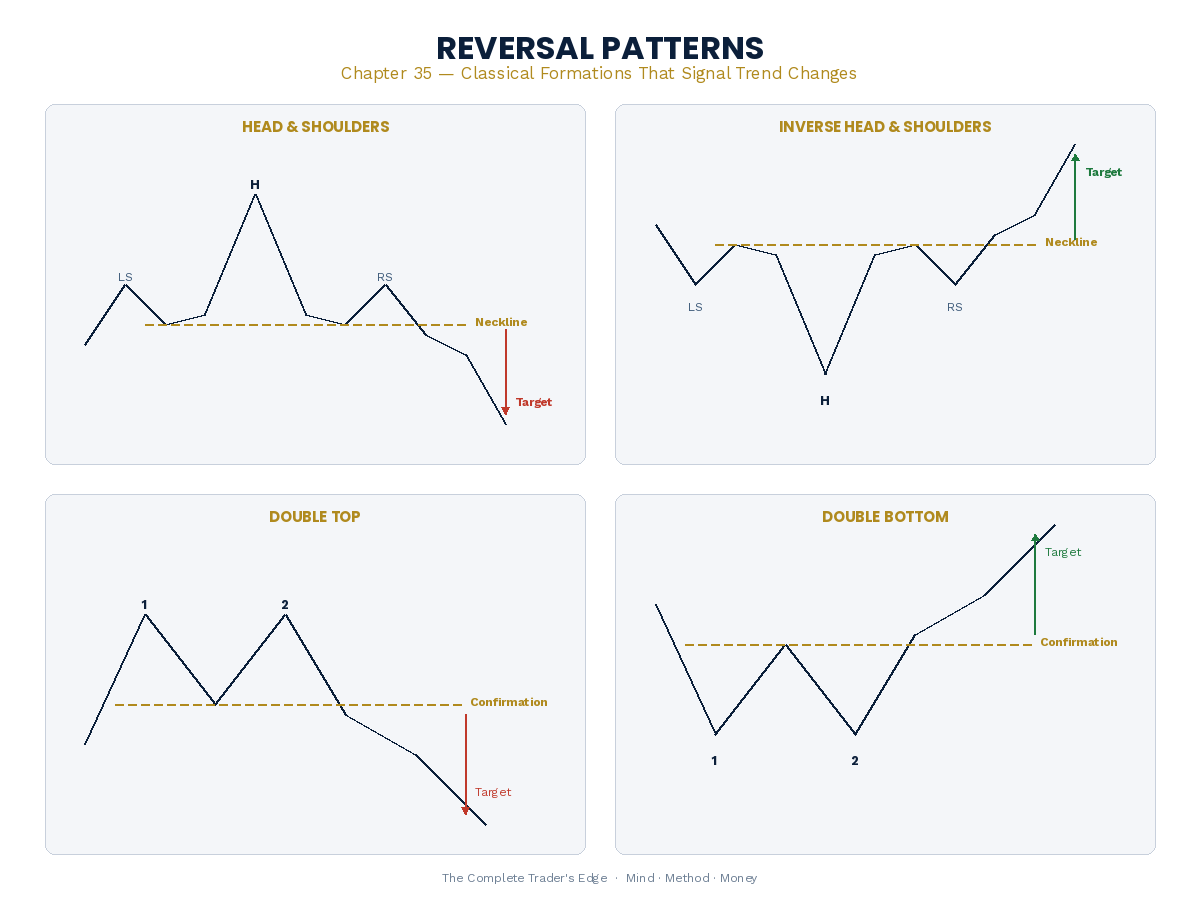
The head and shoulders is the most reliable reversal pattern in classical technical analysis. It consists of three peaks: a left shoulder, a higher head, and a right shoulder that fails to reach the height of the head. The neckline connects the lows between the shoulders.
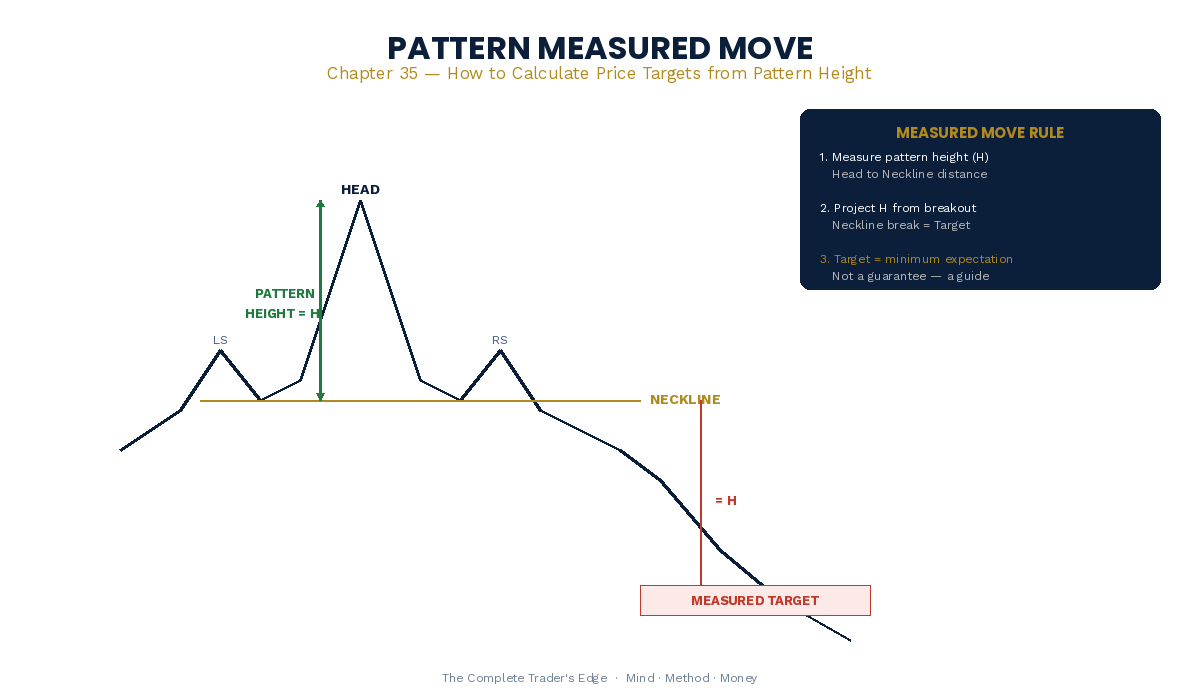
The pattern signals that the uptrend is losing momentum. The measured target is the distance from the head to the neckline, projected downward from the neckline break. This target is reached roughly 60–65% of the time in liquid markets.
Smart money lens: The right shoulder often sweeps the liquidity sitting above the left shoulder before reversing. If you see a slight overshoot that immediately reverses, that is institutional liquidity collection — not a pattern failure.
Double Top and Double Bottom
A double top forms when price reaches a resistance level twice and fails to break through both times. The pattern is confirmed when price breaks below the confirmation line. Double bottoms are the inverse.
Their reliability increases when the second peak or trough occurs with declining volume, indicating that the side trying to push through is losing conviction.
Smart money lens: The second test of a double top often sweeps slightly above the first peak. This is not a breakout — it is a stop hunt. Retail traders who shorted the first peak have stops just above it.
Triple Top and Triple Bottom
Triple tops and bottoms are less common but more significant. Three tests of the same level represent three failed attempts, and when the level finally gives way, the resulting move is typically powerful because a large number of stop losses have accumulated on the other side.
Continuation Patterns
Flags and Pennants
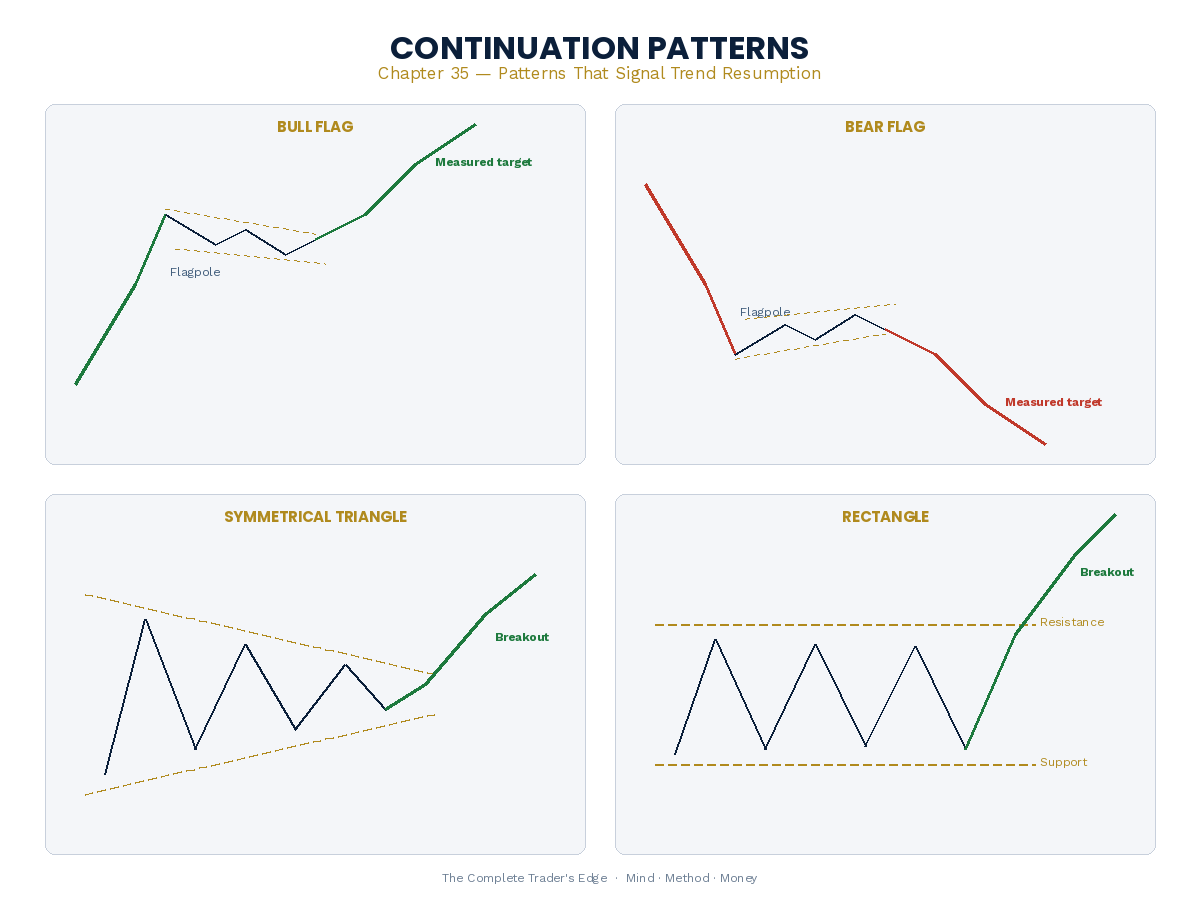
Flags are short, counter-trend consolidations that occur after a strong impulse move. They slope against the prevailing trend — a bull flag slopes downward, a bear flag slopes upward. Pennants are similar but converge to a point. Both typically resolve in the direction of the prior move, and the measured target is the length of the flagpole projected from the breakout point.
Rectangles
A rectangle is a horizontal consolidation between clearly defined support and resistance levels. Rectangles are significant because they represent accumulation or distribution zones — the Wyckoff concepts often manifest visually as rectangles.
Bilateral Patterns
Ascending Triangle
An ascending triangle has a flat upper resistance line and a rising lower trendline. Each pullback makes a higher low, indicating that buyers are becoming more aggressive. When the resistance level finally breaks, the stop losses of every trader who sold at resistance are triggered simultaneously, creating an explosive move.
Descending Triangle
The descending triangle is the bearish mirror: flat support with declining highs compressing toward it. The break below support triggers the stop losses of every buyer who accumulated at that level.
Symmetrical Triangle
A symmetrical triangle has converging trendlines from both sides — lower highs and higher lows. Neither buyers nor sellers are gaining ground. This is the most neutral pattern and tends to resolve in the direction of the prevailing higher-timeframe trend.
Wedges
Wedges look like triangles but both trendlines slope in the same direction. A rising wedge has both higher highs and higher lows, but the range is narrowing — this is bearish despite the upward slope. A falling wedge is the bullish mirror. Wedges represent exhaustion, and when the boundary breaks, the accumulated tension unwinds rapidly.
Pattern Failure as a Signal
One of the most important lessons in pattern trading is that failed patterns often produce stronger moves than completed ones. When a head and shoulders pattern fails — when price breaks above the right shoulder instead of below the neckline — the resulting rally is often explosive because every trader who shorted the pattern now needs to cover.
This connects directly to the smart money framework. Institutions know that retail traders see these patterns. They know where the stop losses are. A deliberate break of the pattern that reverses is a textbook liquidity sweep using classical TA as the bait.
When a well-formed pattern fails, the move in the opposite direction is often the most powerful trade of the day. Pattern failure is not random — it is engineered.
Measuring Targets
Every pattern has a measured move projection. The principle is simple: measure the height of the pattern and project it from the breakout point. These targets are statistical tendencies — zones where price is likely to encounter resistance or support based on the energy contained within the pattern. If your pattern target coincides with another significant level — an order block, a Fibonacci extension, or a prior swing point — the probability of a reaction increases.
Patterns and Smart Money: The Integration
The traders who lose money with chart patterns are the ones who trade them in isolation. The traders who make money use them as one layer in a multi-factor analysis. They identify the pattern, check whether the breakout aligns with the higher-timeframe bias, look for an order block or FVG at the breakout level, and check whether the pattern boundary has liquidity resting beyond it that might get swept before the real move.
Chart patterns are the most widely recognised tool in technical analysis. That ubiquity is both their strength and their vulnerability. Everyone sees them. Smart money uses that visibility as a weapon. Your edge comes from seeing the pattern, understanding what smart money will do with it, and positioning accordingly.
📚 Related Articles:
This article is adapted from The Complete Trader’s Edge
70 chapters covering Mind · Method · Money — the most comprehensive trading education framework available.
Frequently Asked Questions
Which chart patterns are most reliable?
Head and shoulders (and inverse), double tops/bottoms, and flags/pennants are the most statistically reliable classical patterns. Their reliability increases on higher timeframes (4-hour, daily) and when they align with market structure direction.
Do chart patterns still work with algorithmic trading?
Yes. Chart patterns describe the behaviour of buyers and sellers, which is driven by human psychology and institutional order flow. Algorithms often reinforce these patterns because they are programmed to recognise and react to the same formations. The patterns are more systematic in modern markets, not less.
Should I trade breakouts or wait for retests?
Wait for retests. Breakout entries have a high false-breakout rate, especially at obvious pattern boundaries where liquidity sweeps are common. The retest entry (price breaks, pulls back to the broken level, then continues) offers better R:R and higher probability because the breakout has already been confirmed.
How do chart patterns relate to ICT concepts?
Classical patterns and ICT concepts describe the same market mechanics with different vocabulary. A double bottom is a liquidity sweep of equal lows. A head and shoulders neckline break is a Break of Structure. Understanding both frameworks gives you a more complete market read.
How many patterns should I learn?
Five to seven classical patterns is sufficient. Master head and shoulders, double tops/bottoms, flags, pennants, triangles, and wedges. These cover the vast majority of tradeable pattern setups. Trying to learn every exotic pattern adds complexity without improving results.
From The Book
This article covers concepts from Chapter 33 of The Complete Trader’s Edge.
 The Complete Trader's Edge
The full Mind · Method · Money framework. 70 chapters.
View on Amazon →
The Complete Trader's Edge
The full Mind · Method · Money framework. 70 chapters.
View on Amazon →
 Market Mayhem
400 years of bubbles, crashes, and the pattern that keeps repeating.
Buy on Amazon →
Market Mayhem
400 years of bubbles, crashes, and the pattern that keeps repeating.
Buy on Amazon →
 Greatest Companies
How the world's greatest companies were built — and what traders learn from them.
View on Amazon →
Greatest Companies
How the world's greatest companies were built — and what traders learn from them.
View on Amazon →