While charts show what happened, order flow reveals why it happened — who is aggressive, who is absorbing, and which side has conviction.
Every candlestick on your chart is a summary. It compresses thousands of individual buy and sell orders into four data points: open, high, low, close. This is useful, but it hides the most important information. A green candle might look bullish, but if it was created by passive sellers absorbing every aggressive buy, the apparent strength masks genuine weakness.
Order flow strips away the summary and shows you the individual transactions. It reveals whether buyers or sellers are aggressive, where large institutional orders are being placed, and at which levels the market is being defended or abandoned. This is the closest a retail trader can get to seeing what is actually happening inside the market.
What Order Flow Actually Shows You
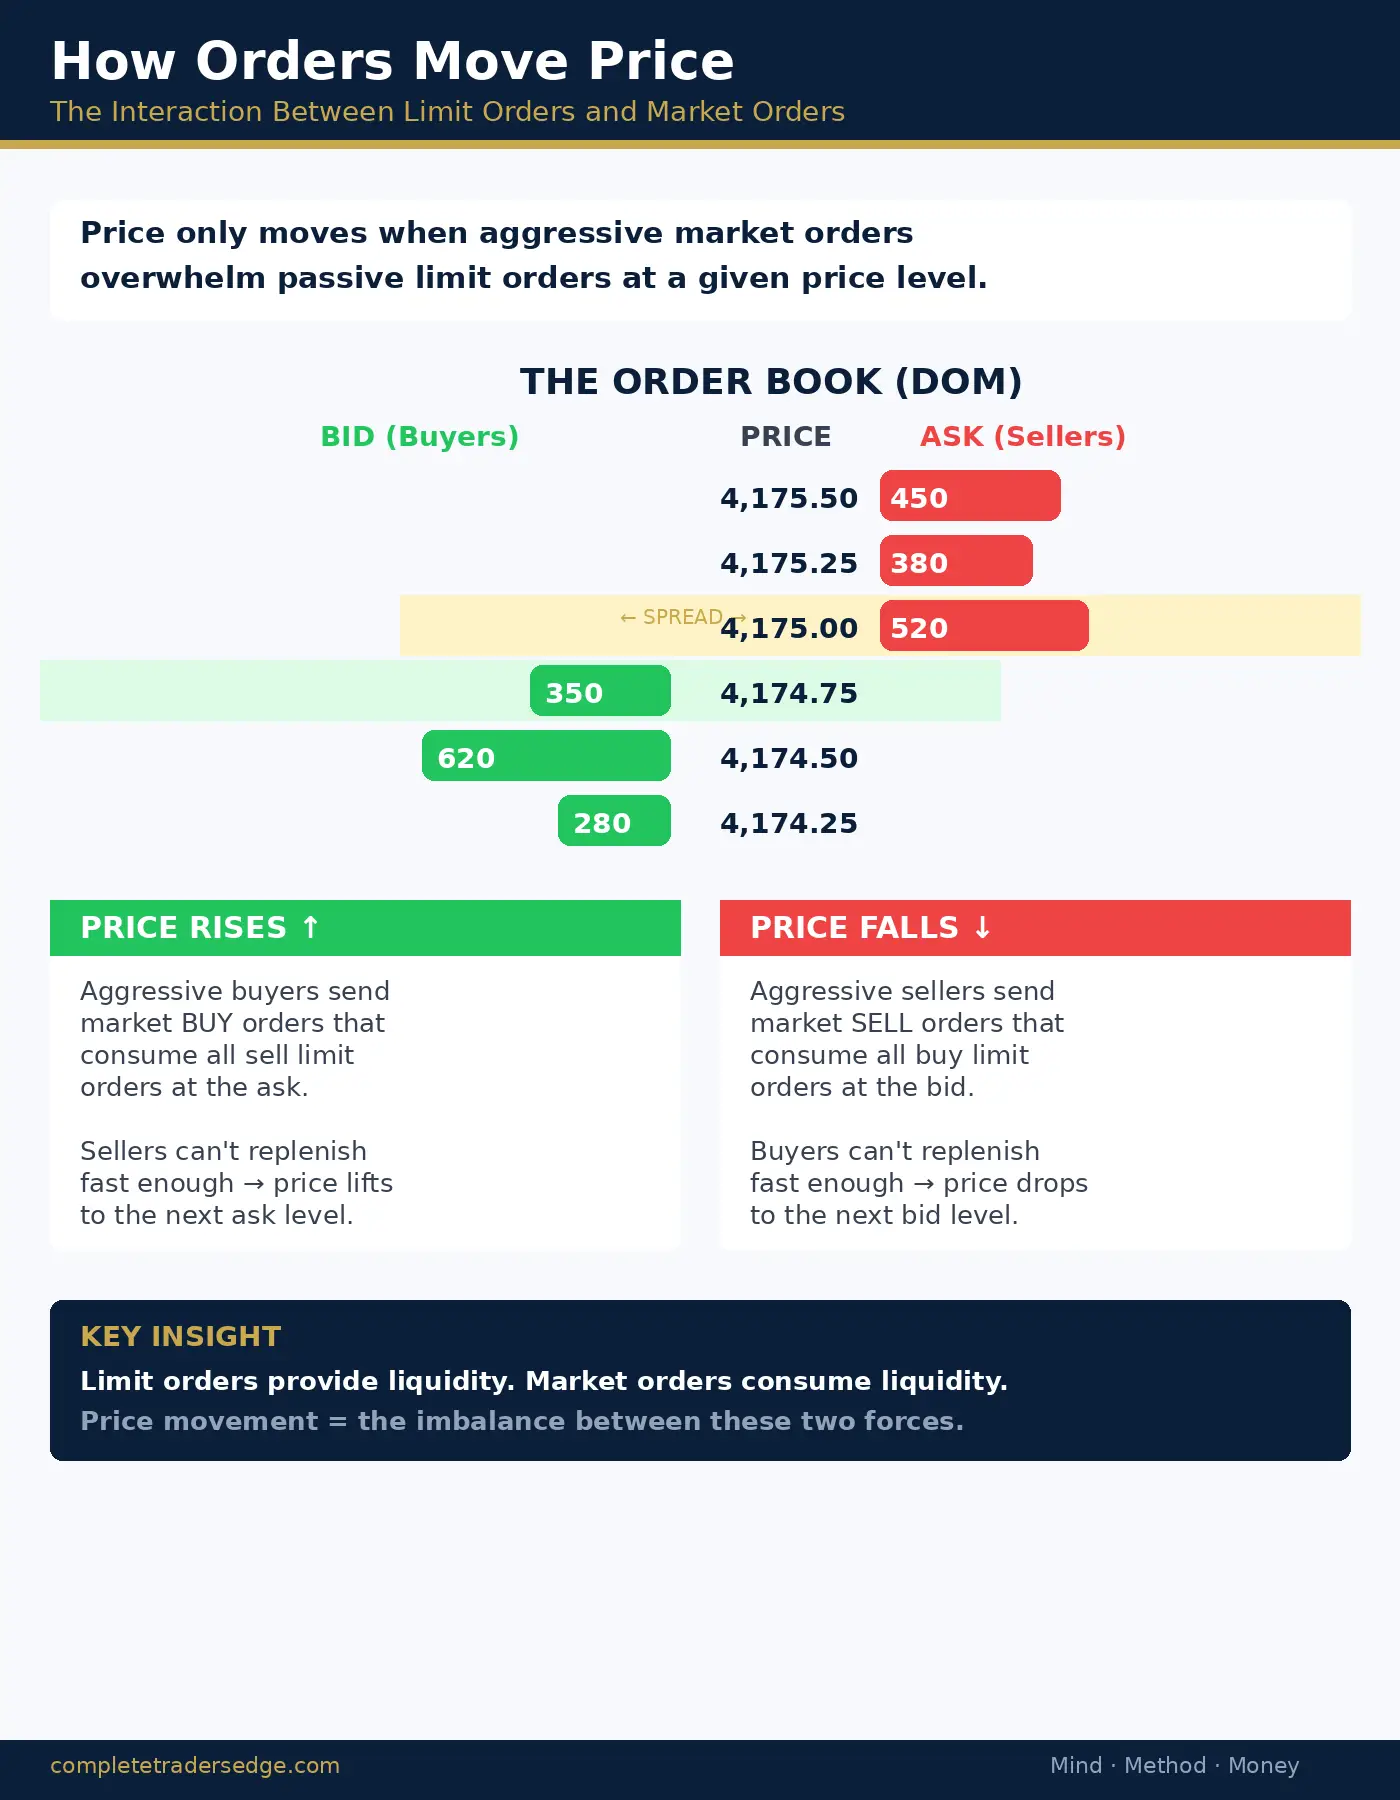
Order flow, at its core, is the study of how buy and sell orders interact at each price level. There are two types of participants in every market. Passive participants place limit orders at specific prices and wait for the market to come to them. Aggressive participants use market orders to buy or sell immediately at whatever price is available.
Price moves when aggressive participants overwhelm passive participants at a given level. If aggressive buyers hit every offer on the ask faster than passive sellers can replenish them, price rises. If aggressive sellers hit every bid faster than passive buyers can absorb them, price falls. The balance between aggression and absorption is the engine of price movement.
The Footprint Chart: Your Primary Order Flow Tool
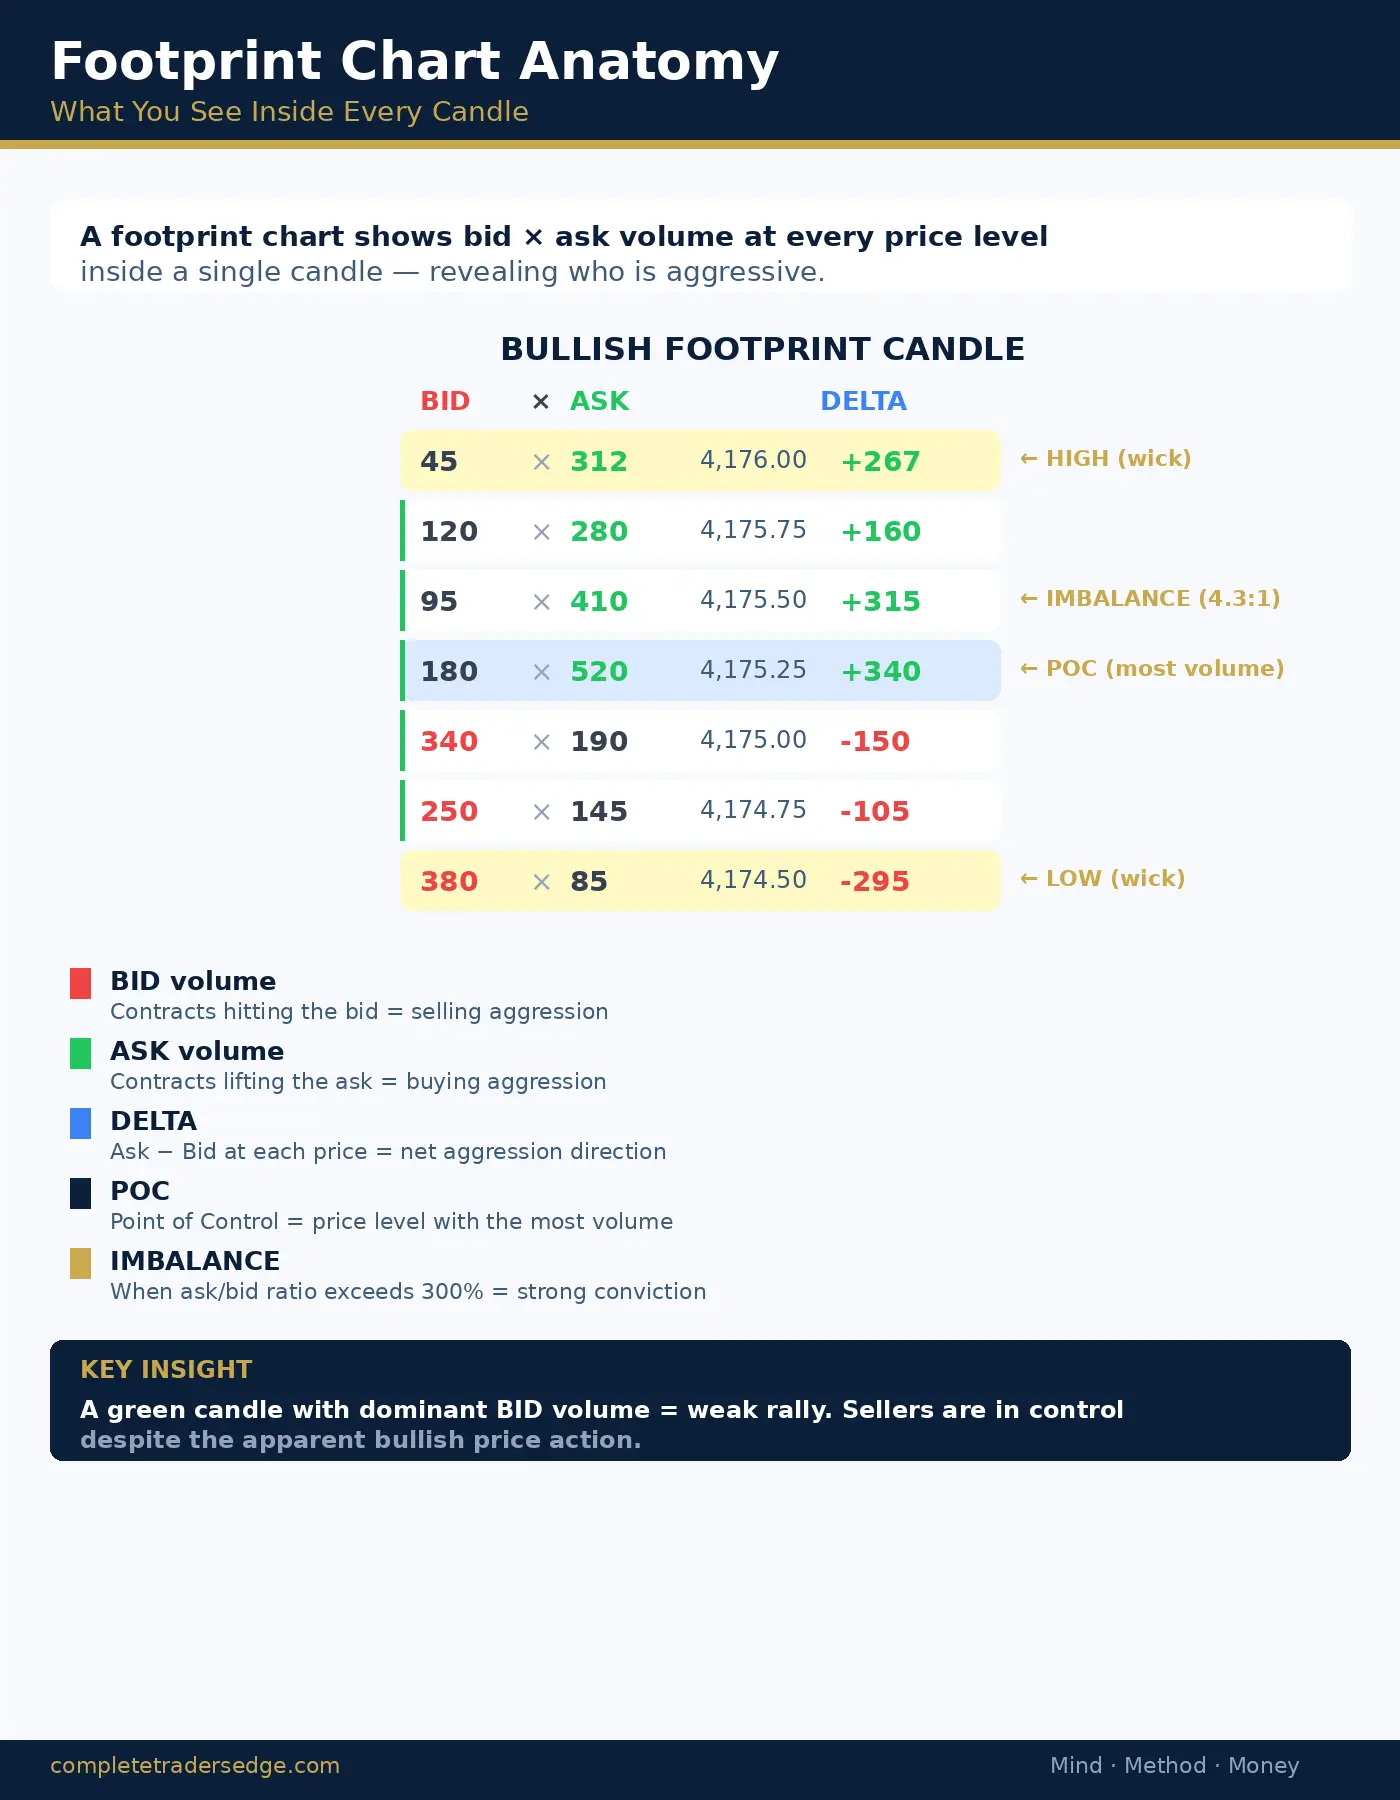
A footprint chart displays the volume of transactions that occurred at each individual price level within a candle. Instead of seeing one green candle, you see exactly how many contracts traded at each tick. Most footprint charts display this as a bid-ask split, showing how many contracts traded at the bid price versus the ask price at each level.
Transactions at the ask are typically considered buying aggression. The buyer was willing to pay the higher price to get filled immediately. Transactions at the bid are typically considered selling aggression. The seller was willing to accept the lower price for immediate execution.
Reading Imbalances
The most actionable signal in a footprint chart is an imbalance. An imbalance occurs when the ratio of buyers to sellers at a specific price level exceeds a threshold, typically 300% or more. If 900 contracts traded at the ask and only 200 at the bid at the same price level, that is a strong buying imbalance. It means aggressive buyers overwhelmed sellers at that level.
Stacked imbalances, where multiple consecutive price levels show imbalances in the same direction, indicate intense directional conviction. These often appear at the start of institutional moves and can signal the beginning of a significant trend leg.
Delta: The Summary of Aggression
Delta is the difference between volume traded at the ask and volume traded at the bid over a specified period. Positive delta means more aggressive buying occurred. Negative delta means more aggressive selling.
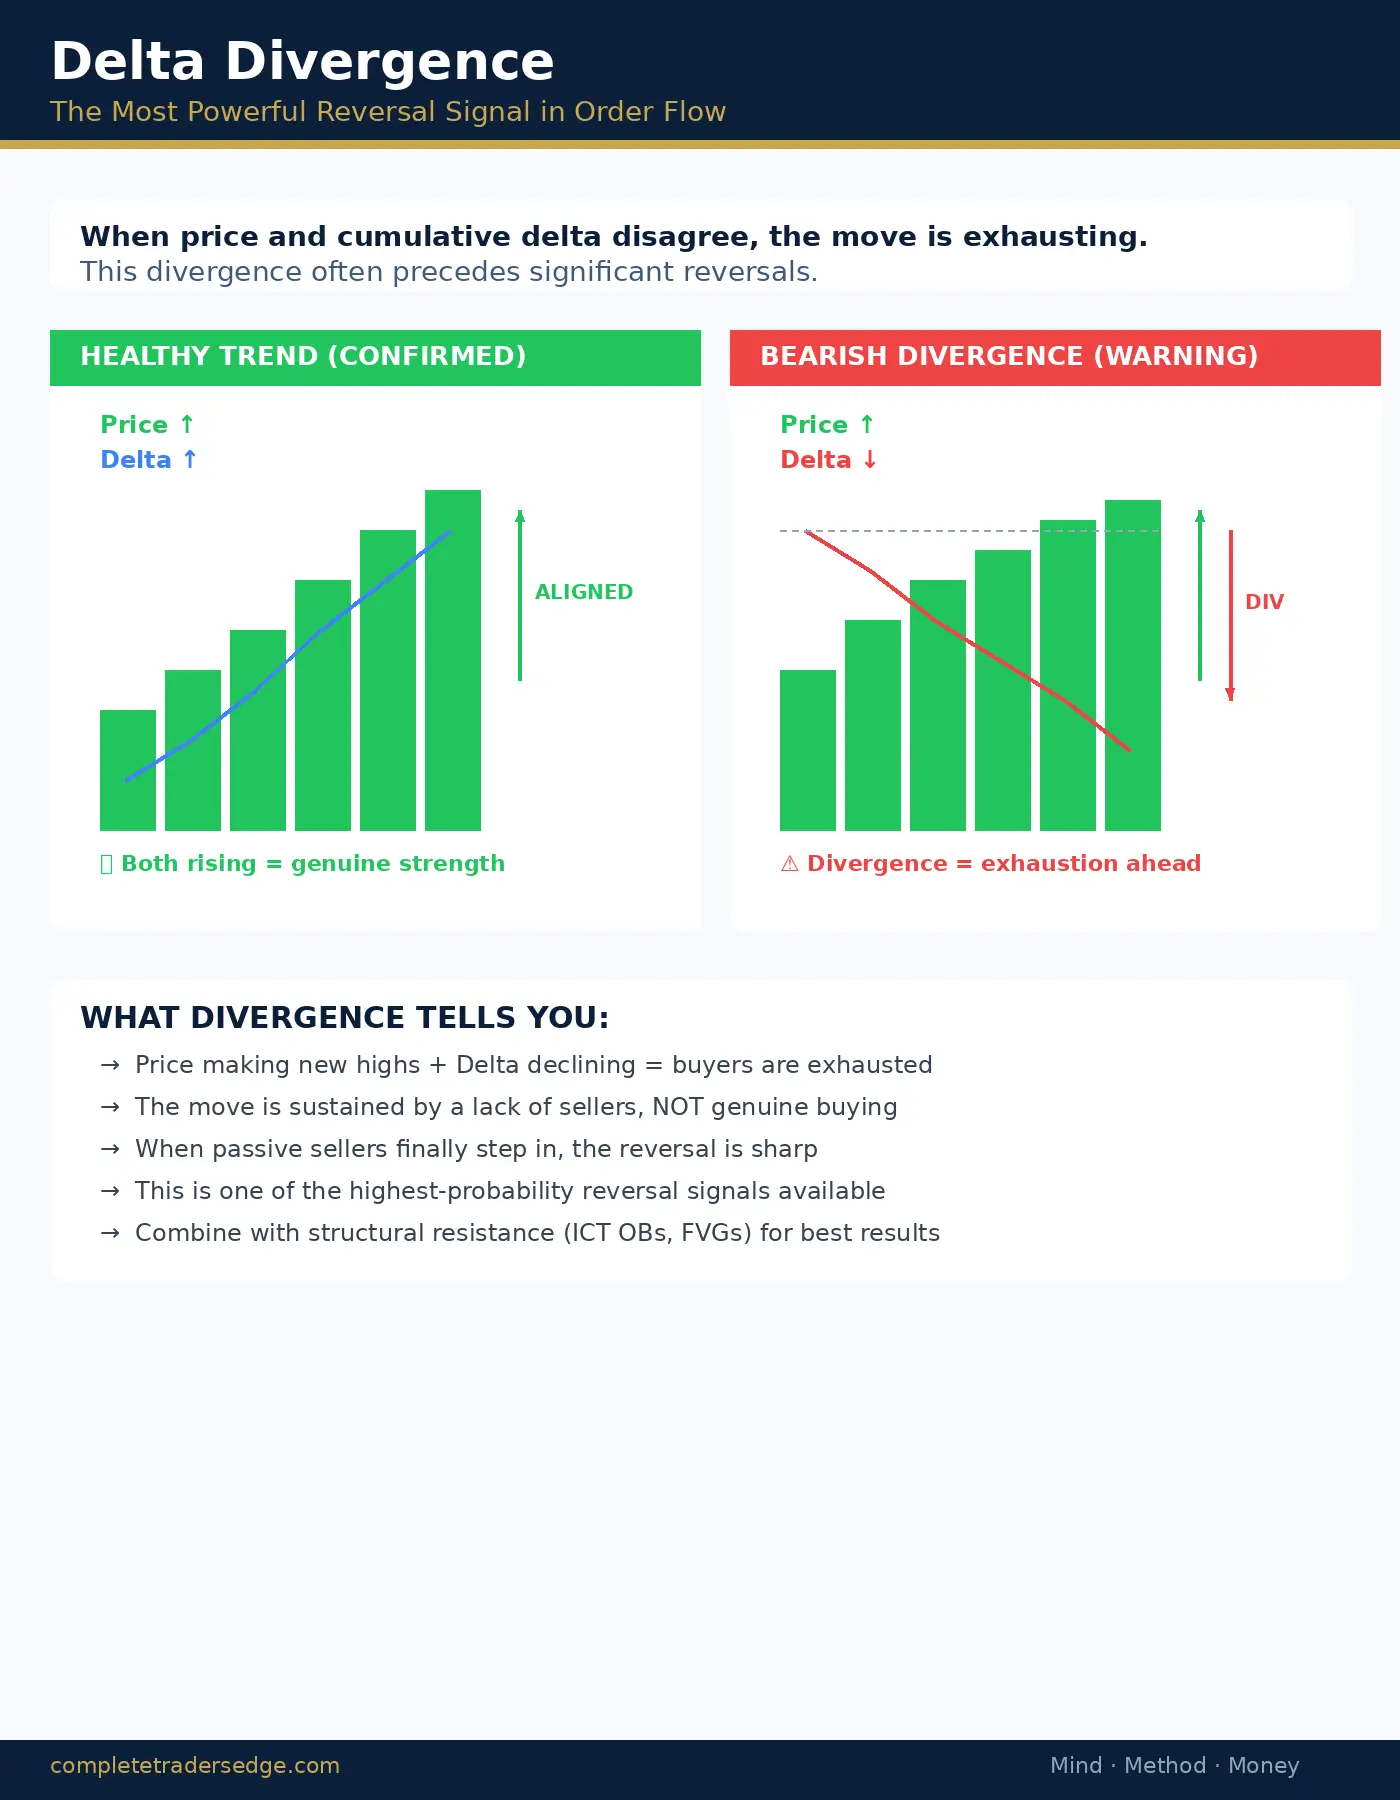
Cumulative delta tracks this difference over time. When price makes new highs and cumulative delta is also making new highs, aggressive buyers are driving the move. When price makes new highs but cumulative delta is declining, the move is being driven by a lack of sellers rather than genuine buying pressure. This divergence is one of the most powerful reversal signals in order flow analysis.
Absorption: When the Wall Holds
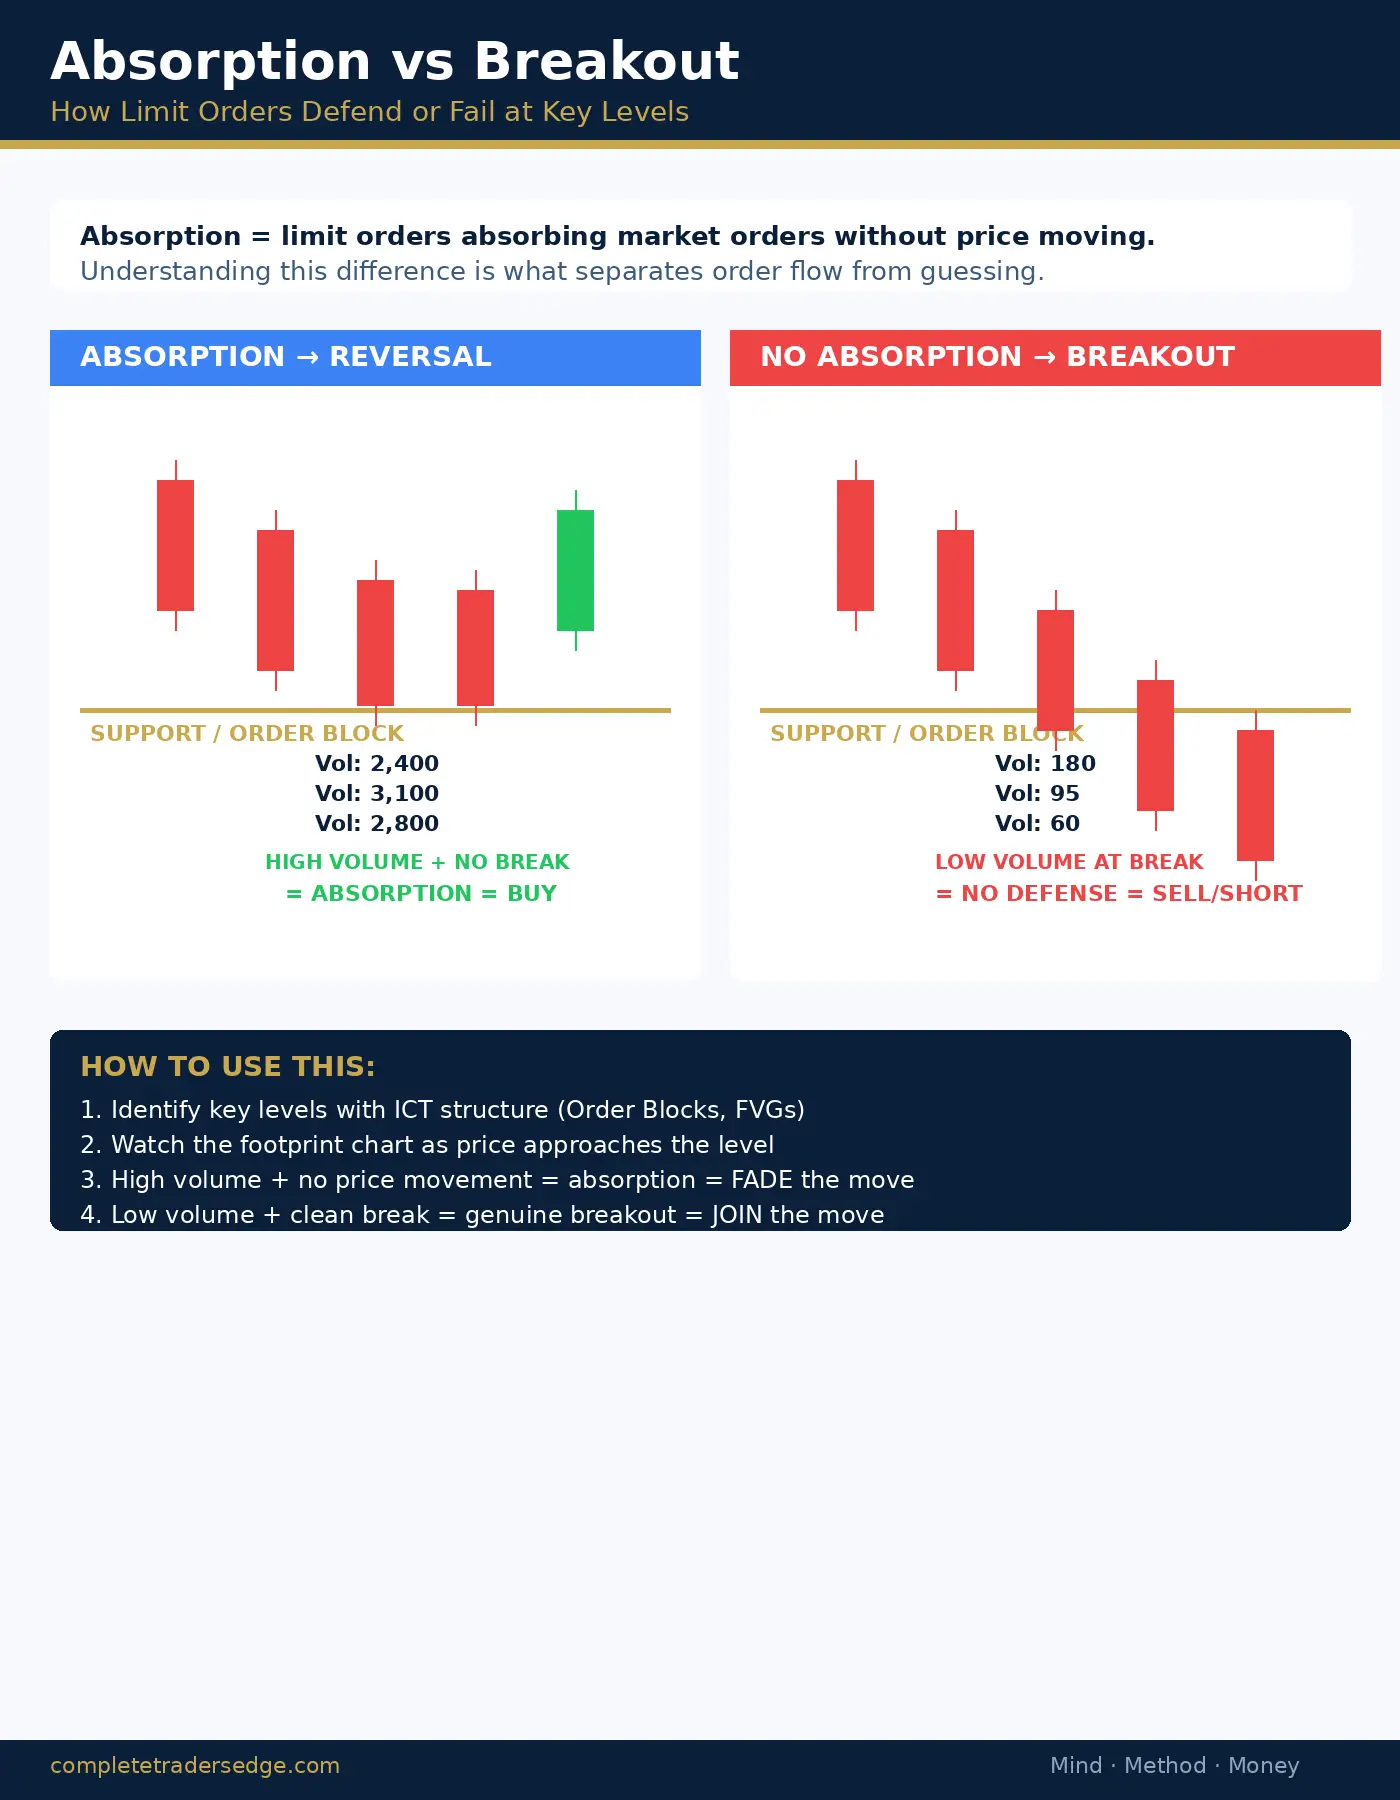
Absorption occurs when aggressive participants hit a price level repeatedly but fail to move price through it. On a footprint chart, you see high volume at a specific level with little or no price progress. Large limit orders are sitting there, absorbing every market order that hits.
Absorption at key structural levels, such as previous swing highs, VWAP, or ICT order blocks, is powerful confirmation that institutional participants are defending that level. When absorption is followed by a reversal, the trapped aggressive participants add fuel to the move as they exit.
Order Flow + ICT: The Complete Picture
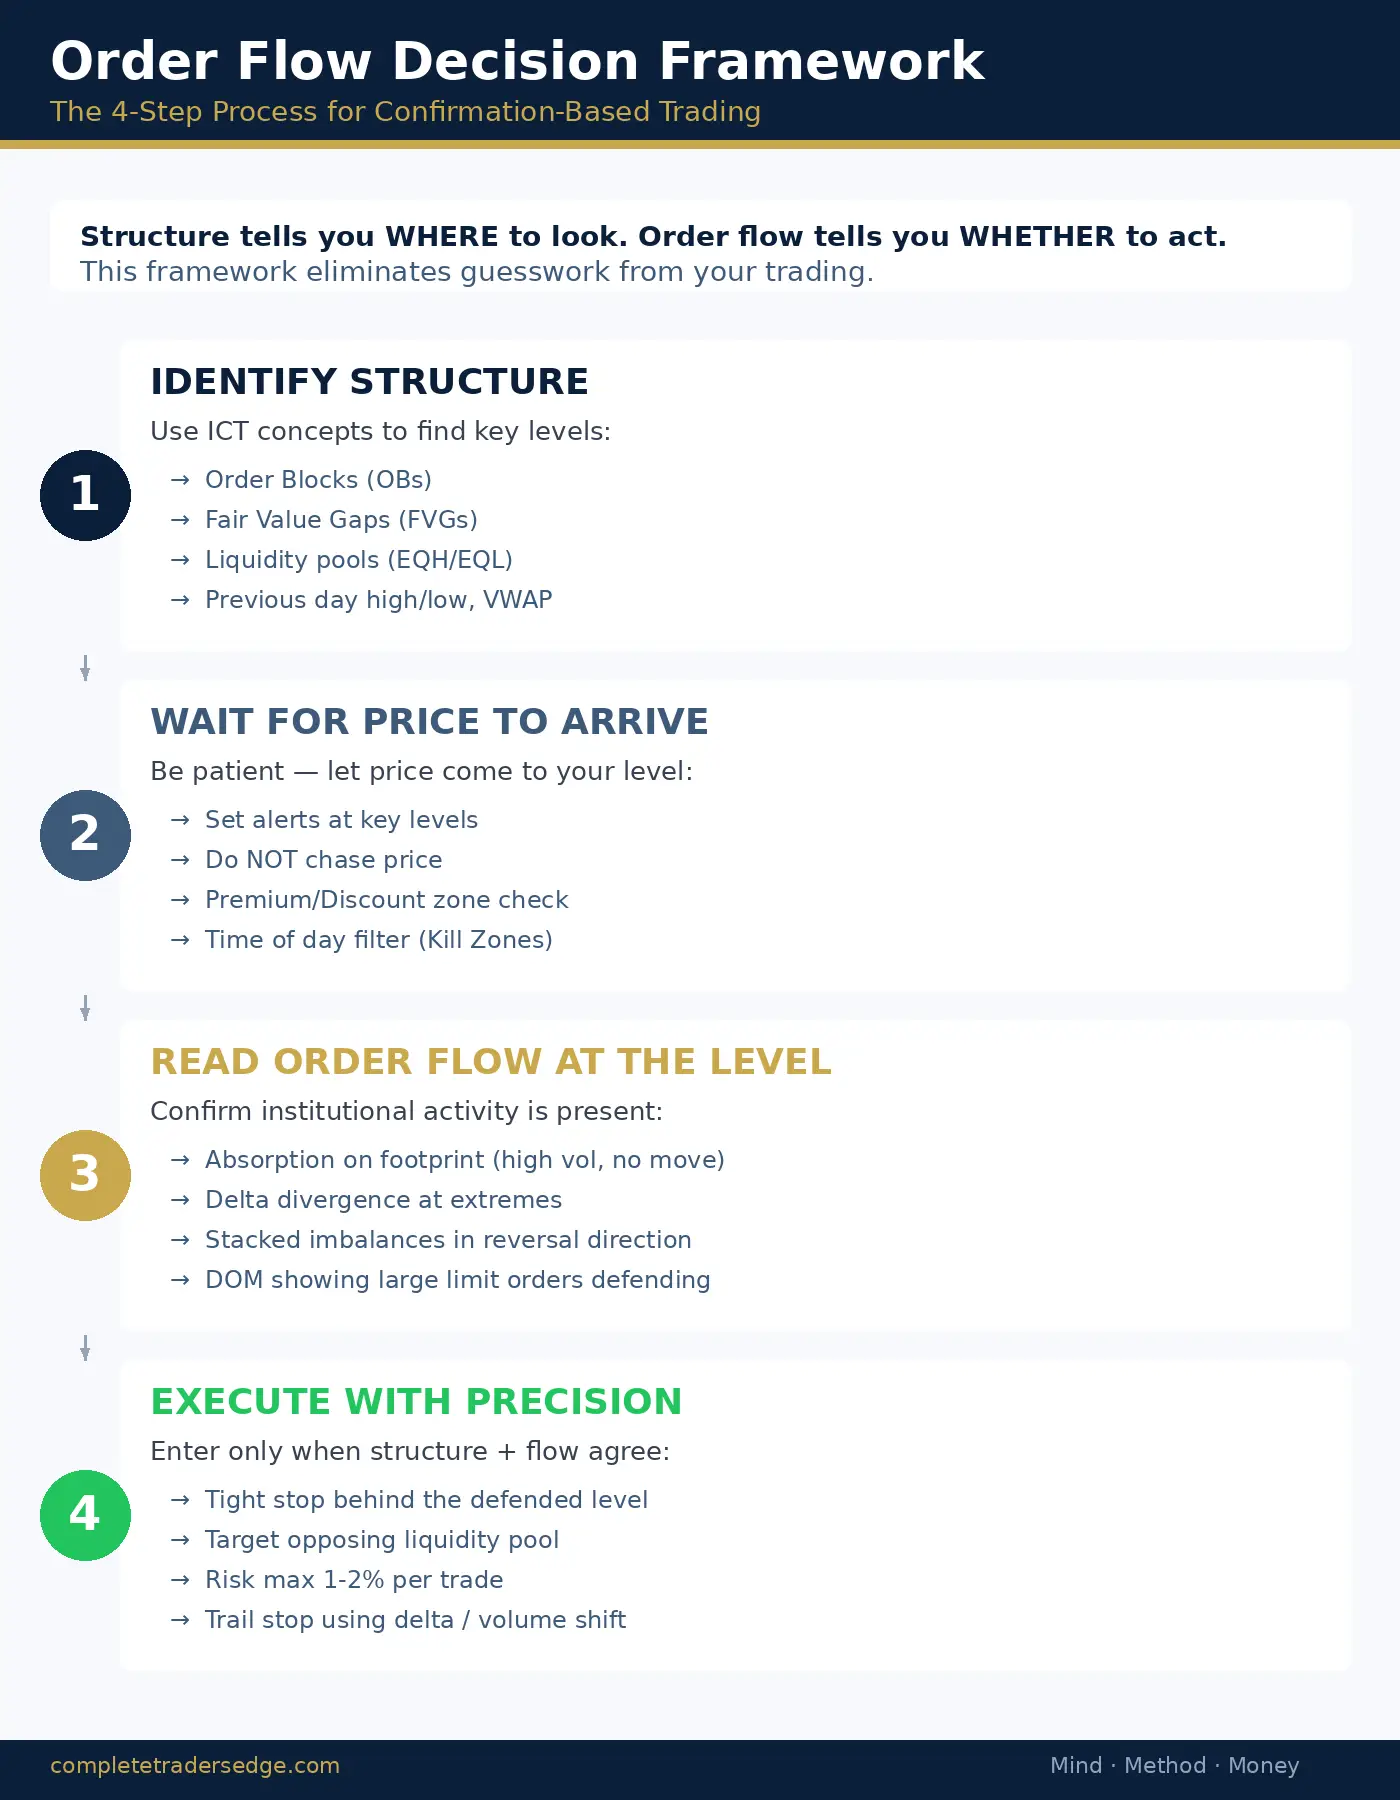
Order flow becomes most powerful when combined with structural analysis. Use ICT concepts to identify where price is likely to react, then use order flow to confirm whether institutional activity is actually present at that level. An order block without order flow confirmation is theoretical. An order block with visible absorption and aggressive reversal delta is institutional proof.
The combination eliminates the guesswork. You know where to look from structure, and you know whether to act from order flow. This is how professional traders operate — they do not guess about institutional activity; they observe it directly.
Order Flow Platforms for Retail Traders
Accessing order flow data requires specific platforms. The most popular retail-accessible options include Sierra Chart, which offers the most comprehensive footprint and order flow tools at a reasonable price. ATAS provides a user-friendly interface with strong footprint visualisation. Bookmap shows the limit order book in a visual heatmap format, making absorption and spoofing visible in real time. Quantower provides multi-asset order flow tools with a modern interface. NinjaTrader offers order flow add-ons including footprint and volumetric bars.
For futures traders, CME data provides the cleanest order flow. Forex traders face limitations because the decentralised nature of the market means no single venue captures all orders. Crypto exchanges like Binance and Bybit provide Level 2 data that enables basic order flow analysis.
📚 Related Articles:
| Order Flow Tool | What It Shows | Best For |
|---|---|---|
| Footprint chart | Buy vs sell volume at each price level within each candle | Identifying absorption, imbalance, and exhaustion at key levels |
| Level 2 / DOM | Resting limit orders at each price (order book depth) | Spotting large resting orders that may act as support/resistance |
| Volume delta | Net difference between aggressive buying and selling volume | Confirming conviction behind moves. Divergence signals potential reversals. |
| Time and Sales (tape) | Real-time record of every executed trade with size and direction | Identifying large institutional prints and block trades at key levels |
This article is adapted from The Complete Trader’s Edge
70 chapters covering Mind · Method · Money — the most comprehensive trading education framework available.
Frequently Asked Questions
What is order flow trading?
Order flow trading analyses the actual buy and sell orders hitting the market in real time, rather than relying solely on price charts. Tools like the order book (Level 2), footprint charts, and volume delta show you where large orders are being placed and absorbed. This gives you a window into institutional activity that traditional chart patterns cannot provide.
Do I need special tools for order flow analysis?
Yes. Basic charting platforms show price and volume, but genuine order flow analysis requires specialised tools: footprint charts (available on platforms like Sierra Chart and ATAS), Level 2 order book data (available through most futures brokers), and volume delta indicators. These tools are most useful for futures traders (ES, NQ, Gold futures) where exchange-based data provides genuine order information.
Can order flow analysis replace ICT concepts?
No, but it can complement them powerfully. ICT concepts tell you where institutional orders are likely resting based on price structure. Order flow tools show you the actual orders as they execute. Used together, you can identify an Order Block on the chart and then use order flow data to confirm whether institutional buying or selling is actually occurring at that level in real time.
Is order flow analysis suitable for beginners?
No. Order flow tools add complexity that is distracting for developing traders. Master price action and market structure first. Once you can read a chart profitably without order flow, adding these tools provides incremental edge. Adding them before you have a working framework creates information overload without improving decisions.
Does order flow work on forex?
Limited. Forex is an OTC (over-the-counter) market with no centralised exchange, so there is no unified order book. The “volume” shown on forex charts is tick volume (number of price changes), not actual traded volume. Order flow analysis is most reliable on exchange-traded instruments (futures: ES, NQ, Gold, BTC CME) where genuine order data exists.
From The Book
This article covers concepts from Chapter 37 of The Complete Trader’s Edge.
 The Complete Trader's Edge
The full Mind · Method · Money framework. 70 chapters.
View on Amazon →
The Complete Trader's Edge
The full Mind · Method · Money framework. 70 chapters.
View on Amazon →
 Market Mayhem
400 years of bubbles, crashes, and the pattern that keeps repeating.
Buy on Amazon →
Market Mayhem
400 years of bubbles, crashes, and the pattern that keeps repeating.
Buy on Amazon →
 Greatest Companies
How the world's greatest companies were built — and what traders learn from them.
View on Amazon →
Greatest Companies
How the world's greatest companies were built — and what traders learn from them.
View on Amazon →
 Greatest Traders
Eighty-six lives that explain the markets — Livermore to Madoff, told with the losses left in.
View on Amazon →
Greatest Traders
Eighty-six lives that explain the markets — Livermore to Madoff, told with the losses left in.
View on Amazon →