Every significant price move follows the same three-phase sequence: accumulation, manipulation, distribution. The Power of 3 is the institutional algorithm that drives market structure.
| AMD Phase | Session Timing | What Happens | Your Action |
|---|---|---|---|
| Accumulation | Asian session (8 PM-midnight EST) | Tight range forms. Liquidity builds above and below. | Mark the Asian high and low. Do not trade. |
| Manipulation | First 30-60 min of London or NY Kill Zone | Price sweeps Asian high or low, triggering stops. | Watch for sweep + reversal. Do not chase the sweep. |
| Distribution | Remainder of Kill Zone (2-4 hours) | The real move unfolds in the opposite direction of the manipulation. | Enter after ChoCH confirms the reversal. Ride the distribution. |
The ICT Power of 3, sometimes called AMD, is one of the most important models in the Smart Money framework. It describes how institutional traders consistently move price through a predictable three-phase sequence: accumulation (building a position quietly), manipulation (engineering a false move to trap retail traders and sweep liquidity), and distribution (delivering price to the true target where the position is unwound).
Once you understand this model, you stop being the trader who gets trapped in the manipulation phase and start being the trader who enters during manipulation and rides the distribution.
Phase 1: Accumulation
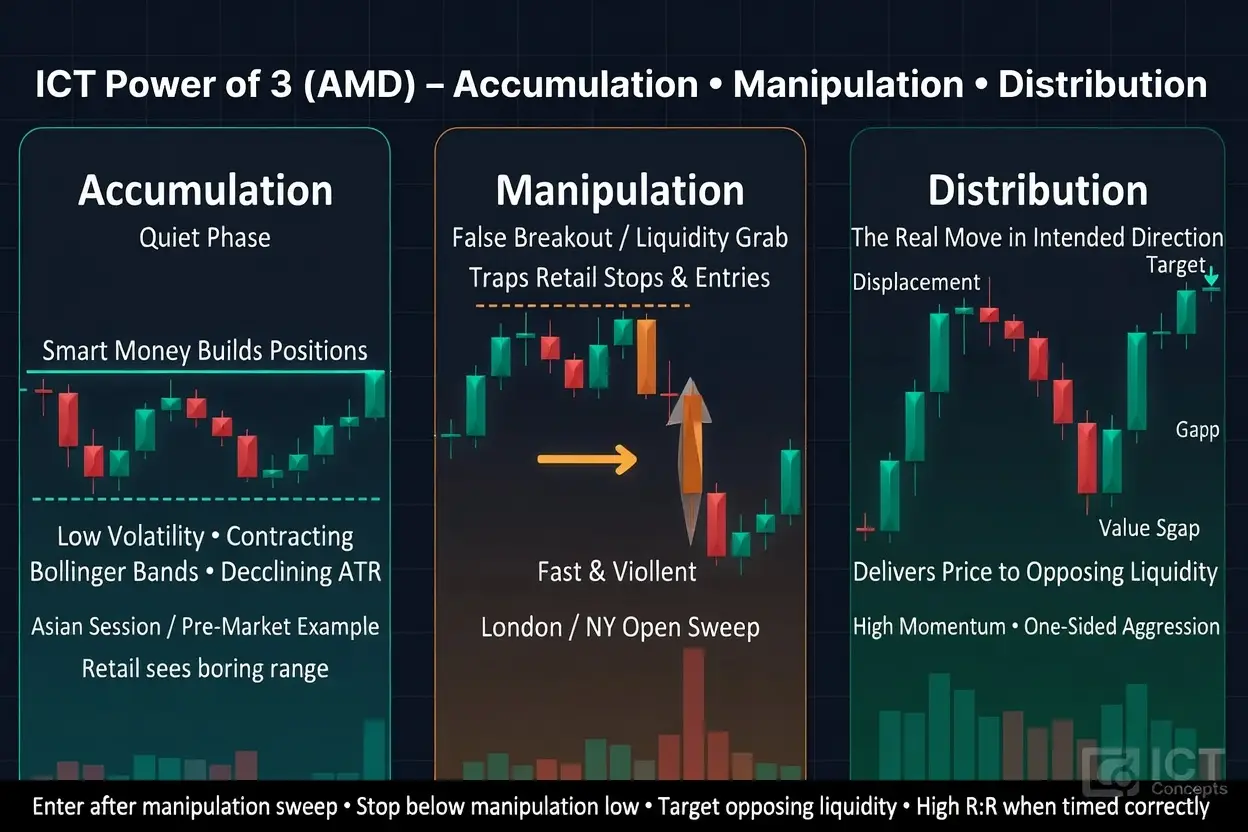
Accumulation is the quiet phase. Price consolidates in a tight range with low volatility. On the surface, nothing appears to be happening. Underneath, institutional participants are building positions in small increments to avoid tipping off the market.
The accumulation phase typically occurs during lower-volume periods, often the Asian session in forex, or the pre-market in equities. The range is narrow because institutions are deliberately keeping price contained while they fill their orders. Retail traders see a boring, ranging market and either stay out or take range-bound trades.
On a candle chart, accumulation looks like a cluster of small-bodied candles with overlapping wicks. Volume is below average. Bollinger Bands contract. ATR declines. The market appears dead. This is when the smart money is most active.
Phase 2: Manipulation
Manipulation is the false move. After accumulating a position, institutions need liquidity to complete their order. They engineer a move in the opposite direction of their intended trade to sweep stop losses and trigger breakout entries from retail traders.
If the smart money accumulated a long position during Phase 1, Phase 2 is a false breakdown. Price drops below the accumulation range, sweeping the stops of traders who were long and triggering short entries from breakout traders. Both groups provide sell-side liquidity. The stops of long traders become sell orders. The entries of short traders are also sell orders. This is the liquidity the institution needs to complete its large buy order.
The manipulation phase is typically fast and violent. It is designed to create fear and urgency. It often occurs at the open of a major session, the London open or New York open, because that is when fresh liquidity enters the market.
Phase 3: Distribution
Distribution is the real move. With the position fully accumulated and manipulation complete, price now moves aggressively in the intended direction. This is the displacement that creates fair value gaps, breaks structure, and delivers price to the opposing liquidity pool.
The distribution phase is characterised by large-bodied candles, expanding volume, and one-sided aggression. It is the move that retail traders see and wish they had caught. The traders who were stopped out during manipulation watch helplessly as price travels exactly where they expected, without them.
Distribution continues until price reaches the institutional target, which is usually the opposing liquidity pool, a key structural level, or a Fibonacci extension. At the target, the institution begins unwinding its position into the eager hands of breakout traders who enter late, providing the exit liquidity.
Power of 3 on Daily Charts
On the daily timeframe, the Power of 3 maps to the three major trading sessions. Accumulation occurs during the Asian session, when volume is lowest and the range is tightest. Manipulation occurs at the London open, which typically sweeps one side of the Asian range to generate liquidity. Distribution occurs during the New York session, which delivers the actual daily expansion in the intended direction.
This is why professional ICT traders study the Asian session range as their first step each day. The direction that London sweeps relative to the Asian range often reveals the intended direction of the day.
Power of 3 on Intraday Charts
The same three-phase structure repeats on every timeframe. On a 15-minute chart during the New York session, you can see accumulation in the first 30 minutes of the killzone, manipulation as price sweeps the session’s developing high or low, and distribution as the actual move unfolds.
On weekly charts, accumulation may span several days, manipulation occurs as price sweeps the previous week’s high or low, and distribution carries price through the rest of the week toward the weekly target.
How to Trade the ICT Power of 3
The entry is during or immediately after the manipulation phase. When you see price sweep a clearly visible level of liquidity, create a displacement candle in the opposite direction, and leave behind a fair value gap, you have your Power of 3 entry signal.
Your stop goes below the manipulation wick. Your target is the opposing liquidity. The risk-to-reward on these setups is typically 1:3 or better because you are entering near the terminus of the false move and targeting the full distribution leg.
The key discipline is patience. You must wait for the manipulation to complete before entering. Entering during accumulation means you will likely get stopped out during manipulation. Entering too late during distribution means you miss most of the move. The sweet spot is the moment manipulation ends and distribution begins.
📚 Related Articles:
Accumulation, manipulation and distribution did not begin with ICT. Richard Wyckoff described the same three-act structure in the 1930s. We audit that lineage concept by concept in the full story of Michael J. Huddleston.
This article is adapted from The Complete Trader’s Edge
70 chapters covering Mind · Method · Money — the most comprehensive trading education framework available.
Frequently Asked Questions
What is the ICT Power of 3?
The Power of 3 describes the three phases of institutional price delivery within each trading session: Accumulation (the range where liquidity builds, typically during the Asian session), Manipulation (the false move that sweeps liquidity from one side of the range), and Distribution (the real directional move that follows the manipulation). Understanding this cycle helps you identify when the “fake” move is happening and position for the real one.
How do I identify the manipulation phase in real time?
The manipulation phase typically occurs in the first 30-60 minutes of a Kill Zone. Price breaks beyond the Asian range high or low, triggering stops and breakout entries. The key signal is a sharp reversal after the break: the candle that breaks the level closes back inside the range or shows a long wick rejection. This is the liquidity sweep completing, and the distribution phase is about to begin.
Does the AMD cycle happen every day?
The pattern appears with remarkable consistency but not every single day. On days with major economic events, the cycle may be compressed or disrupted. On low-volatility days, the manipulation may be too subtle to trade. The cleanest AMD cycles occur on days with moderate volatility and clear higher timeframe directional bias.
Can I trade only the distribution phase?
Yes, and many ICT traders do exactly this. Wait for accumulation to complete (mark the range). Watch the manipulation happen (price sweeps one side). Enter only after a lower timeframe Change of Character confirms the distribution is beginning. This approach means you miss the first portion of the move but enter with much higher probability and a defined stop loss below the manipulation low.
How does AMD relate to Wyckoff methodology?
Wyckoff‘s accumulation/distribution framework describes the same institutional behaviour at a larger scale (days to weeks). ICT’s AMD cycle applies the same logic at the session level (hours). Wyckoff’s “spring” is ICT’s manipulation phase. Both describe how institutions build positions by engineering false moves before distributing in the intended direction.
From The Book
This article covers concepts from Chapter 35 of The Complete Trader’s Edge.
 The Complete Trader's Edge
The full Mind · Method · Money framework. 70 chapters.
View on Amazon →
The Complete Trader's Edge
The full Mind · Method · Money framework. 70 chapters.
View on Amazon →
 Market Mayhem
400 years of bubbles, crashes, and the pattern that keeps repeating.
Buy on Amazon →
Market Mayhem
400 years of bubbles, crashes, and the pattern that keeps repeating.
Buy on Amazon →
 Greatest Companies
How the world's greatest companies were built — and what traders learn from them.
View on Amazon →
Greatest Companies
How the world's greatest companies were built — and what traders learn from them.
View on Amazon →
 Greatest Traders
Eighty-six lives that explain the markets — Livermore to Madoff, told with the losses left in.
View on Amazon →
Greatest Traders
Eighty-six lives that explain the markets — Livermore to Madoff, told with the losses left in.
View on Amazon →