

CTE Research · Real-Money Records
The U.S. Investing Championship
Every verified result, every division, and what the leaderboard hides.
1983–1997 · 2019–present · Standings through 31 July 2026 · Updated 7 September 2026
Last updated: 7 September 2026. Built from the organiser’s official standings archive, the year-end Business Wire releases, contemporaneous press, and SEC filings. Figures we could not trace to a primary source are labelled as such rather than filled in.
Since 1983, the U.S. Investing Championship has built one of the longest public records of real-money trading performance anywhere. Every percentage on it belongs to a live brokerage account that someone nominated before the year began, and every result is checked against statements.
That makes the U.S. Investing Championship results rare. It also makes them widely misread. Most of what is written about the championship online is a list of the biggest numbers with the divisions stripped out, which is roughly like ranking sprinters and marathon runners in one table. This page does the opposite. It keeps every result inside its own division and account band, shows the full modern record, reconstructs what can actually be documented from the original era, and then does something no other public source appears to have done: it reads the month-by-month standings rather than only the year-end ones.
The month-by-month record is where the story changes.
The Championship at a Glance
| Founded | 1983, by Dr Norman Zadeh (also Norm Zada), originally as the U.S. Trading Championship |
| Paused | Mid-1990s, amid an SEC investigation. Restarted 2019 |
| Format | Calendar-year, real-money, time-weighted percentage return |
| Verification | Brokerage statements, plus live account walkthroughs when the organiser wants them |
| Account bands | $20,000+ (U.S. Investing Championship) and $1,000,000+ (Money Manager Verified Ratings) |
| Divisions | Stock and Enhanced Growth – four separate leaderboards in total |
| Entry fee | $475 for the $20,000+ championship, $1,000 for the $1m+ ratings (2026 sign-up page) |
| Prize | None in cash. Recognition, press coverage and introductions |
| 2026 field | 704 entrants as at the seven-month standings |
| Highest verified year | Tito Adhikary, +2,115.1%, 2025 Enhanced Growth, $20,000+ band |
Championship records at a glance
Four boards, four records. These are the highest verified year-end returns on each, as at the 2025 final standings. They are not comparable with each other, for reasons set out further down.
Original-era record still cited by the organiser: Robert Prechter, +444.4% in a four-month monitored options account, 1984. Full record book, including interim prints and multi-year compounds, is further down the page.
How the contest actually works
You nominate a brokerage account before the year starts. The account does not have to be yours – the rules permit a client’s account or a relative’s. Your starting value is the close on 31 December, or the close on the day you enter if you join late. From there the organiser tracks time-weighted percentage return, which strips out deposits and withdrawals by design.
There are two products running side by side on the same site. The U.S. Investing Championship proper has a $20,000 minimum. Accounts smaller than that have their profit divided by $20,000, so a tiny account cannot manufacture a headline percentage. Money Manager Verified Ratings has a $1,000,000 minimum and works the same way, with sub-minimum profit divided by $1m.
Each product then splits into two divisions:
- Stock Division. Long or short stocks and ETFs, leverage, foreign stocks, and option writing. No futures, no CFDs, no long options. Spreads are allowed if the sell side is larger than the buy side. Trade futures in this division and your entry gets moved.
- Enhanced Growth Division. Futures and long options permitted. Anything long or short, margin allowed.
That is four separate leaderboards. Comparing across them is the single most common error in coverage of this contest, and it is the one that produces the misleading “biggest return ever” tables you find elsewhere.
One further mechanical fact matters more than it sounds: appearing in the monthly standings is optional. A competitor can stay off the monthly boards entirely and surface only in the quarterly or final standings. Hold that thought – it becomes important further down this page.
How to read a championship percentage
Nine things to hold in mind before you read a single number below. They are the difference between using this record and being fooled by it.
1. It is self-selected. Traders choose to enter, and choose whether to appear month to month. The published table is not a census.
2. It is the right tail. Through ten months of 2022, 316 traders had participated and 26 of them – 8% – reported a profit. Through the first half of 2026, 688 competitors were in and 115 – 17% – reported profits, in a period when the S&P 500 rose 10.2%. Those two figures are the most useful numbers the organiser publishes.
3. Account band changes everything. A +900% year on a concentrated, margined $40,000 book is a different object from +13.5% on $1m+. Both appear below. They are not comparable.
4. Instrument set changes everything again. Enhanced Growth allows long options and futures. Stock Division does not. Putting Tito Adhikary’s +2,115.1% next to Law Wai-Sum’s +252.3% as if they raced each other is a fabrication of comparability.
5. The path is not the destination. Championship years routinely contain violent drawdowns. The monthly archive proves it, and we set that evidence out in detail below.
6. Returns are time-weighted, not money-weighted. Correct for a skill contest. Misleading if you read it as “what happened to this person’s net worth.”
7. Late entry is permitted. Enter in March and you are scored from that close. A first-quarter crash can be sidestepped; a first-quarter rally can be missed. Always check the start date on an outsized print.
8. It is not an audited composite. Statement verification is far stricter than a screenshot on X and far looser than a GIPS audit. It is not a regulated performance advertisement, and it is not a track record you could allocate outside capital to.
9. Capacity is invisible. Nothing in the percentage tells you whether the strategy survives being ten times larger. Usually it does not.
The denominator, drawn
8 of 100
2022, ten months. 316 participants, 26 reporting a profit. The S&P 500 finished the year down 19.4%.
17 of 100
2026, first half. 688 competitors, 115 reporting profits. The S&P 500 gained 10.2% over the same period.
Each dot is one entrant in a hundred. Gold dots reported a profit. Both figures are the organiser’s own, and both count reporters rather than results, so if anything they flatter the field.
Two eras, and a gap in the middle
The championship has two lives, separated by roughly two decades of silence.
The original era began in 1983. Zadeh had been teaching a course at UCLA on making money in stocks and commodities, opened a real $10,000 account and traded it in front of the class, made 140% in the quarter, was not rehired, and started the U.S. Trading Championship the same year. In its early form it ran four-month contests with separate stock, options, stocks-and-options and futures divisions – not the clean single-year, four-board structure used today. That structural difference is exactly why later “1984 winner” summaries flatten something much messier.
The modern era began in 2019 with 96 entrants. The field has grown every year since: 124, 338, 326, 352, 451, 579, and 704 in the current 2026 competition.
Between them sits a genuine documentary gap, and a genuine source conflict about when the first era ended. We deal with both below rather than papering over them.
Forty-three years in one line
- 1983Norman Zadeh starts the U.S. Trading Championship after a real-money UCLA class account returns 140% in a quarter. First contest: 74 entrants.
- 1984Robert Prechter posts +444.4% in a four-month monitored options account. Still the organiser’s headline original-era result.
- 1985–87David Ryan’s run of triple-digit stock-division wins. The Los Angeles Times reports a $43,000 account grown to $295,000.
- 1996SEC investigation opens into the contest and Zadeh’s fund business. The first era winds down.
- 1997Mark Minervini wins the stock division with +155% on $250,000. The last documented original-era result.
- 1998Cease-and-desist order against Prime Advisors, Zadeh and Goodstein. The order records Zadeh administering the contests “from 1983 to at least 1994”.
- 2000sNo competition. Roughly two decades of silence.
- 2018Restart announced in November. Two products, two divisions, statement verification.
- 2019First modern competition. 96 entrants.
- 2021Minervini wins again, twenty-four years on, with +334.8% in the $1m+ Stock Division.
- 2025Tito Adhikary sets the all-division record at +2,115.1%. Martin Luk takes the Stock Division record at +969.8%.
- 2026704 entrants, the largest field ever. Omar Barkawi’s interim print already exceeds the year-end record.
The field, 2019 to 2026
Entrants per year, organiser’s figures. 2026 is the current field at seven months.
Sevenfold growth in seven years. The field grew in six of the seven modern years and dipped once, from 338 to 326, in the 2022 bear market.
U.S. Investing Championship results by year, 2019 to 2025
Every figure in this table is a year-end result from the organiser’s official final standings or the matching year-end release. Winners are shown with the runners-up where the podium is documented. Entrant counts are the organiser’s own.
| Year | $1m+ Stock | $1m+ Enhanced Growth | $20k+ Stock | $20k+ Enhanced Growth |
|---|---|---|---|---|
| 2019 96 entrants | Sean Goodsell +10.1% | – | Leif Soreide +60.9% 2. Sean Ryan +51.8% 3. Alok Bhatia +19.5% | Travis Wilkerson +31.6% |
| 2020 124 entrants | George Tkaczuk +119.1% 2. Bill Roller +15.2% | Vivek Subramanyam +60.6% | Oliver Kell +941.1% 2. Tomas Claro +497% 3. Ryan Pierpont +448.4% | Kenneth He Huang +428.7% |
| 2021 338 entrants | Mark Minervini +334.8% 2. Vibha Jha +100.4% 3. Hsiu-Ping Peng +11.4% | Podium not traced to a primary source | Pavel P. Sterba +222.3% 2. Roy Mattox +214.4% 3. Ryan Pierpont +201% | Salvador Palma +186.3% |
| 2022 326 entrants S&P 500 −19.4% | Sam Bhatia +13.5% 2. Sean Goodsell +5.9% 3. Moritz Reinhart +1% | Maziyar Yousefizad +44.4% 2. Michael Cook +18.3% | Afzal Lokhandwala +447% 2. Gemy Zhou +440.4% 3. Sean Ryan +132% | Hieu Tuong +200.3% 2. Dan Dubyk +96.6% |
| 2023 352 entrants | Tanmay Khandelwal +129% 2. Vibha Jha +69.7% 3. Luis Carlos Tarin +61.3% | Maziyar Yousefizad +91.7% 2. Michael Cook +16.2% 3. Lei Wei +12.5% | Goverdhan Gajjala +805.1% 2. Afzal Lokhandwala +500.2% 3. Miguel Zambrano Sánchez +347.7% | Anthony Maffei +309% 2. John Rodrigues +270.4% 3. John Zachary +234.1% |
| 2024 451 entrants | Law Wai-Sum +353.9% 2. Judy Lai +273.8% 3. Deepak Uppal +153.2% | Brandi Archer +90.7% 2. Matthew Pryzby +59.1% 3. Warren Straub +39.6% | Judy Lai +449.1% 2. Christian Flanders +433.5% 3. Leos Mikulka +409.6% | Brandon Frenchak +482.6% 2. Anindo Majumdar +389.3% 3. Florian Philippi +311% |
| 2025 579 entrants | Law Wai-Sum +252.3% 2. Christian Flanders +167.5% 3. Clement Ang +140.4% | Bob Weissman +115.4% 2. David Forehand +108.3% 3. Vikash Raniga +95.7% | Martin Luk +969.8% 2. Rajnus Capital +382% 3. Adrian Law +264% | Tito Adhikary +2,115.1% 2. Bob Doviak +857.3% 3. Thawin Suksathaporn +299.4% |
The 2019 $1m+ result is published as a combined board. Where a podium position is blank, no primary source we reviewed sets it out.
The 2026 competition, in progress
704 entrants. These are the standings through 31 July 2026, published on 26 August. They are interim. Leaders at seven months are not champions, and this page will not treat them as such.
| Board | Leader at 31 July 2026 | Second | Third |
|---|---|---|---|
| $1m+ Stock | Jandy Lam +60% | George Tkaczuk +38.1% | Sheri Marcus +31.9% |
| $1m+ Enhanced Growth | Vikash Raniga +104.5% | Baran Kayhan +73.5% | Daniel Lee +54% |
| $20k+ Stock | Tom Doub +982.3% | Martin Luk +868.6% | Victor M +256.9% |
| $20k+ Enhanced Growth | Omar Barkawi +2,313% | Tito Adhikary +1,626.6% | Emanuela Elias +230% |
2026 is already past the record
+2,313%
Omar Barkawi, seven months into 2026, is above the all-division year-end record of +2,115.1% that Tito Adhikary set over the whole of 2025. Adhikary is second on the same board at +1,626.6%.
The year is not over. The section below shows what has happened to seven-month leaders before. Check back after the January finals.
Tom Doub, a former clinical psychologist, is also close to the all-time Stock Division record with five months still to run.
The organiser’s own summary of the first half of 2026 is worth reading against those numbers. 688 competitors, 115 reporting profits. Seventeen per cent, in a period when the S&P 500 gained 10.2%.
Explore the boards yourself
Filter by year, account band and division, or type a name to trace one trader across every year we hold. The Path Tracker tab is the month-by-month evidence behind the section that follows.
CTE Research Tool
U.S. Investing Championship Explorer
Filter every published board by year, account band and division. Then switch to Path Tracker to see what happened between the months.
Thirteen cases from the official monthly archive. The bar is the published standing at that point in the year. The last bar is where the year actually ended.
Data: the organiser's published standings and year-end releases. Final standings for 2023 to 2025 are complete boards; 2019 to 2022 are podiums only; 2026 is interim through 31 July. Percentages are time-weighted returns on real accounts. Past performance is no guarantee of future results.
Original research: what the monthly boards show that the year-end tables do not
Almost everything written about this competition works from the year-end press release. That release is a photograph taken on 31 December. The organiser also publishes a monthly standing for every month of every modern year, and those boards are still online. Read in sequence, they tell a completely different story from the annual table.
We went through the published monthly archive from 2023 to the current 2026 competition and tracked what happened to the leaders between the months. Three patterns come out of it, and none of them appear in the promotional coverage.
Pattern one: the leaders give back enormous amounts of ground
The final number is frequently well below the peak the same trader posted earlier in the same year.
Martin Luk, 2025, $20k+ Stock. Eleven-month standing: +1,358.2%. Final: +969.8%. He won the division, set what the organiser called a world record, and still surrendered close to 390 percentage points in December.
Bob Doviak, 2025, $20k+ Enhanced Growth. Six months: +1,110.1%. Seven months: +1,145%. Eight months: +1,174.5%. Final: +857.3%.
Leos Mikulka, 2024, $20k+ Stock. Eleven-month standing: +960.4%, comfortably leading the division and within touching distance of the all-time stock record. Final: +409.6%, third place. One month erased more than half the year.
Gowthaman Vijayan, 2025, $20k+ Stock. Five months: +262.5%. Eight months: +235.1%. Final: +42.5%.
Mikulka’s year is the one worth sitting with. A trader who was up more than 960% at the end of November finished the year at 409.6% and was not the champion. Read only the final table and you see a solid third place. Read the monthly boards and you see a trader who held the biggest number in the contest and could not hold it for four more weeks.
Pattern two: leaders vanish from the boards entirely
Because monthly listing is optional, a competitor who stops reporting simply disappears. The archive is full of traders who led a division and then were never published again.
| Trader | Board | Peak published standing | What happened next |
|---|---|---|---|
| James Hatzigiannis | 2024, $20k+ Stock | +584.9% at six months, leading the division | Not published on any subsequent 2024 board, including the final |
| Y. Chiu | 2025, $20k+ Stock | +779.9% at seven months, leading the division | +635.1% at eight months, then absent from the nine, ten, eleven-month and final boards |
| Dr Terry Potter | 2026, $20k+ Enhanced Growth | +1,678.8% at three months – the organiser called it a three-month record for any division | Absent from the April, May, June and July boards |
| Tin Chun Jimmy Li | 2026, $20k+ Stock | +431.5% at five months, having led the division since January | Absent from the June and July boards |
Be careful with what this does and does not prove. Absence from a monthly board is not evidence of a loss. Reporting is voluntary, people get busy, and a trader can legitimately choose to reappear only in the final standings. But the pattern is consistent enough to matter: the biggest interim numbers in this contest have a poor record of surviving to December. When you see a spectacular six-month print, the base rate says wait.
Pattern three: the winner is often invisible until the end
The reverse also happens, and it is the strongest single argument for reading the finals rather than following the monthlies.
In 2022, the ten-month board for the $20,000+ Stock Division was led by Gemy Zhou at +406.7%, with Sean Ryan second at +153%. Afzal Lokhandwala, who won that division, does not appear on that board at all. He surfaced at year-end with +447%.
In 2024, Judy Lai sat fourth in the $20,000+ Stock Division at eleven months on +384.7%. She finished first on +449.1%, having overtaken three traders including the one on +960.4%.
And in 2023, Goverdhan Gajjala appears on the four-month board at +90.7% and the five-month board at +180.4%, then disappears from the six, seven and eight-month standings before returning at nine months on +266.5% and finishing the year at +805.1%. That absence lines up precisely with the period Business Insider documented after reviewing his statements: a June stretch of seventeen consecutive losing trades and a month that closed down 44.4%. He went quiet, reset, and then produced the second-largest annual return in the contest’s history to that point.
That is the honest shape of a championship year. Not a smooth curve. A brutal one, with at least one stretch that would have ended most people’s participation.
What this means for how you read the record
The year-end table is a survivorship funnel applied to a survivorship funnel. First, only people confident enough to nominate an account enter. Second, only people willing to report appear. Third, only the ones still standing in December make the final board. The 8% figure from 2022 and the 17% figure from the first half of 2026 are the closest the organiser comes to publishing the denominator, and both should be read next to every triple-digit return on this page.
Free Research Sheet
Take the whole record with you
Five pages. Every modern winner by board, the 2026 interim standings, the peak-versus-final and vanished-leader tables, the record book, the original era with A–E source grades, the three unresolved facts, the SEC chapter, and seven rules for reading any number from this contest. No email required.
Open data
Results dataset, 2019–2026 (CSV) 450 rows · year, band, division, rank, trader, return, record status, source
Path Tracker dataset (CSV) Every published monthly checkpoint for the thirteen leader cases above
Both files are the organiser’s published figures, transcribed and structured. Free to reuse with a link back to this page.
U.S. Investing Championship records by division
Kept inside its own band and division, because that is the only way these numbers mean anything.
| Record | Holder | Result |
|---|---|---|
| Highest year-end return, any division | Tito Adhikary, 2025 | +2,115.1% – $20k+ Enhanced Growth |
| Highest year-end return, $20k+ Stock | Martin Luk, 2025 | +969.8% – passing Oliver Kell’s +941.1% from 2020 |
| Highest year-end return, $1m+ Stock | Law Wai-Sum, 2024 | +353.9% – passing Minervini’s +334.8% from 2021, which had passed Tkaczuk’s +119.1% from 2020 |
| Highest year-end return, $1m+ Enhanced Growth | Bob Weissman, 2025 | +115.4% |
| Highest three-month print | Dr Terry Potter, Q1 2026 | +1,678.8% – interim, not a year-end result |
| Largest open interim print | Omar Barkawi, seven months of 2026 | +2,313% – still running |
| Two-year compound, $1m+ Stock | Law Wai-Sum, 2024–25 | +1,499% against an S&P 500 total return of 47% (organiser’s figures) |
| Two-year compound, $20k+ Stock | Martin Luk, 2024–25 | +3,998% from +283.1% then +969.8% (organiser’s figure) |
| Longest unbroken profitable run since the restart | Sean Ryan, 2019–2025 | Seven entries, seven profits, +6,232% combined against an S&P 500 total return of 205% (organiser’s figures) |
| Original-era record still cited by the organiser | Robert Prechter, 1984 | +444.4% in a monitored real-money options account over a four-month contest |
The original era, 1983 to the mid-1990s
There is no complete official table of the first era. The organiser’s live archive does not carry it, no downloadable winners list exists, and the early results survive in newspaper reporting, trading memoirs, publisher biographies and regulatory files. Treat any clean, fully filled-in 1983–1997 winners table with caution: most of it cannot be traced to a primary source.
What follows is what can actually be attributed, with a confidence grade on each line. A is an official or primary record. B is contemporaneous press. C is a first-person or book account written later. D is a secondary compilation. E is an uncorroborated claim.
| Year / contest | Result | Source | Grade |
|---|---|---|---|
| 1983, first contest | 74 entrants. Marty Schwartz placed third in both futures and stocks/options | Pit Bull, Schwartz | C |
| 1983, second contest (1 Aug – 1 Dec) | 133 entrants. Schwartz sixth in futures, +69.2%. Contest winner reported at +388.4% on a minimum-sized account | Pit Bull | C |
| 1983, overall | Frankie Joe named Champion Trader: +181.3% futures, +70.6% stocks and options | Pit Bull | C |
| 1984, four-month options contest | Robert Prechter Jr +444.4% in a monitored real-money options account | Prechter / Elliott Wave International, restated in press from 1985 onward | B/C |
| 1984 | Marty Schwartz, widely reported at +781%. Schwager also records nine of ten four-month contests averaging 210% non-annualised | Schwager, Market Wizards; later compilations | C/D |
| 1985, stock division | David Ryan +161% | Schwager; Los Angeles Times, 29 June 1986 | B/C |
| 1986 | David Ryan, approximately +160% | Schwager | C |
| 1987, two-year stocks category | David Ryan first, turning $43,000 into $295,000 – a gain of 578%. Same account was up a further 90% after seven weeks of 1987 | Los Angeles Times, 1 March 1987 | B |
| 1987, one-year stocks category | Robert Gunther +223.9%, a broker at L.F. Rothschild | Los Angeles Times, 1 March 1987 | B |
| 1987, overall | Robert Prion +232.6% | Los Angeles Times, 6 February 1990 | B |
| 1997, stock division | Mark Minervini +155%, trading $250,000 of his own money, long-only against leveraged futures and options accounts | Minervini, first-person; restated in the organiser’s 2021 year-end release | B |
Secondary summaries also report a 1989 stock title for Dennis Ardizzoni at +231.2% in the under-$50,000 category, a +133.9% result for Robert Prion in the $50,000+ category the same year, and a second-place 1990 futures result of roughly +438% for Michael King preserved in a CFTC decision citing Barron’s of 4 February 1991. We have not re-checked those against the original clippings and do not present them as verified. Todd Butterfield’s claim of twelfth place in the 1984 futures division at +31.9% among 85 entrants is his own and is included only as colour.
The David Ryan year problem
Every modern release from the organiser calls David Ryan a three-time first-place finisher. The years are less settled than the shorthand suggests.
Secondary compilations assign him 1985, 1986 and 1987. Minervini’s own book recalls Ryan winning three years in a row between 1984 and 1986. Schwager’s account gives 1985 as a win at 161%, 1986 as a second place at around 160%, and 1987 as another triple-digit first place, which does not sit comfortably with “three consecutive titles.” The Los Angeles Times of 1 March 1987 is the cleanest contemporaneous record available and describes a two-year stocks category win on an account that had “won him first place two years ago.”
Our position: three mid-1980s titles is safe, the exact year assignment is not. Anyone publishing a precise 1985/1986/1987 table without the caveat is repeating a compilation rather than a source. Our profile of Mark Minervini and our profile of David Ryan both use the 1985–1987 assignment because it is the most commonly documented; this page records the disagreement.
The names with no numbers
The organiser’s homepage lists prior participants including Paul Tudor Jones, Louis Bacon, Dr Edward O. Thorp, Mark Strome, Doug Kass, Sheen Kassouf, Tom Basso, Cedd Moses, Gil Blake, Gerald Appel and Bruno Combier. In every source we reviewed, those names appear without a year and without a return.
You will find articles asserting that Paul Tudor Jones won the championship in a particular year with a particular percentage. We could not find a primary source for any such claim. The honest formulation is the one the organiser himself uses: they are named as prior participants and top performers. That is all the record supports.
When did the first era actually end?
Four sources, four different answers, and they cannot all be right.
1983 to 1993. The November 2018 press release announcing the restart describes Dr Norman Zadeh as having “ran the prior competitions from 1983 through 1993.”
1983 to 1997. Every modern year-end release states that the competition “began in 1983 and ran for fifteen years.” Fifteen years from 1983 lands on 1997, and Minervini’s documented 1997 win supports it.
Shut down in 1996. Institutional Investor reported in October 2020 that the SEC opened an investigation into the competition and Zadeh’s firm in 1996, “effectively shutting down the contest,” and that a cease-and-desist order followed in 1998. The same article places that investigation during Minervini’s run.
1983 to “at least 1994.” The SEC’s own 1998 order, the only primary regulatory document in this set, states that Zadeh “administered two nationwide investment contests” from 1983 “to at least 1994.” Read literally, that is consistent with 1997 and silent on it.
We are not going to quietly pick one. The most likely reconstruction is that the contest wound down over the mid-1990s under regulatory pressure while a final competition or two completed, but that is inference, not documentation. The one hard anchor is Minervini’s 1997 result, which is corroborated by the organiser’s own later releases.
The regulatory chapter
This belongs on the first page of any honest account of the championship, and it is usually missing.
In or around 1992, roughly a decade after starting the competition, Zadeh went into the investment business himself. With Jeffrey Goodstein he founded Prime Advisors and raised around $159 million from about 400 investors. He has said publicly that he reverse-engineered a trading strategy from one of the competitors.
The SEC’s 1998 administrative and cease-and-desist proceeding against Prime Advisors, Zadeh and Goodstein found that the respondents sold unregistered securities in six hedge fund limited partnerships that were themselves unregistered investment companies, and that Zadeh failed to make and keep required books and records for advisory clients. Without admitting or denying the findings, all three were censured and consented to cease-and-desist orders. Civil penalties were $137,500 for Prime Advisors, $165,000 for Zadeh and $27,500 for Goodstein.
The relevant detail for anyone reading championship results: published contest results carried a telephone number, and callers were solicited into the Prime Advisors partnerships. Zadeh’s own comment to Institutional Investor was that “we were soliciting people and didn’t know them well enough.”
None of this makes the modern results false. The verification process today is what it is, and the standings are checked against statements. But a competition whose founder once used its published results as a funnel into his own funds deserves to be read with that history visible rather than buried.
The O’Neil and Minervini cluster
A large share of the modern winners come from one lineage. This is a documented fact rather than an inference, and it cuts both ways.
- David Ryan was William O’Neil’s protégé and the three-time mid-1980s champion.
- Sean Ryan, his son, is the only competitor the organiser identifies as having entered every year since the restart and reported a profit in each.
- Mark Minervini won in 1997 and again in 2021, and has publicly counted his Minervini Private Access clients on the modern leaderboards.
- Oliver Kell, the 2020 $20,000+ Stock winner, trades in the CAN SLIM lineage.
- Goverdhan Gajjala, the 2023 winner of the same division, is an MPA client.
- Law Wai-Sum is described by the organiser as a student of Minervini. His wife Judy Lai won the $20,000+ Stock Division in 2024 while he won the $1m+ board.
- Bob Weissman, the 2025 $1m+ Enhanced Growth winner, is listed as Minervini Private Access.
Two readings are true at once. A specific school of price-and-volume growth trading – base breakouts, leadership, market-direction filters – genuinely does produce a disproportionate number of championship results. And that school is also a commercial education business whose principal has an obvious interest in the leaderboard being read a certain way. Report both, then get on with it.
One consequence for method: most modern winners are trading momentum continuation in leading stocks. Do not force an order-flow or ICT frame onto these books. That is not what the record shows.
From the book
Five championship names, five chapters in Greatest Traders
Every chapter of Greatest Traders opens with an engraved mark drawn for that trader. These five run straight through the championship story on this page.
Marty SchwartzChapter 11
Mark MinerviniChapter 20
William O’NeilChapter 23
Paul Tudor JonesChapter 26
Read our profiles of Mark Minervini, Marty Schwartz and David Ryan, or see all eighty-six marks on the Greatest Traders page.
Persistence beats spikes
The useful question about any leaderboard is who did it more than once. Measured that way, the most impressive record on the modern boards belongs to a trader who has never won one.
Sean Ryan has entered all seven post-restart competitions and reported a profit in every one: +51.8%, +128%, +18%, +132%, +151.4%, +40.8% and +88.8%. The organiser puts the combined gain at +6,232% against an S&P 500 total return of 205% over the same window. He has won nothing. He finished second in 2019, thirteenth in 2020, thirtieth in 2021. He is, on the evidence available, the most consistent trader in the modern era of the contest.
Others worth watching for the same reason:
- Vibha Jha – +155.2% in 2020, +100.4% in 2021 (second, $1m+), +69.7% in 2023 (second, $1m+), +78.2% in 2024. Persistence at institutional size, which is much harder than persistence at $40,000.
- George Tkaczuk – won the $1m+ Stock Division in 2020 and was still on the board in 2025 (+86.3%) and 2026. Six years of showing up.
- Maziyar Yousefizad – back-to-back $1m+ Enhanced Growth wins in 2022 and 2023, from a bank risk-analyst background.
- Afzal Lokhandwala – +447% and the division win in 2022, +500.2% and second place in 2023.
- Christian Flanders – +433.5% for second in the 2024 $20k+ Stock Division, then +167.5% for second in the 2025 $1m+ Stock Division. A rare documented step up in account band.
- Martin Luk – +283.1% in 2024, +969.8% in 2025.
Set those against the vanishing leaders in the table further up and the shape of the thing becomes clear. A single enormous year proves that someone took a great deal of risk and it worked. A string of positive years across different market regimes is a much better argument that there is a process underneath.
Reading the championship through Mind, Method and Money
Mind. The calendar year is the real opponent. Minervini has said he was trailing at the halfway mark of his 1997 win. Gajjala went through seventeen losing trades in a row and a 44.4% down month on the way to +805.1%. Every winner’s year contains a stretch that would have broken a less durable temperament. The psychological event to prepare for is not the win, it is the June.
Method. There is no single winning style. Day-traded small caps, swing-traded growth leaders, futures and long options, and conservative large books in a bear year have all won boards. What the winners share is a defined, repeatable process applied for twelve months, not a secret setup.
Money. The account band and the instrument set are the story. The record lives in the $20,000+ band because concentration and leverage on a small book produce the percentages. That is a structural fact about the contest, not evidence that small accounts are better. Never quote a return from this competition without stating both the band and the division. If you take one habit from this page, take that one. The framework behind it is set out in The Three Pillars: Mind, Method and Money.
Frequently asked questions
What is the U.S. Investing Championship?
A real-money, calendar-year trading competition founded in 1983 by Dr Norman Zadeh. Competitors nominate a brokerage account before the year begins and are ranked by time-weighted percentage return, verified against brokerage statements. It ran through the 1990s, paused, and restarted in 2019. There is no cash prize.
Who holds the U.S. Investing Championship record?
Tito Adhikary holds the highest verified year-end return of any division at +2,115.1%, set in the 2025 $20,000+ Enhanced Growth Division. The Stock Division record is Martin Luk’s +969.8% in 2025. The $1m+ Stock record is Law Wai-Sum’s +353.9% in 2024. These are four separate leaderboards and the numbers are not interchangeable.
Who won the U.S. Investing Championship in 2025?
Four winners, one per board. Law Wai-Sum took $1m+ Stock at +252.3%, his second consecutive win. Bob Weissman took $1m+ Enhanced Growth at +115.4%. Martin Luk took $20,000+ Stock at +969.8%. Tito Adhikary took $20,000+ Enhanced Growth at +2,115.1%. There were 579 entrants.
Is the U.S. Investing Championship legitimate?
The verification is real: entrants nominate an account in advance and results are checked against brokerage statements, with live account walkthroughs when the organiser wants them. It is stricter than social-media performance claims. It is not an audited GIPS composite, not a regulated performance advertisement, and the founder settled an SEC cease-and-desist proceeding in 1998 relating to soliciting investors through the published contest results. Treat it as a verified leaderboard, not a fund track record.
How much does it cost to enter the U.S. Investing Championship?
As at the 2026 sign-up page, $475 for the $20,000+ United States Investing Championship and $1,000 for the $1,000,000+ Money Manager Verified Ratings. The prize is recognition and press coverage, not money.
How many people actually make money in the competition?
Far fewer than the leaderboard suggests. Through ten months of 2022, 26 of 316 participants – 8% – reported a profit. Through the first half of 2026, 115 of 688 – 17% – reported profits while the S&P 500 was up 10.2%. Those are the organiser’s own figures.
Did Paul Tudor Jones win the U.S. Investing Championship?
The organiser lists him among prior participants and top performers, alongside Louis Bacon, Edward O. Thorp and Mark Strome. No primary source we reviewed assigns him a year or a return. Any article that gives Paul Tudor Jones a specific championship year and percentage has invented it.
How many times has Mark Minervini won?
Twice, twenty-four years apart. He won the Stock Division in 1997 with +155% trading $250,000 of his own money, and the $1,000,000+ Stock Division in 2021 with +334.8%, which broke the existing record for that band.
Where can I see the current standings?
The organiser publishes monthly, quarterly and final standings at financial-competitions.com, with the $1m+ boards also at moneymanagerratings.com. This page summarises and cross-checks that archive rather than duplicating it, and is refreshed after each year-end release.
Methodology and sources
Everything on this page comes from one of five source classes, in descending order of weight.
- Official standings. The organiser’s live boards and previous-standings archive, including the full monthly series used for the path analysis above.
- Year-end and interim releases. The organiser’s Business Wire announcements from January 2020 onward, which are the primary record for the modern finals and for the entrant counts.
- Contemporaneous press. Los Angeles Times reporting from 1986, 1987 and 1990 for the original era, and Business Insider’s 2024 profile of Goverdhan Gajjala, in which the reporter reviewed his statements.
- Regulatory filings. SEC Release 33-7560, the 31 July 1998 order in the Prime Advisors proceeding (Administrative Proceeding File 3-9664).
- First-person and book accounts. Schwager’s Market Wizards, Schwartz’s Pit Bull, Minervini’s own statements, and Elliott Wave International’s biography of Robert Prechter.
Where a figure is widely repeated but we could not trace it to a primary source, we have said so on the line rather than dropping it or laundering it. Where two sources conflict, we show both.
Update policy. The modern results table is refreshed after each official year-end release, normally in late January or early February. The in-progress table is refreshed once mid-year and again at year-end. We do not chase monthly prints, because monthly leaders in this competition have a demonstrably poor record of remaining leaders.
Download. The whole record is available as a free five-page research sheet: CTE Research Sheet – The U.S. Investing Championship (PDF). No email required. If you cite it, a link back to this page is appreciated.
Corrections. If you hold an original standings sheet, a contemporaneous clipping, or a primary document covering any year between 1983 and 1997, we want it. The gap in the public record for that period is real, and closing it properly is worth more than filling it quickly.
The Collection
Four books. One framework.
Mind · Method · Money runs through all four. The newest one turns the framework on the people.
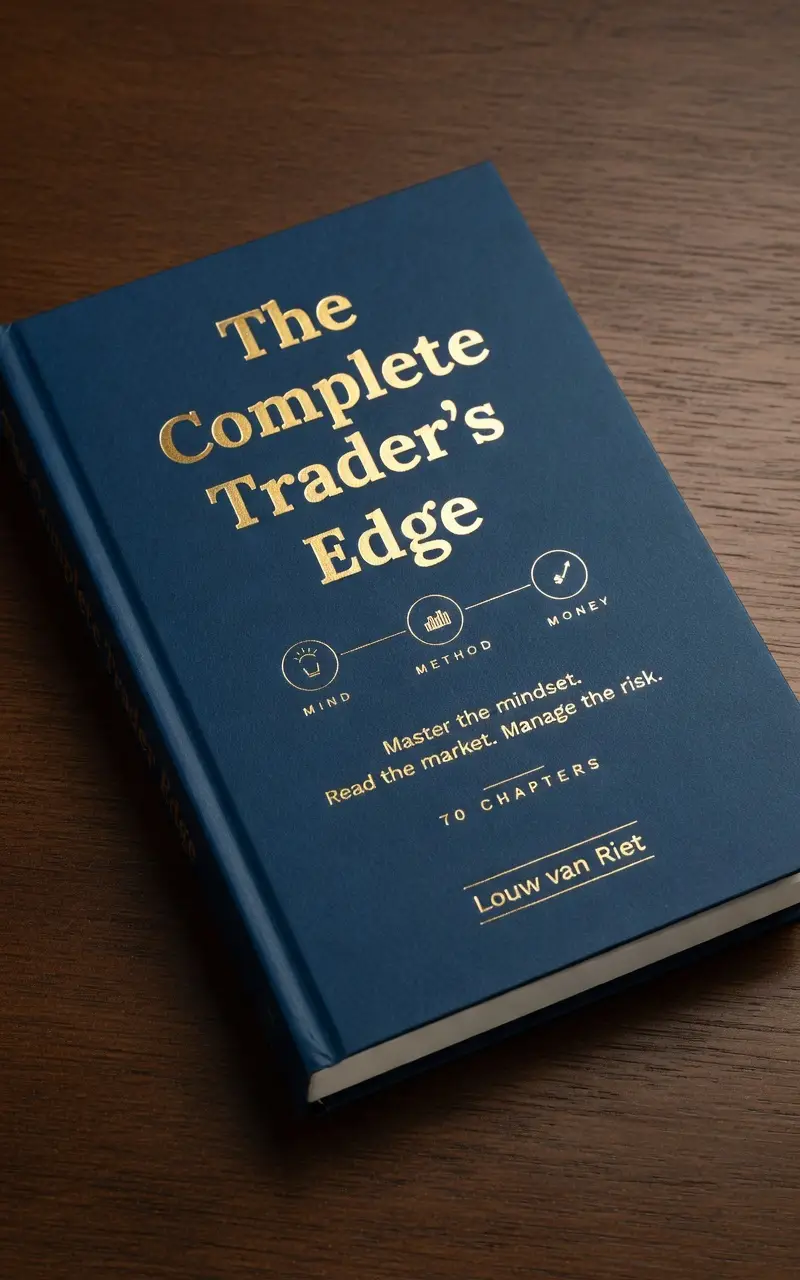 The Complete Trader’s EdgeThe framework, taught from the ground up.
Vol II
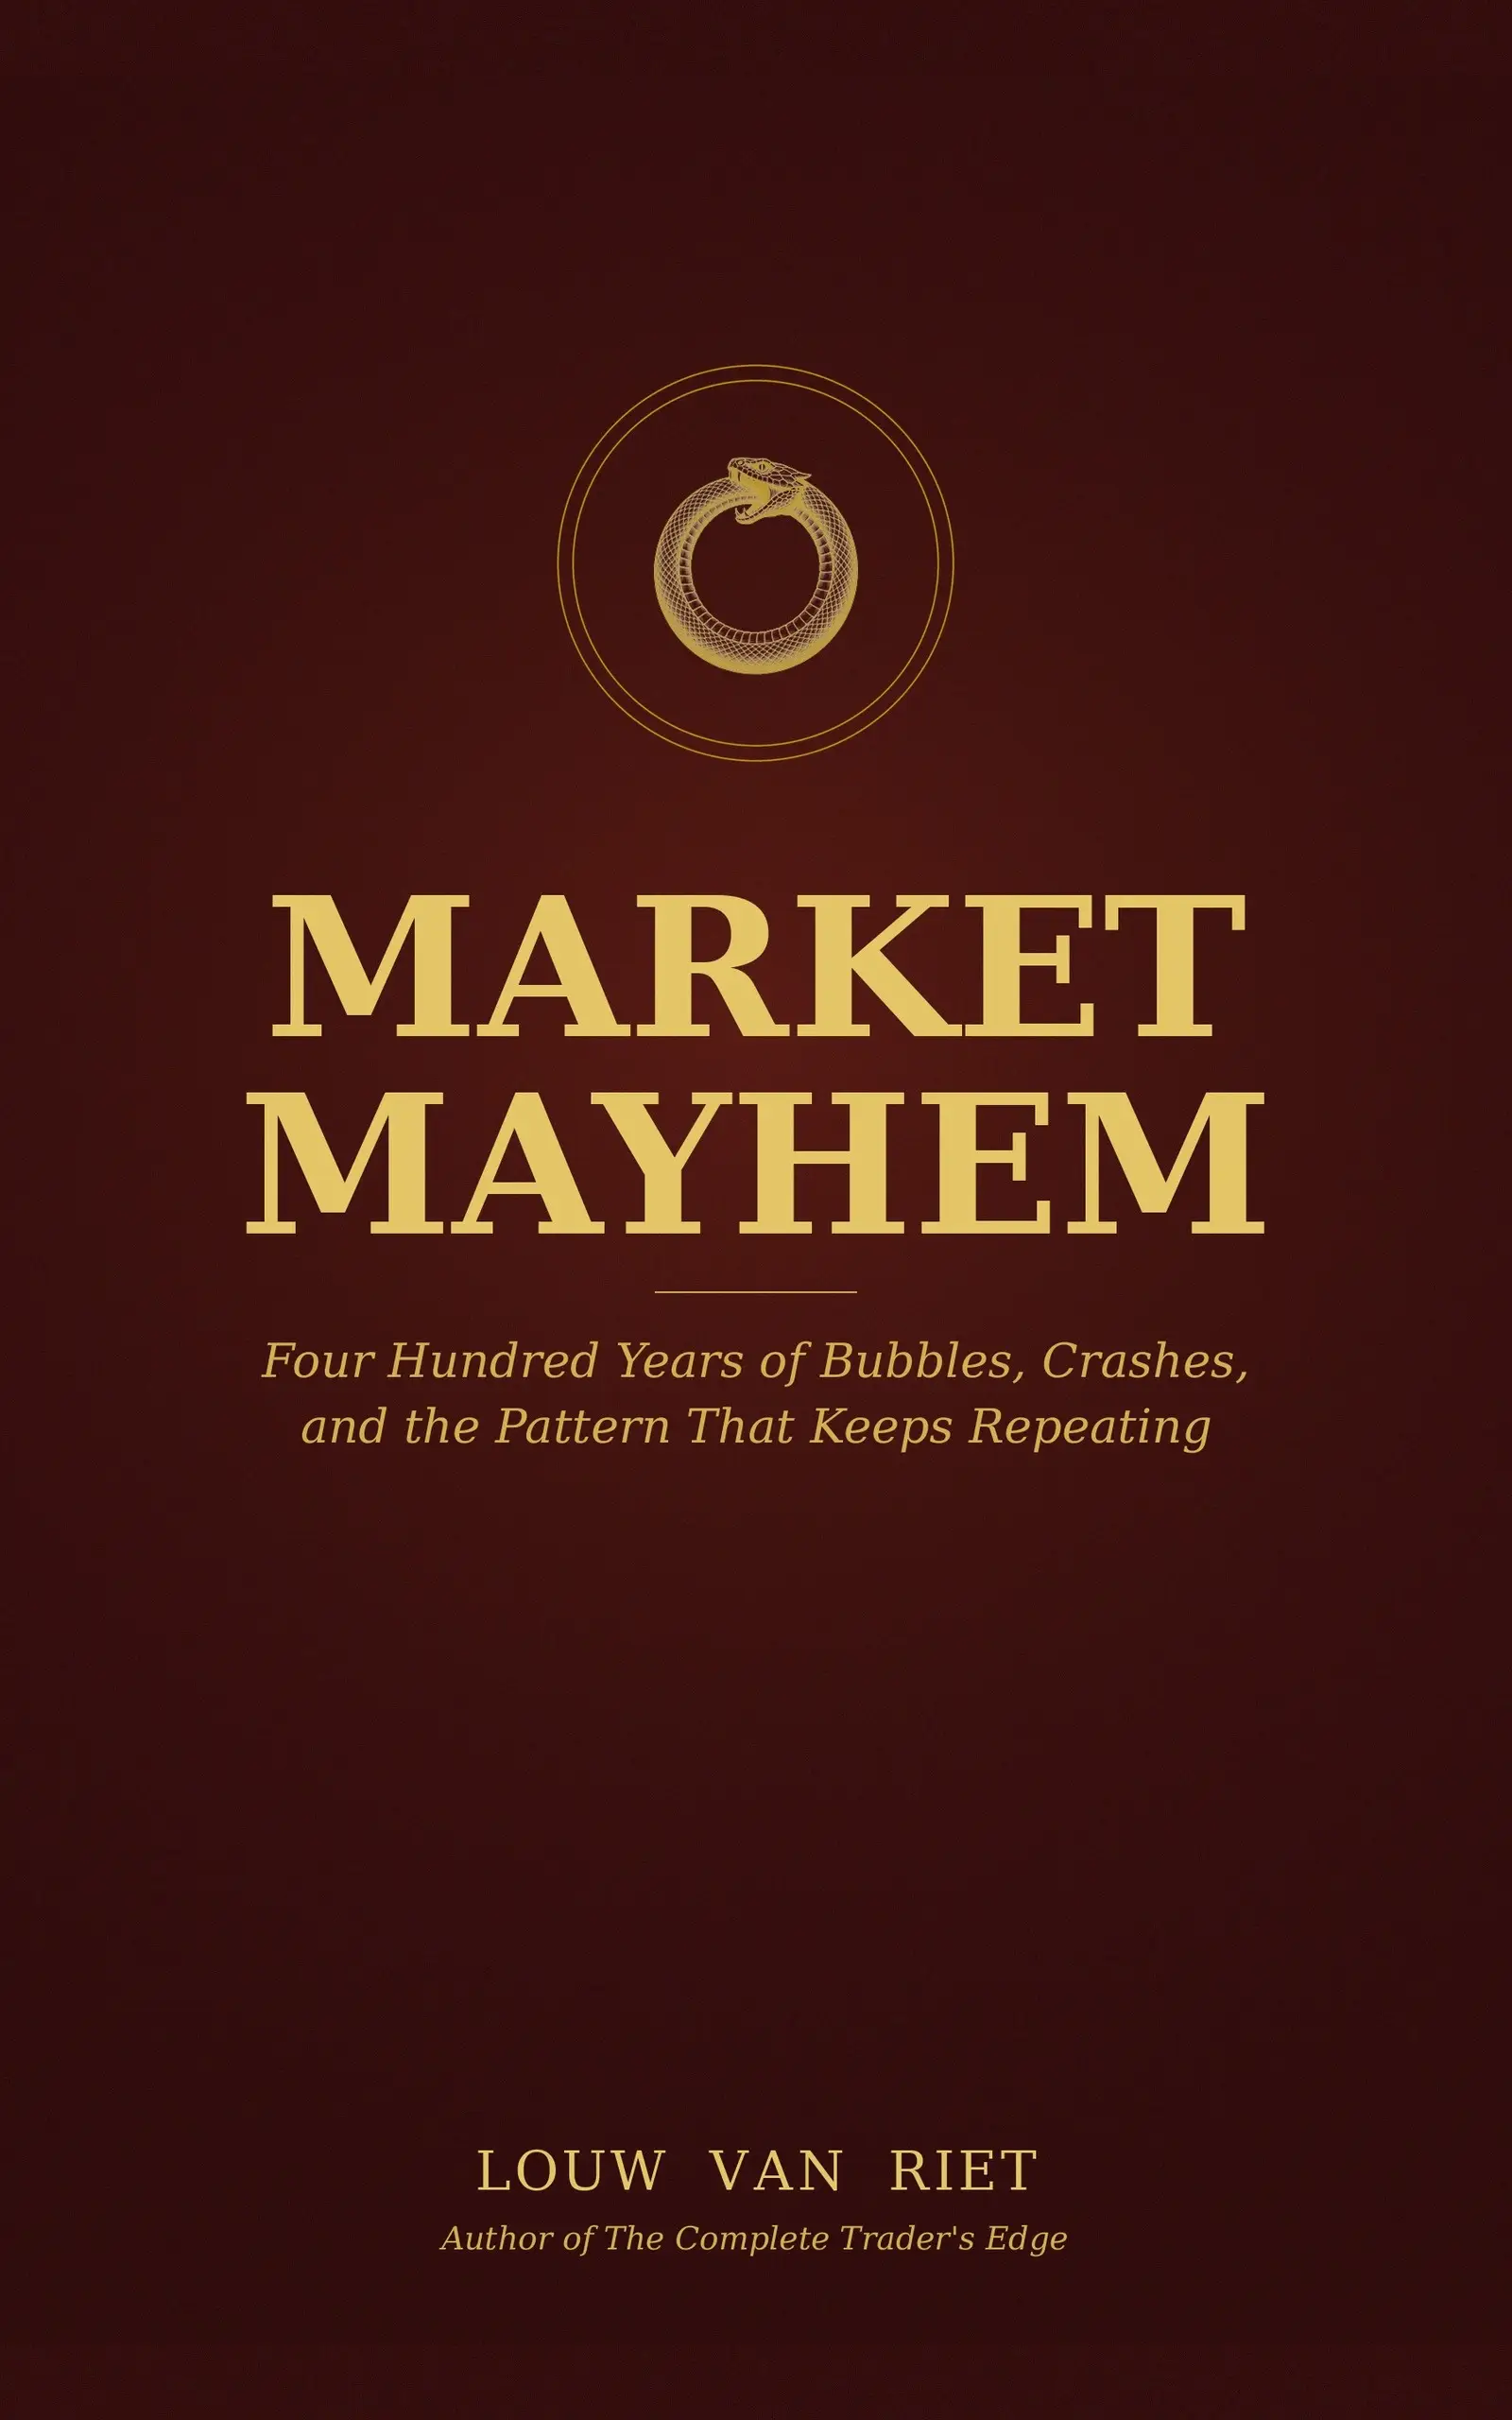 Market MayhemFour centuries of bubbles and crashes.
Vol III
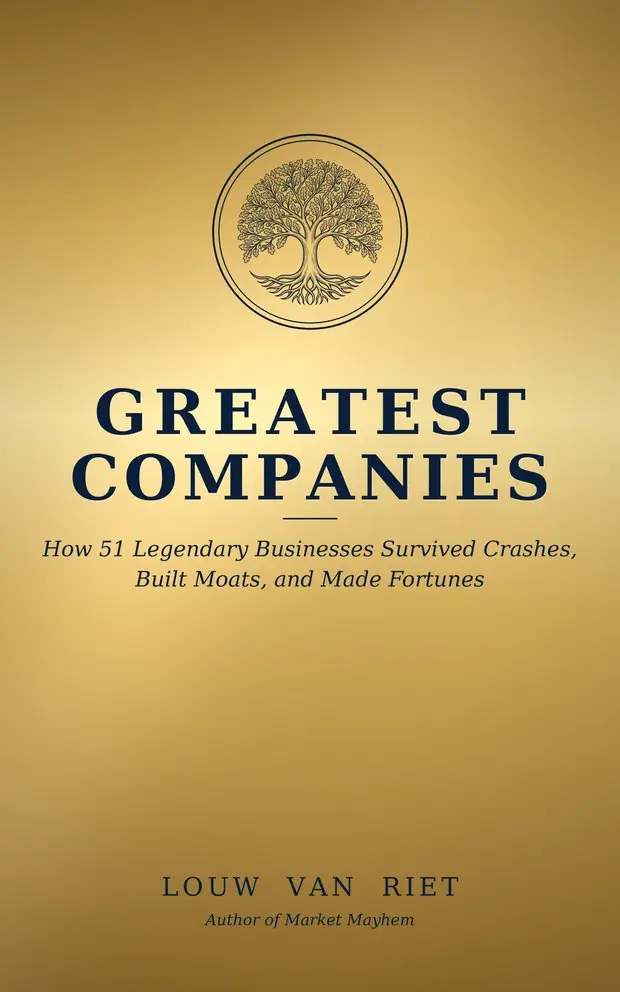 Greatest CompaniesFifty-one businesses and the moats behind them.
Vol IV · New
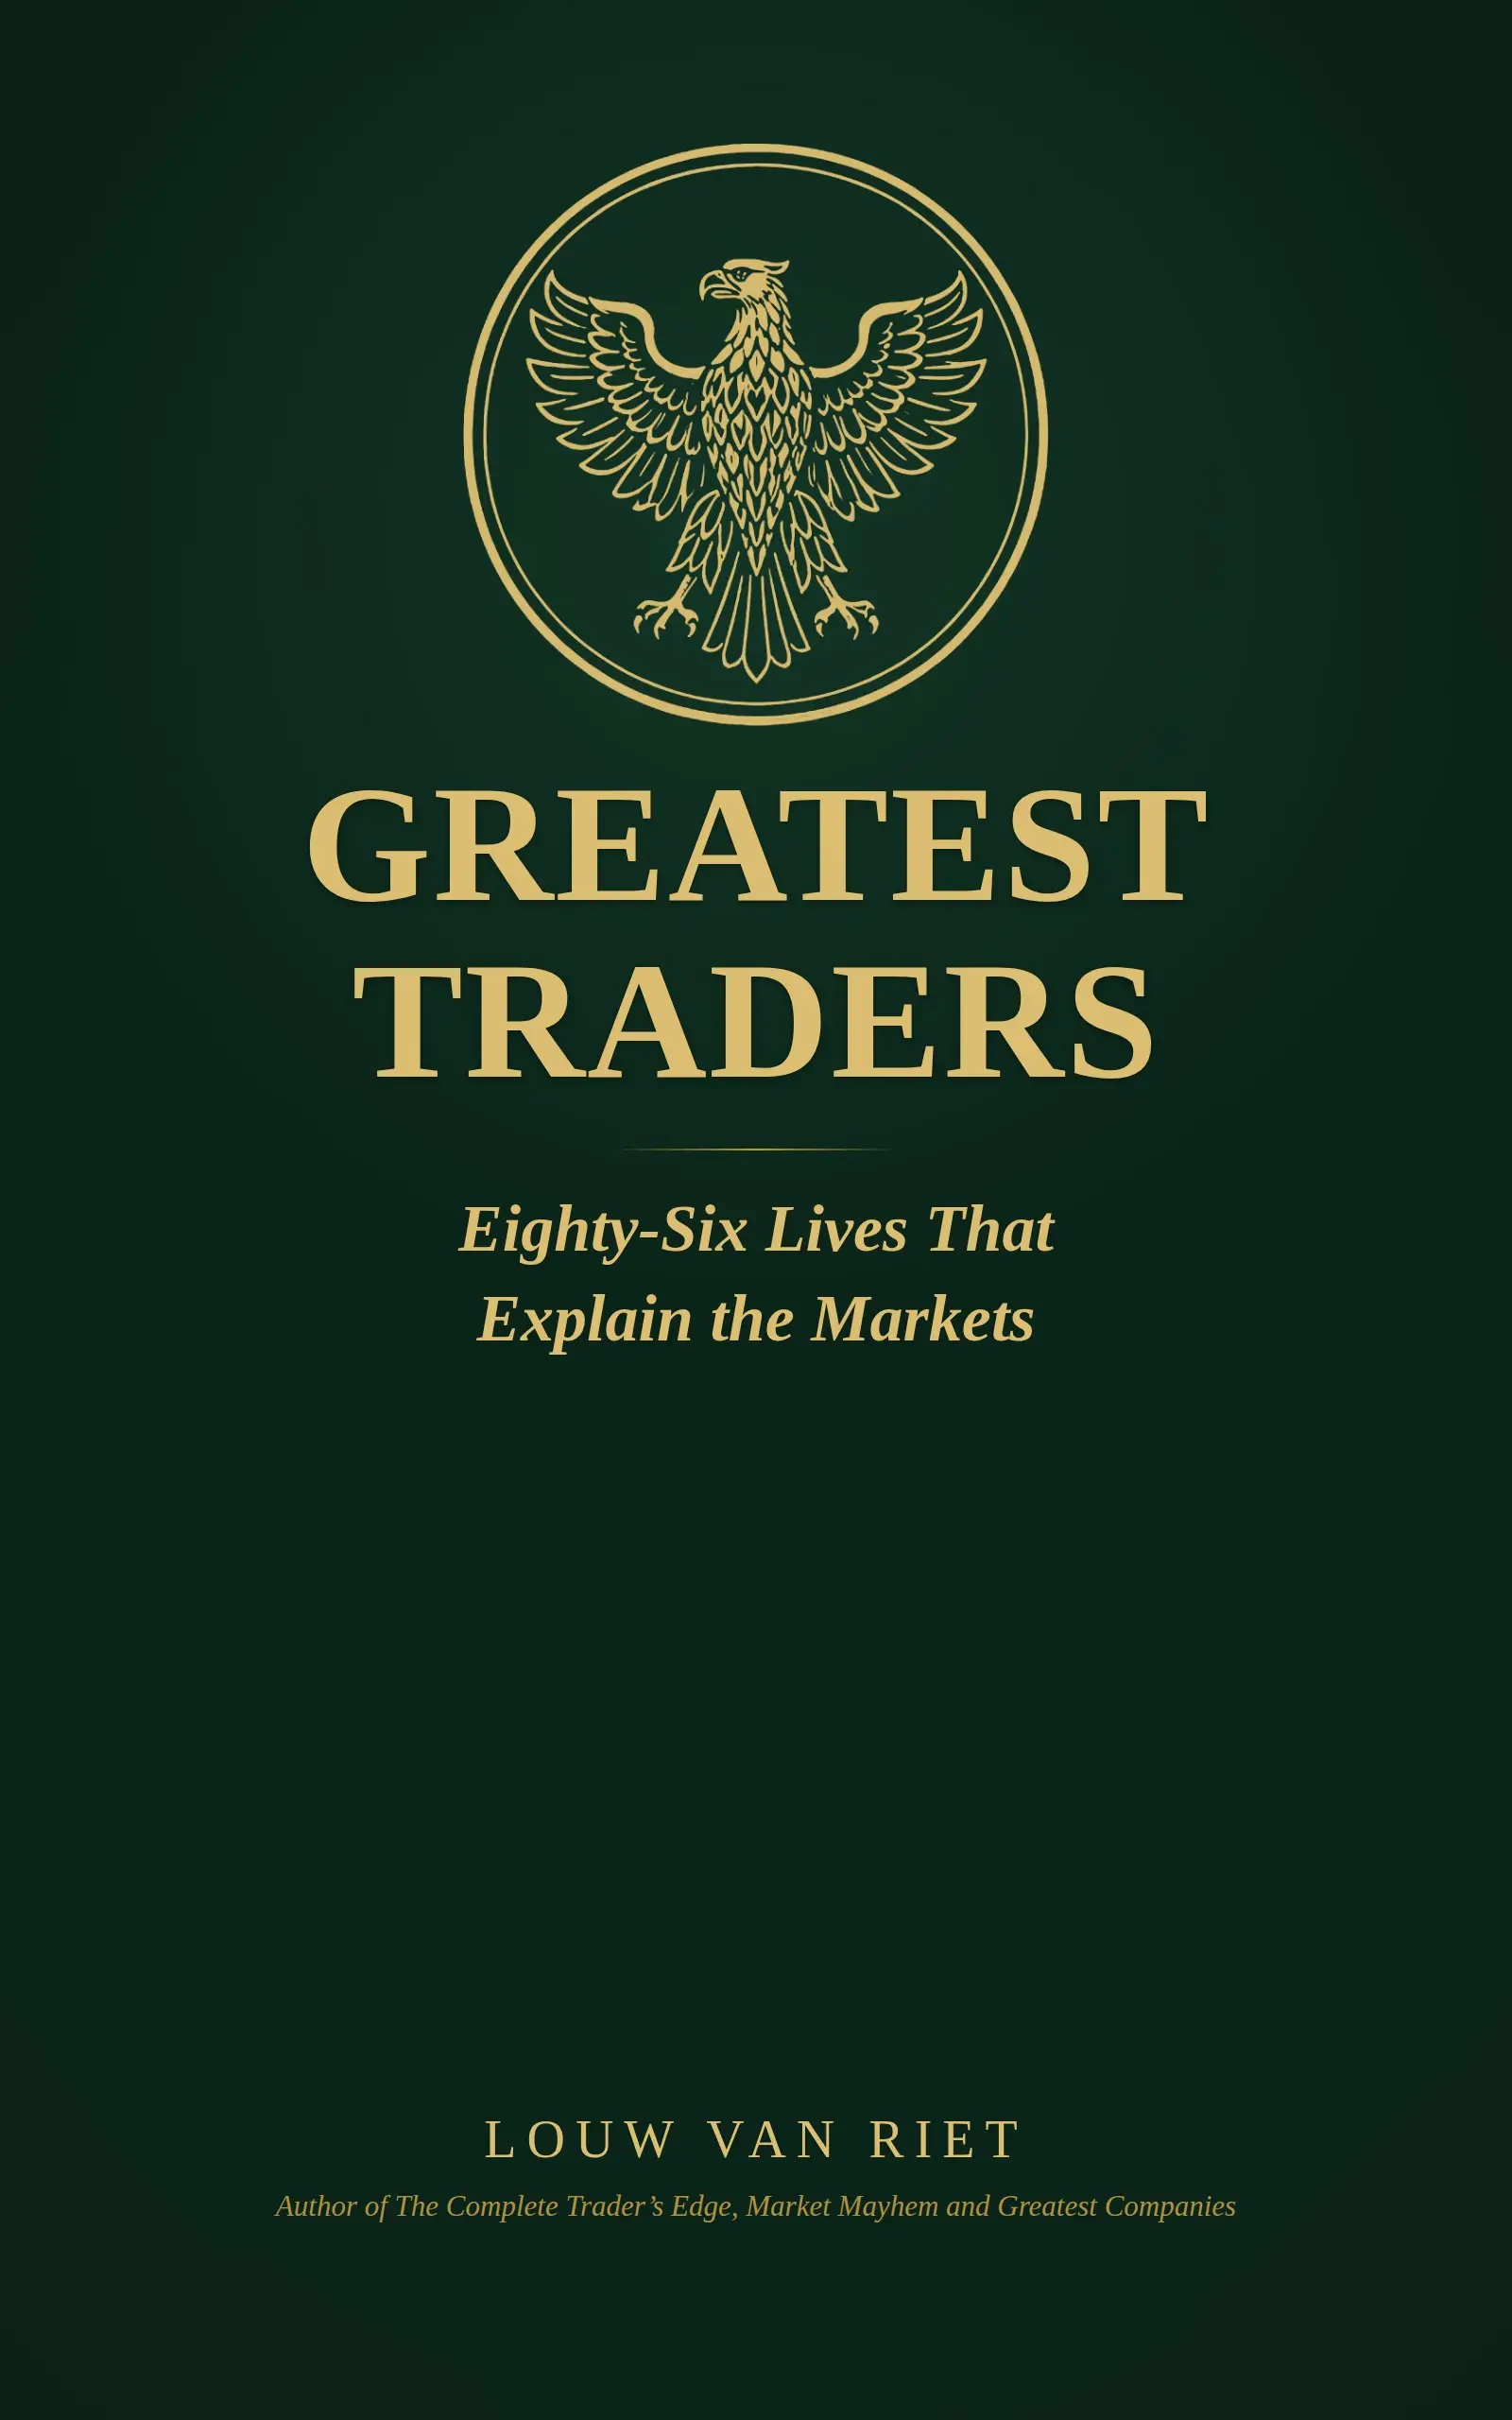 Greatest TradersEighty-six lives that explain the markets. Kindle, paperback and hardcover.
Continue reading
- Mark Minervini – the only trader to win the championship in both eras, twenty-four years apart.
- Marty Schwartz – the Pit Bull whose memoir is one of the few primary records of the 1983 and 1984 contests.
- Market Wizards – Schwager’s interviews remain the best surviving account of the original championship years.
- Legendary Traders Explorer – the full filterable database of traders we have profiled, including several championship names.
- The Three Pillars – the Mind, Method and Money framework we use to read every record on this site.
 The Complete Trader's Edge
The full Mind · Method · Money framework. 70 chapters.
View on Amazon →
The Complete Trader's Edge
The full Mind · Method · Money framework. 70 chapters.
View on Amazon →
 Market Mayhem
400 years of bubbles, crashes, and the pattern that keeps repeating.
Buy on Amazon →
Market Mayhem
400 years of bubbles, crashes, and the pattern that keeps repeating.
Buy on Amazon →
 Greatest Companies
How the world's greatest companies were built — and what traders learn from them.
View on Amazon →
Greatest Companies
How the world's greatest companies were built — and what traders learn from them.
View on Amazon →
 Greatest Traders
Eighty-six lives that explain the markets — Livermore to Madoff, told with the losses left in.
View on Amazon →
Greatest Traders
Eighty-six lives that explain the markets — Livermore to Madoff, told with the losses left in.
View on Amazon →
