

Silver closed the week of 30 October 2026 at $49.11, down 60% from the $121.65 record it printed on 29 January. That is the steepest fall from a major silver top since 1980, and nine months in it is tracking the 1980 collapse almost to the percentage point. It has also landed exactly on the $48–50 ceiling that capped silver in 1980 and again in 2011. What happens at that level over the next few months will decide whether this is a brutal correction inside a new long-term range, or the start of a much longer unwind.
This piece uses 56 years of monthly data and three years of weekly data pulled from TradingView to put the move in context: how it compares with the 1980 and 2011 tops, where the chart levels sit, what positioning and the gold/silver ratio say, what two of the most experienced traders in the business said about it on Friday, and three plausible roads from here.
Where Silver Stands Right Now
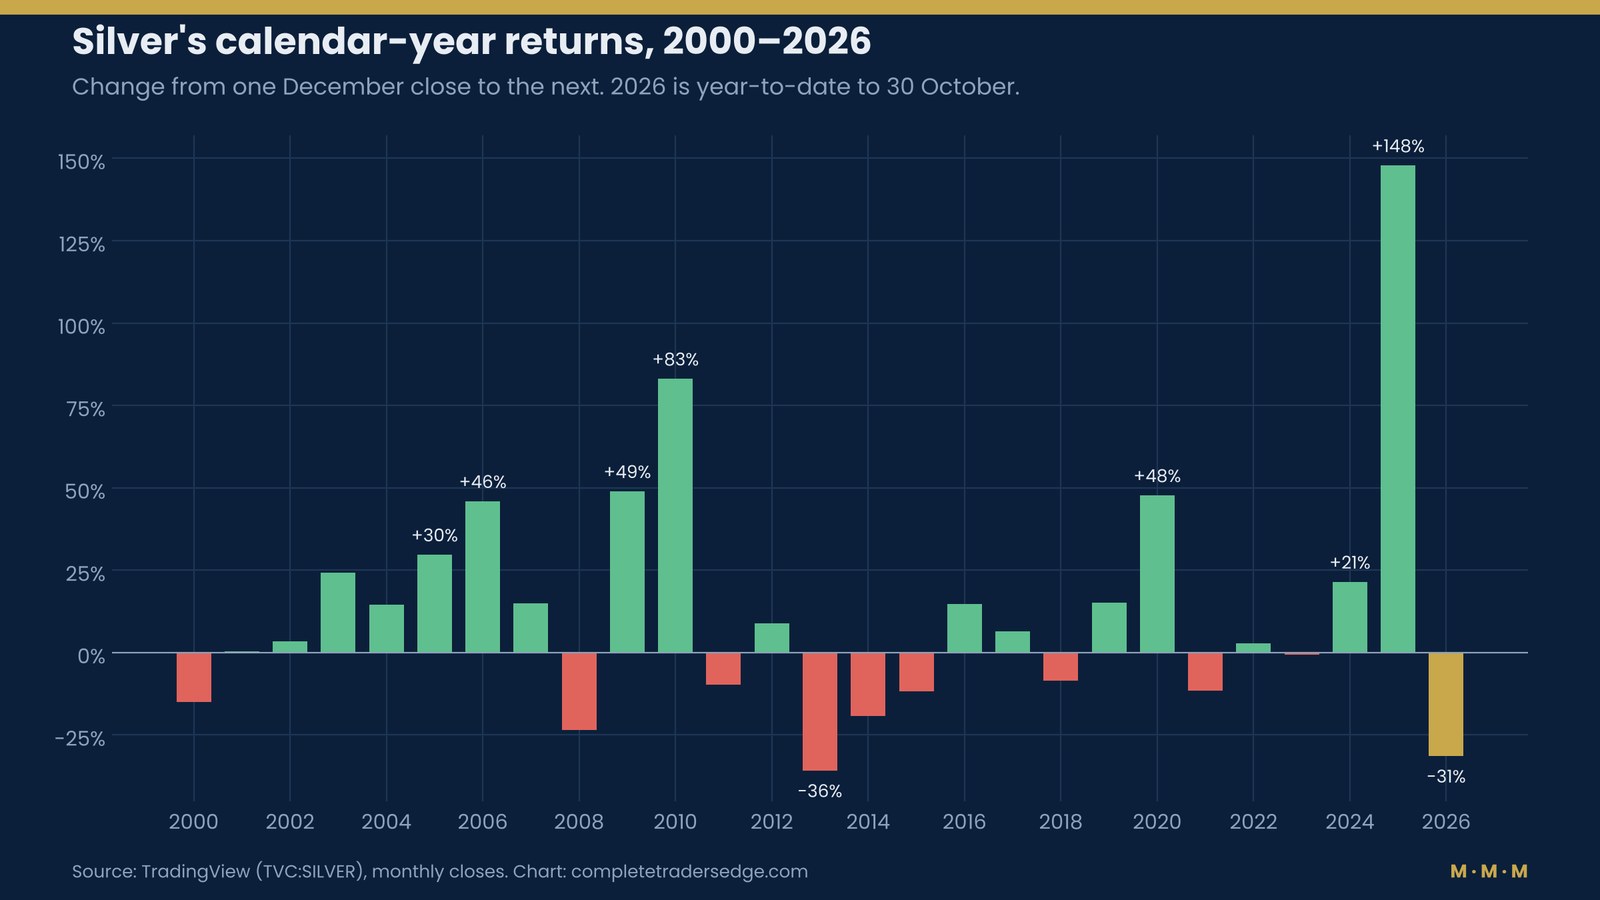
The last week did the damage. Silver lost 8.6% on the week and 18.7% in October, its second straight monthly loss. On Friday 30 October the front-month Comex contract fell 5.9% to settle at $49.097, its lowest close since 7 November 2025, while Comex gold dropped 3.3% to $3,885.70, its lowest settlement in more than a year. Silver is now down 31% for 2026, after a 148% gain in 2025 that was its best calendar year since 1979.
The macro trigger was a familiar one for metals: rates. Another tanker attack in the Strait of Hormuz pushed crude higher, September US inflation came in hotter, and although the Federal Reserve held its policy rate at 3.75–4.00% on Wednesday, the market read the meeting as “higher for longer.” By Friday the CME FedWatch tool priced roughly 73% odds of a December hike. A near-3% drop in the Nasdaq the same day added forced selling: when leveraged books lose money in one place, they raise cash wherever there is still a profit, and precious metals were the obvious place.
Silver has a specific problem in that environment. It is a monetary metal, so higher real rates hurt it the way they hurt gold. It is also an industrial metal, so anything that threatens manufacturing demand hurts it twice. GuruFocus put it neatly on Thursday: silver is being hit from both sides of its identity. That double exposure is why it fell 60% while gold fell about 31% from its own January high of $5,598.75.
56 Years of Silver in One Chart
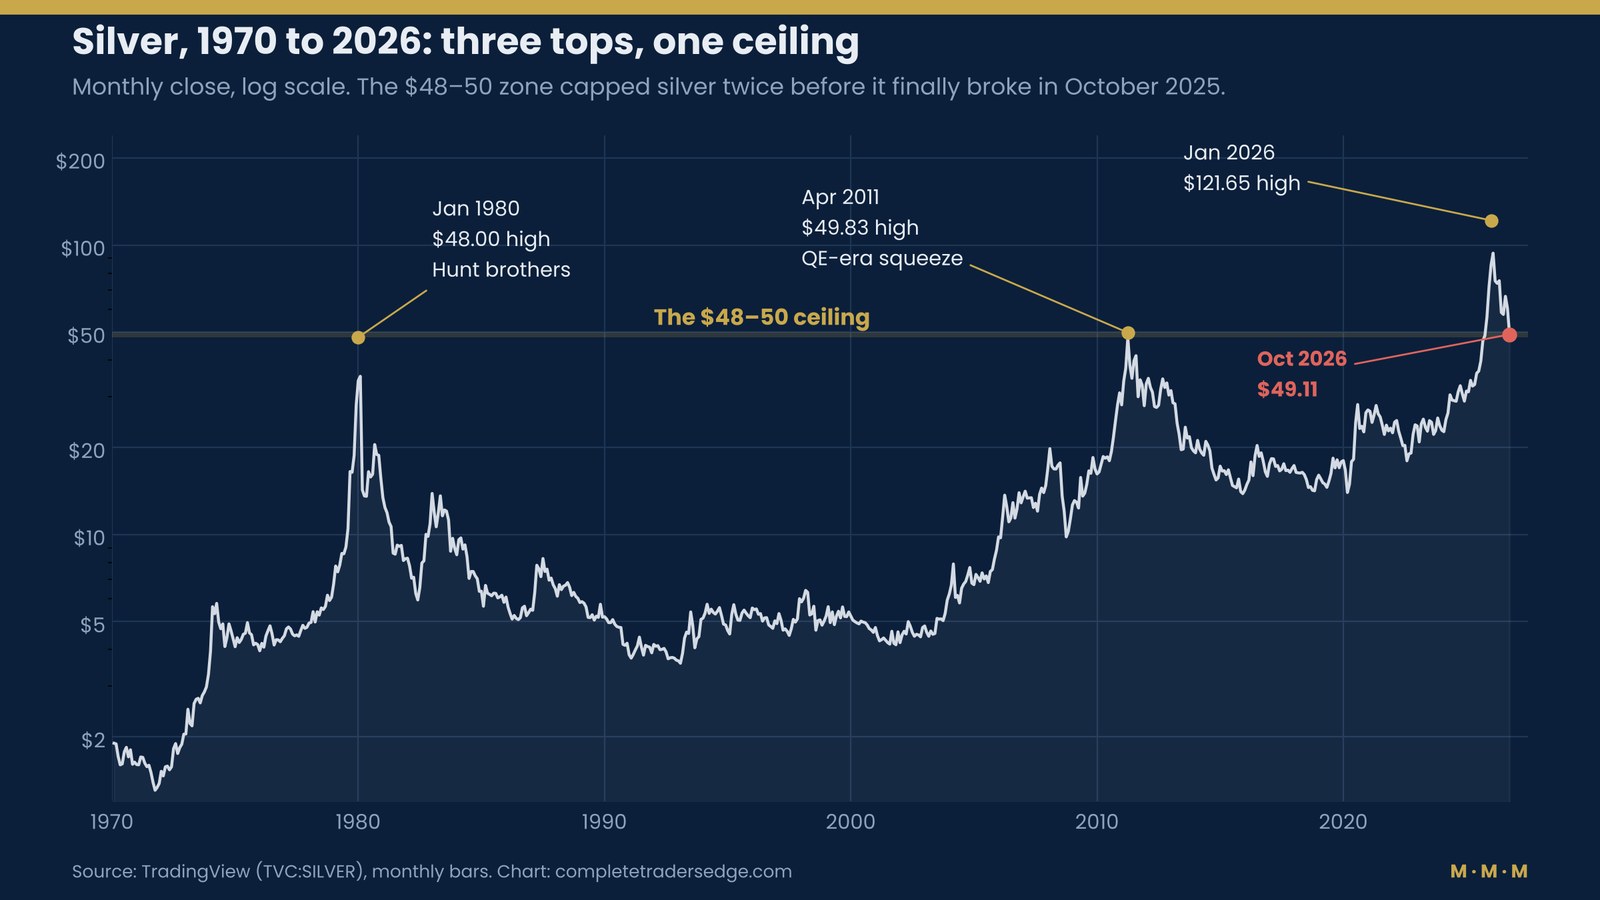
Put silver on a log chart and the structure is unusually clean. There are three great tops in 56 years, and the first two stopped in the same place:
- January 1980: a monthly high of $48.00 on TradingView’s series (London fix records put the intraday peak near $50). Driven by the Hunt brothers’ attempt to corner the market.
- April 2011: a monthly high of $49.83. Driven by post-crisis money printing, retail ETF buying and leveraged futures speculation.
- January 2026: $121.65. Driven by a physical squeeze in London, record investment demand and a sixth straight year of supply deficits.
For 45 years, $50 was the price at which silver bulls went to die. It finally broke in October 2025 and silver went parabolic: it closed November 2025 at $56.40, December at $71.61 and then spiked to $121.65 in the last days of January. That breakout matters for what happens now, because in classical chart terms a ceiling that has been broken often becomes a floor. Old resistance, new support. The price has just come back to test it.
The 1980 Top: The Hunt Brothers and Silver Thursday
The first top is the one every silver trader has heard of. Through 1979 Nelson Bunker Hunt and William Herbert Hunt, with Saudi and other partners, accumulated an enormous position in physical silver and futures. Silver traded below $10 before August 1979, reached $34.45 by the end of December and pushed above $50 in January 1980.
What broke it was not a change in supply and demand. It was the rules. Comex raised margin requirements, imposed position limits and finally moved to liquidation-only trading, which meant no one could open a new long. Industrial users and jewellers had been screaming about the price for months. On 22 January spot silver fell about $10 in a day. It drifted between roughly $31 and $38 into early March, then collapsed from $29.75 on 10 March to $10.80 on 27 March, the day now known as Silver Thursday, when the Hunts could not meet a margin call.
The aftermath is the part that should worry anyone who bought this year’s top. Silver did not recover. It ground lower for eleven years, reaching a monthly low of $3.46 in February 1991, a 93% loss from the high. On TradingView’s monthly series the $48 high was not exceeded until April 2011, 31 years later. Adjusted for inflation, it still has not been.
Market Mayhem readers will recognise the pattern from the 2022 LME nickel squeeze: when an exchange decides a squeeze threatens the market itself, it changes the rules, and the rules always win.
The 2011 Top: Five Margin Hikes in Nine Days
The second top rhymed. After the 2008 crisis, quantitative easing, a weak dollar and a flood of retail money through the iShares Silver Trust drove silver from under $9 in late 2008 to $49.83 in April 2011. From mid-January 2011 it rose about 80% in 14 weeks. Comex open interest peaked at 152,145 contracts on 25 April, three days before the high.
Then the CME raised silver margins five times in a little over a week, lifting the cost of holding a speculative position by 84%. Initial margin went from $11,745 per contract to $21,600. Silver fell 30% in the first week of May, its biggest drop since 1983, as leveraged longs were forced out at the same time.
The 2011 aftermath was less catastrophic than 1980 but still long. Silver spent the next four years falling, bottoming at $13.65 in December 2015 and printing a final low of $11.64 in the COVID crash of March 2020: a 77% drawdown, nine years after the top. The $49.83 high was not exceeded until October 2025, fourteen and a half years later.
The pattern in both tops
Each top was built on leverage, each one ended with the exchange raising margins, and each one took more than a decade to reclaim. Silver is a small market. When a crowd tries to squeeze through a narrow door, the door gets narrower.
The 2026 Top: The Squeeze That Finally Broke $50
The third top had a different engine. The Silver Institute’s World Silver Survey 2026, produced by Metals Focus, showed the market running a supply deficit every year since 2021: 40.3 million ounces in 2025 and a forecast 46.3 million ounces in 2026, with a cumulative 762 million ounces drawn from above-ground stocks over six years. That is close to a full year of global mine output. Solar panels, electric vehicles and the AI data-centre build-out all consume silver that does not come back.
By late 2025 those stock drawdowns met a market that trades far more silver on paper than it holds in vaults. Metal flowed from London to New York, London lease rates spiked, Comex inventories tightened and short sellers ran for cover. Speculators, physical buyers and ETF inflows all piled in at once. At the peak it was up 70% on its December close.
It ended the way 1980 and 2011 ended. The CME raised silver margins on 27 January and then moved to a percentage-based system, with maintenance margin at 15% of contract value. On Friday 30 January, the last trading day of the month, news of the next Federal Reserve chair nomination sent the dollar and Treasury yields higher. Silver fell between roughly a quarter and a third in a single session, depending on the venue, its most violent day in decades. It has not been back above $97 since.
Same Distance, Same Speed: 1980 vs 2011 vs 2026
Here is the chart that matters most. It rebases each cycle so the peak high equals 100%, then plots the monthly close for every month after the top.
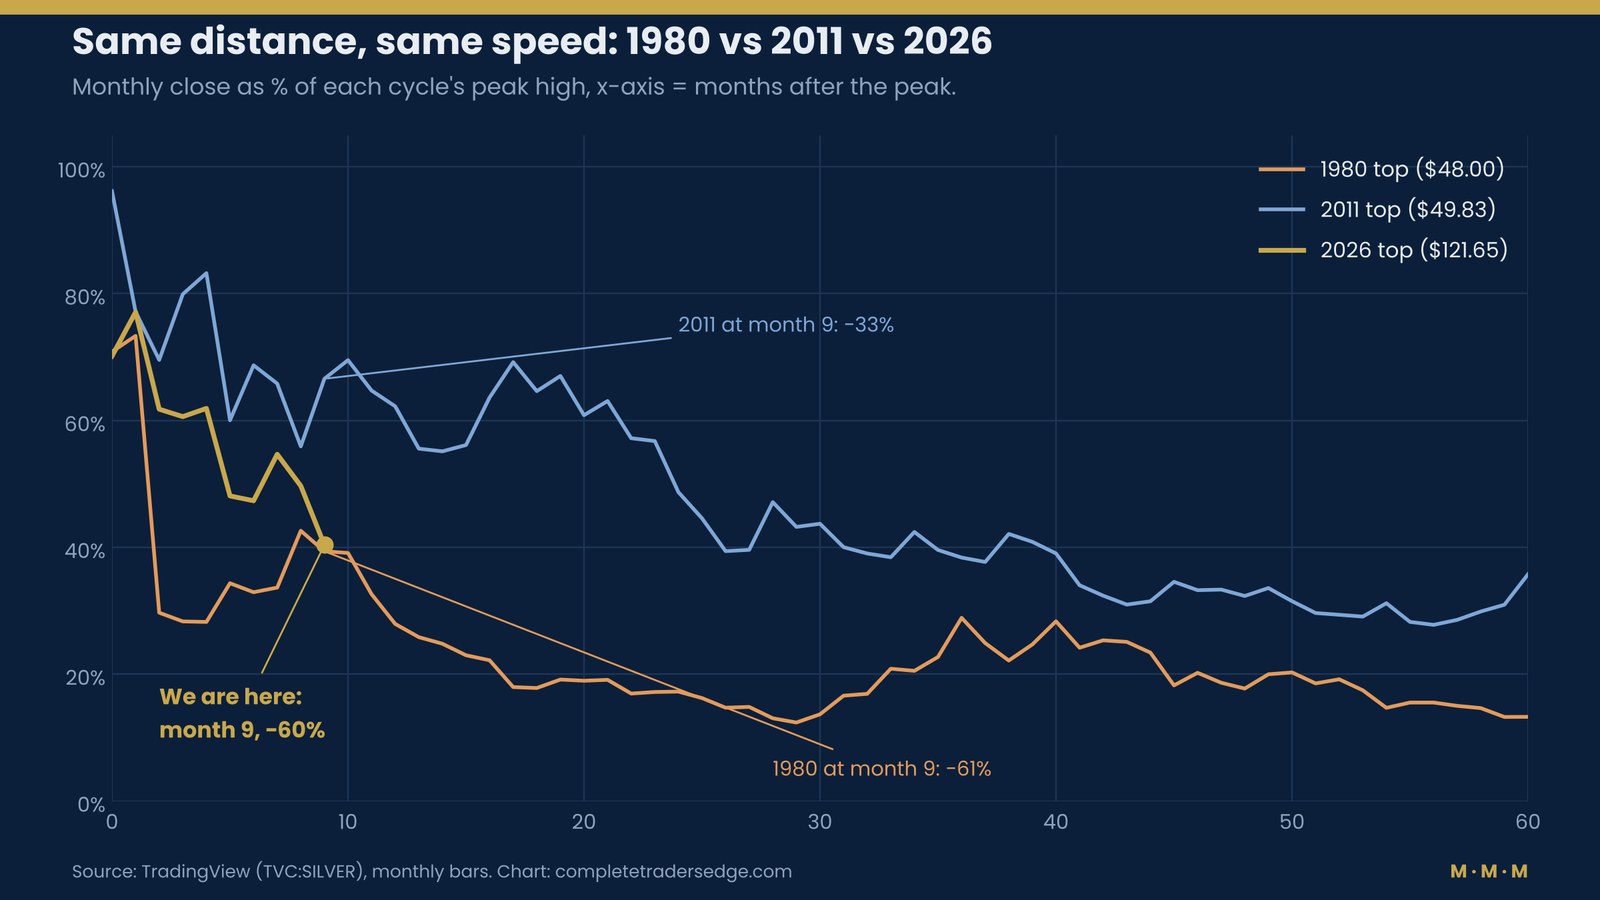
Nine months after the 1980 top, silver was 61% below its high. Nine months after the 2011 top, it was 33% below. Nine months after the 2026 top, it is 60% below. On speed and depth, this decline looks far more like the Hunt collapse than the QE unwind.
| Cycle | Peak (monthly high) | Month 9 after peak | Eventual low | Time to reclaim the high |
|---|---|---|---|---|
| 1980 | $48.00, Jan 1980 | −61% | $3.46, Feb 1991 (−93%) | 31 years (Apr 2011) |
| 2011 | $49.83, Apr 2011 | −33% | $11.64, Mar 2020 (−77%) | 14.5 years (Oct 2025) |
| 2026 | $121.65, Jan 2026 | −60% | $48.87 so far | – |
Two honest caveats. First, three cycles is not a statistical sample; it is three stories. Second, the 1980 crash was the end of a manipulation, not of a demand trend, and there is no Hunt-style corner to unwind this time. The 2026 top was a squeeze on top of a genuine deficit. That is a stronger foundation than 1980, and it is the main reason not to assume the 1980 path to $3 has a modern equivalent.
The Underwater Chart: How Long Silver Stays Down
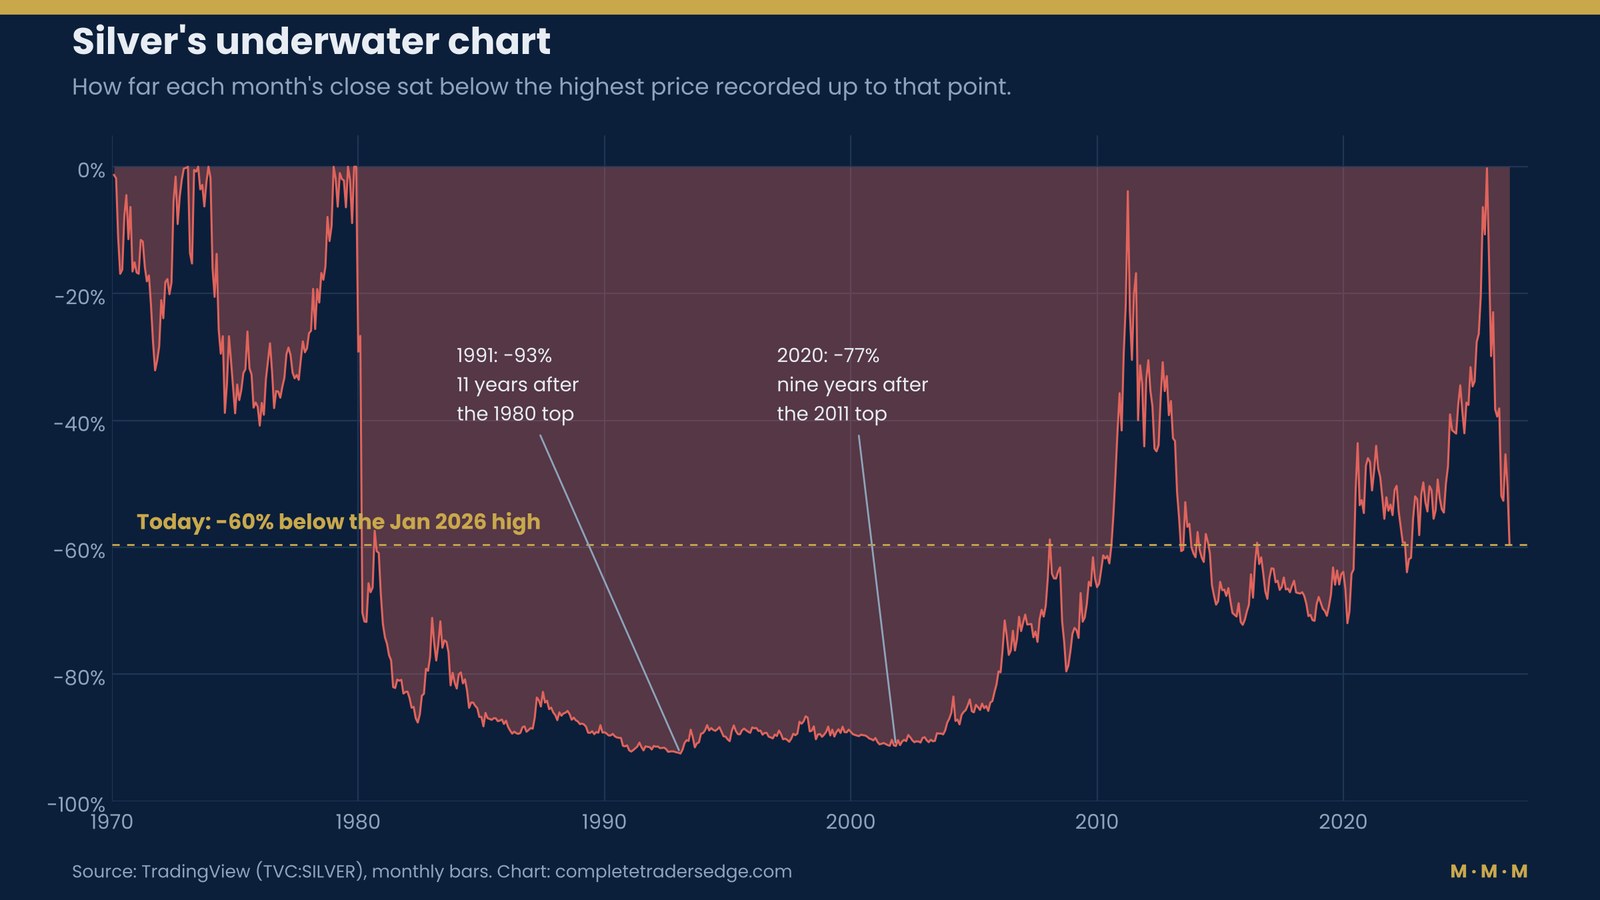
The underwater chart shows how long silver holders have historically spent below the previous high. From 1980 to 2011, effectively the entire period. From 2011 to 2025, all of it again. Silver has spent most of the past 46 years at least 50% below its last record. That is not a reason to sell it. It is a reason to size it for what it is: one of the most volatile major assets you can trade, with a history of long, grinding drawdowns after every mania.
The Weekly Chart: A Falling Channel Into the Old Ceiling
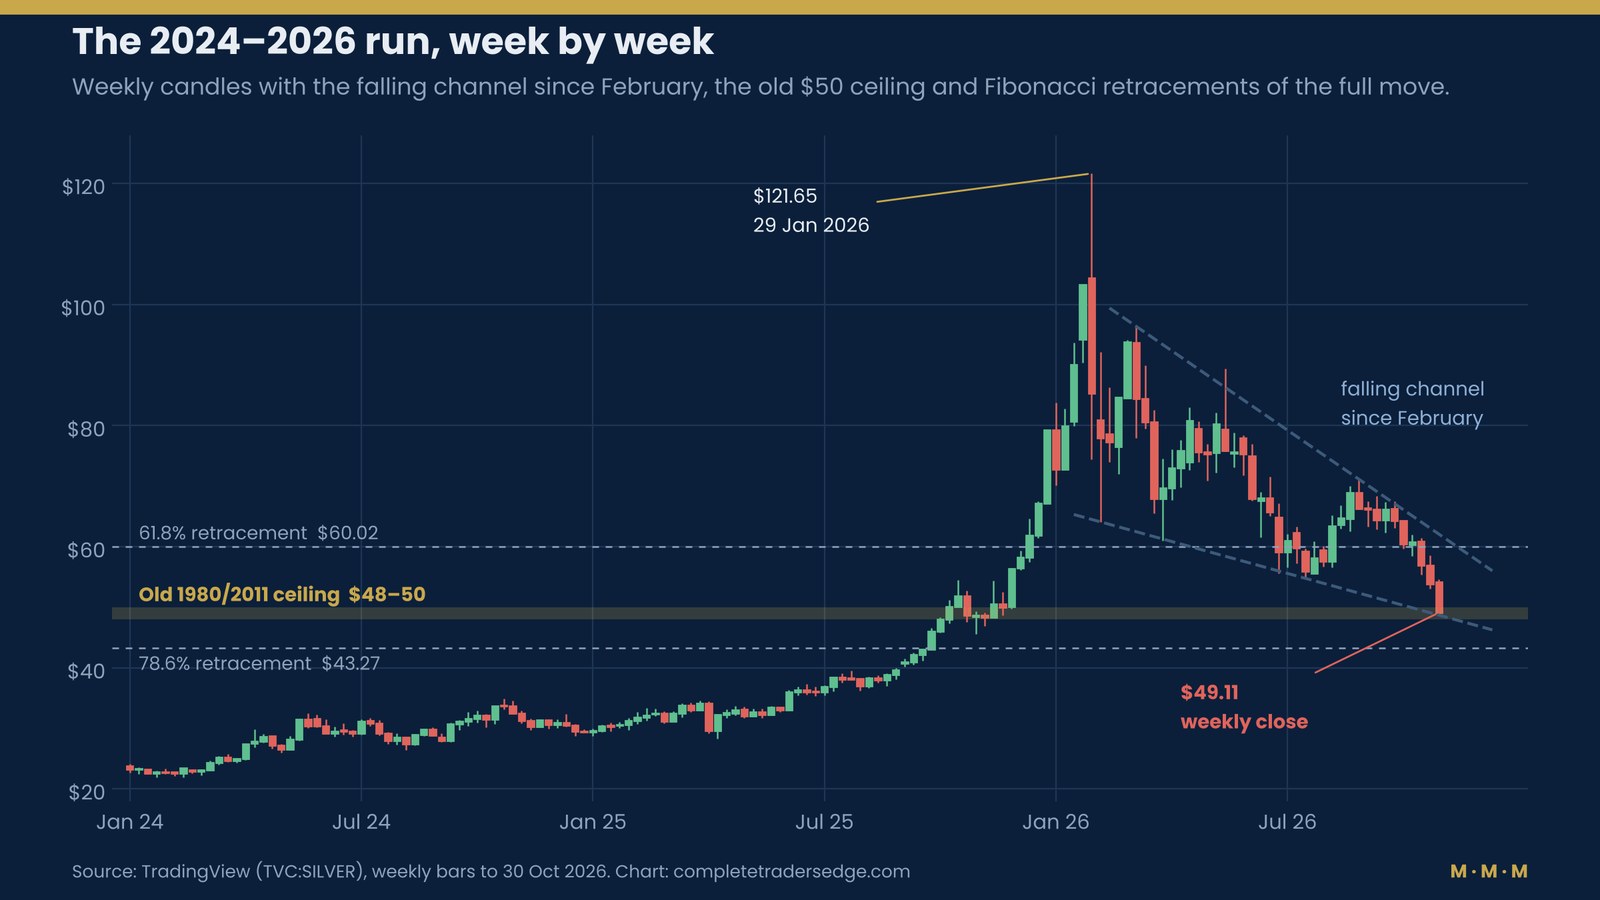
Zoom in and the structure since the January spike is a falling channel. The upper line runs through the March and August rally highs ($96.40 and $71.16) and sits near $62 this week. The lower line runs through the February and July lows ($64.10 and $54.78) and sits near $48.70, which is almost exactly where price closed. Three things meet in one place:
- The channel floor, around $48.70.
- The $48–50 ceiling from 1980 and 2011, which silver broke above in October 2025.
- A 73% retracement of the entire move from the January 2024 low of $21.93 to the January 2026 high. The 61.8% Fibonacci level at $60.02 has already gone; the 78.6% level sits at $43.27.
The indicators confirm a downtrend without screaming capitulation. TradingView’s weekly technical summary reads Sell, with moving averages at Strong Sell. Price sits below the 10, 20 and 50-week averages (the 50-week is near $69.75) but above the 200-week simple average at $39.44 and the 200-week exponential average near $45.12. Weekly RSI is 32.6, close to oversold but not there. On the monthly chart RSI is 47.7: neutral. The long-term uptrend that began in 2020 is damaged, not broken.
If you use moving averages, our guide to golden and death crosses explains why the 200-week line tends to matter more than the shorter ones at moments like this.
The Gold/Silver Ratio: Cheap Again, Not Yet Extreme
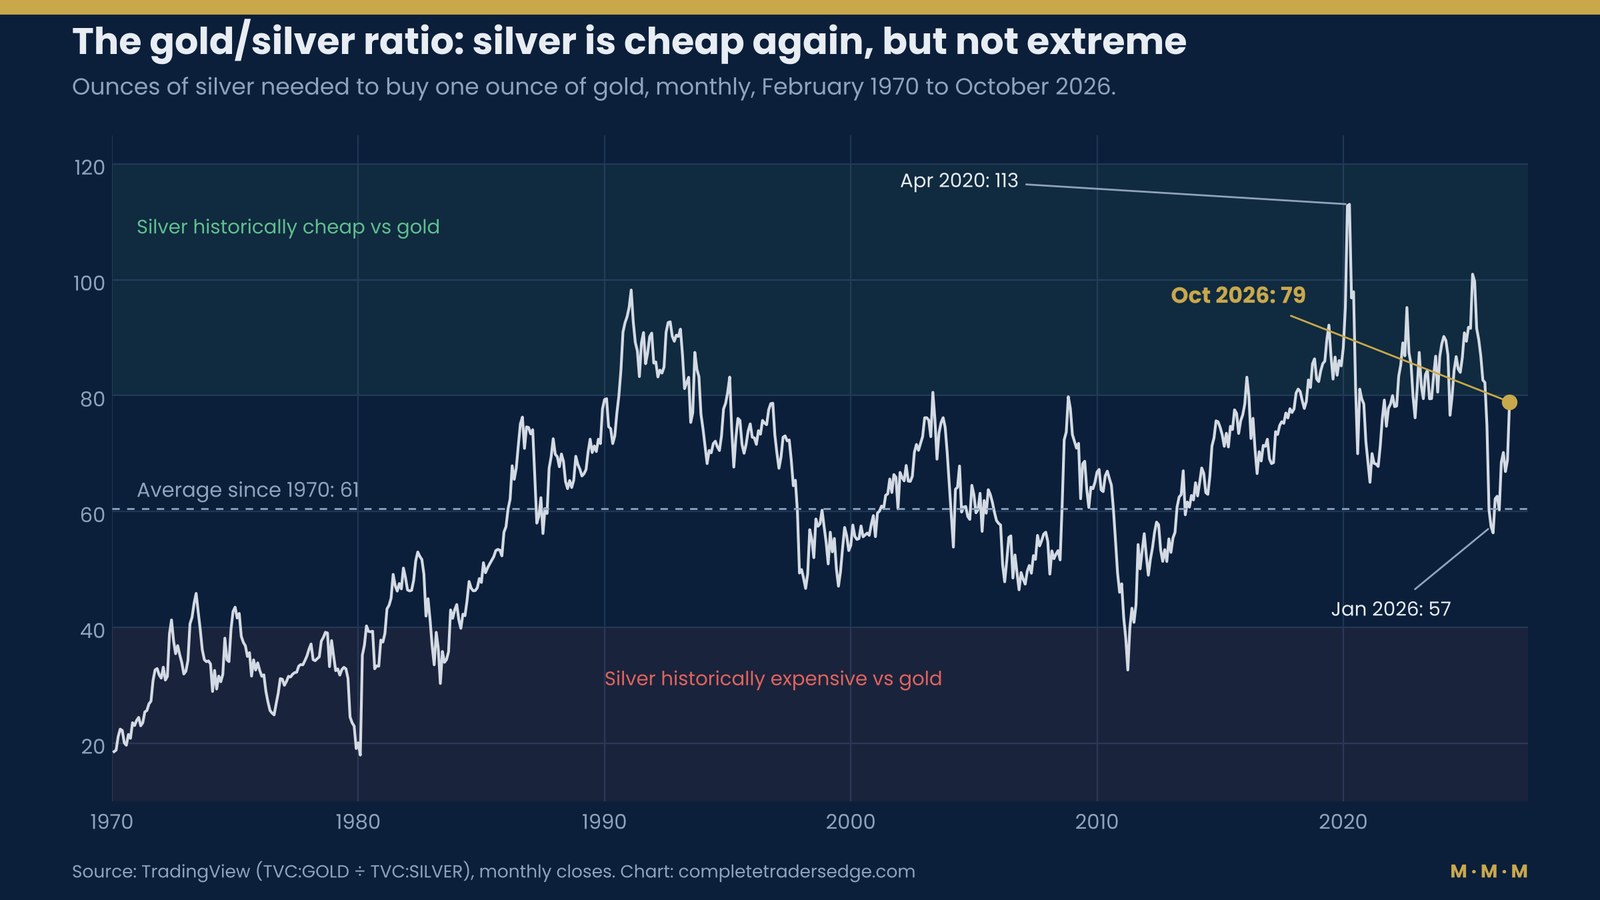
The gold/silver ratio tells you how many ounces of silver buy one ounce of gold. At the January top it fell to 57, its lowest since early 2013, which meant silver was expensive relative to gold. It is now 79. Metals Focus noted this week that the ratio has moved above 76 for the first time since December after spending the summer between 60 and 70.
Context matters here. The 1970–2026 average on monthly closes is 61, but the 2020–2025 average was 82 and the ratio hit 113 in the COVID panic. By long-run standards silver is cheap against gold again. By recent standards it is only fair value. The ratio has room to go higher if silver keeps lagging, and historically the big silver bottoms (1991, 2020) came with the ratio near or above 100. For the gold side of this story, see The History of Gold.
What the Veterans Are Saying: Brandt and Raschke
Two of the most experienced traders alive posted on silver on 30 October, and they disagreed in an interesting way.
Peter Brandt, who has been trading commodities for half a century, posted a weekly Comex chart showing the same falling wedge as the chart above and argued the selling was coming from buyers who got in above $90–100, swore they would never sell, and are now selling and swearing they will never buy again. His conclusion: “This is how the start of bottoms are formed.”
That is a sentiment argument, and it is the classic description of capitulation: the moment the last committed holders give up. Note the wording, though: the start of a bottom, which is a process, not a buy signal.
Linda Raschke, whose memoir we reviewed in Trading Sardines, posted a Barchart COT chart the same day and pushed back on the idea that positioning was washed out: “Hard to buy into the argument that silver positioning is at an extreme.”
The CFTC data backs her up. In the Commitments of Traders report for 20 October, non-commercial traders in Comex silver were still net long 19,795 contracts, down only modestly from 23,153 two weeks earlier, while their short positions rose about 3,000 contracts in a week. Kitco’s analysis of managed-money positioning shows hedge-fund shorts peaked near 42,000 contracts in February 2024 and fell to exceptionally low levels by January 2026. They have not rebuilt anything like that this time. In past cycles, the big silver lows came when speculators were heavily net short and commercials heavily net long. On the other side, commercial positioning did reach the top of its 26-week range in the latest report, which is the first sign of the hedgers starting to lean the other way.
Reconciling Brandt and Raschke
They are measuring different things. Brandt is reading the crowd that holds physical metal and ETFs, which looks like it is capitulating. Raschke is reading the futures market, where speculators are still long and have not been forced to flip short. A durable bottom usually needs both. If you want to read the report yourself, our guide to the COT report covers which columns matter and why.
The Fundamental Case Has Not Disappeared, but It Is Not the Price
The bull case for silver is still on paper. The Silver Institute expects a sixth straight annual deficit in 2026. Mine supply is slow to respond because most silver comes as a by-product of copper, lead, zinc and gold mining; Fresnillo, the world’s largest silver miner, cut its 2026 guidance to 42–46.5 million ounces from 45–51 million. Solar and electronics demand has not reversed.
The honest counterweight is that silver ran a deficit in 2021, 2022 and 2023 too, and the price went sideways between $18 and $30. Deficits drain stocks slowly; they do not set the price month to month. Investment flows, leverage and interest rates do, and right now all three are working against silver. A rising rate path, a stronger dollar and margin-call selling can overwhelm a 46-million-ounce shortfall for a long time. Investors who bought at $90–120 on the deficit story are learning that a good thesis and a good entry are different things.
Three Roads From $49
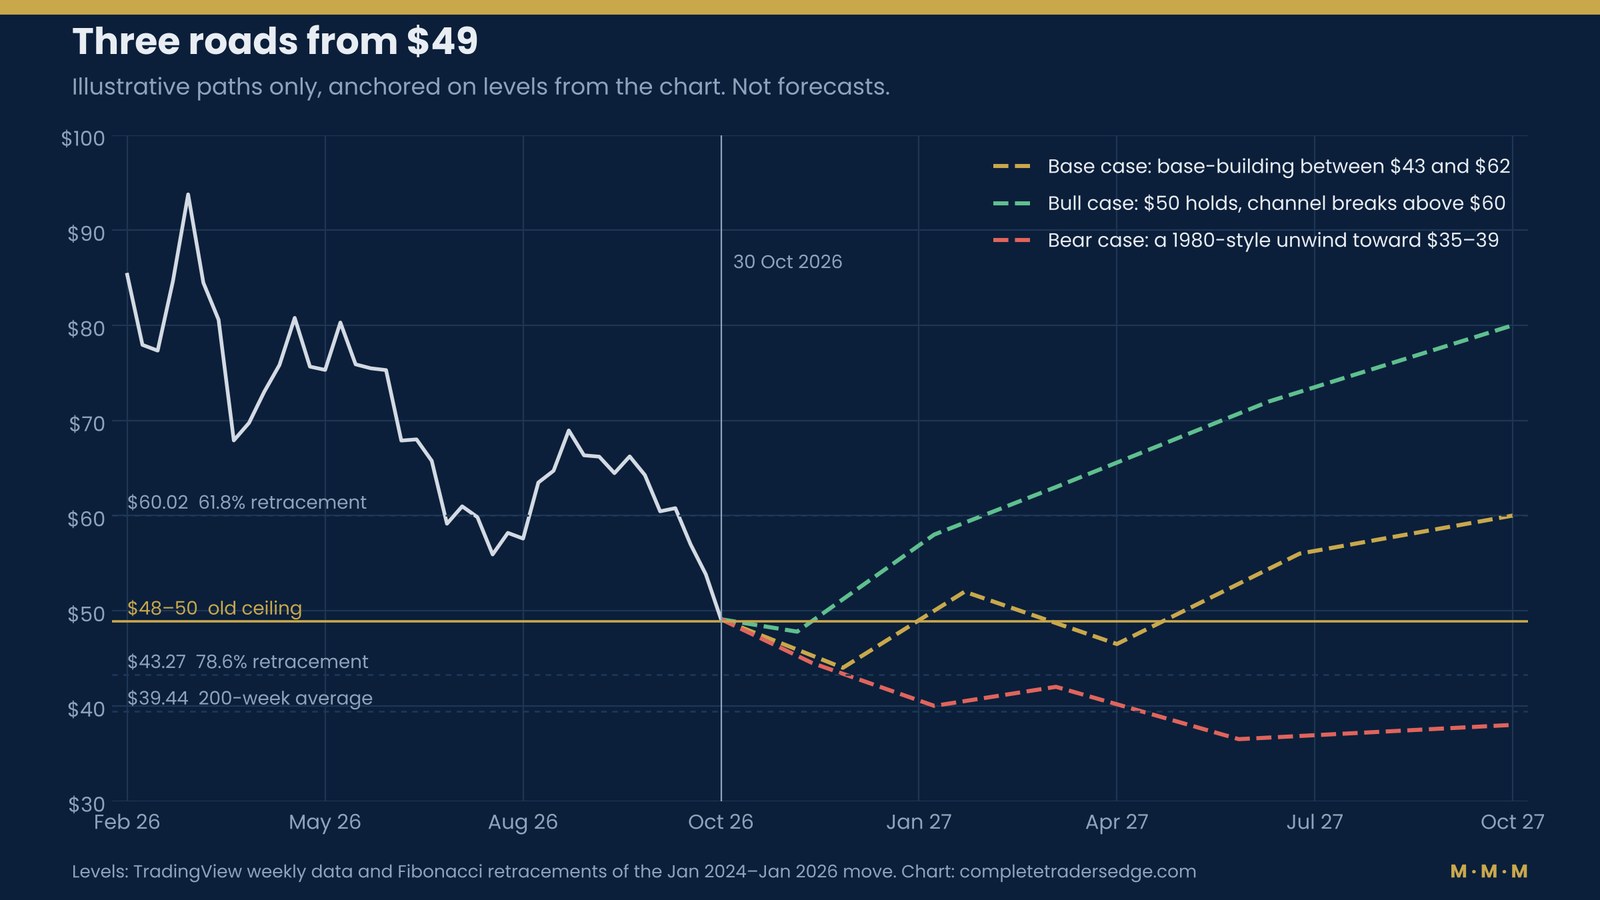
None of these is a prediction. They are the three structures the chart, the history and the positioning data most plausibly support, with the evidence that would confirm or kill each one.
Base case: a long base between roughly $43 and $62
Silver undercuts $48–50 briefly, possibly into the 78.6% retracement at $43.27, then spends months chopping inside a wide range while positioning resets. This is what most post-mania bottoms look like: not a V, but a slow grind that exhausts both bulls and bears. Brandt’s capitulation reading and Raschke’s positioning reading are both consistent with it, because it gives the futures market time to flush out the remaining longs. Confirmed by: weekly closes holding above $43 and a gradual rise in speculative shorts without new lows in price. Killed by: a weekly close below $43 or a clean break above the channel top.
Bull case: the old ceiling holds as a floor
The $48–50 zone does what broken resistance is supposed to do and holds. A weekly close back above $50 followed by a break of the channel top, currently near $62 and falling, would complete Brandt’s falling wedge and put $70–80 back in play over 2027. Needs: rate expectations to ease (a December hold rather than a hike), the gold/silver ratio to turn back below 70, and physical demand to absorb the selling. Killed by: continued weekly closes below $48.
Bear case: a 1980-style unwind toward $35–39
The $48–50 floor fails, the 78.6% retracement at $43.27 gives way, and silver heads for the 200-week average near $39 and the 2025 breakout zone in the mid-to-high $30s. This is the path where the Fed does hike, oil keeps rising, equities keep falling and leveraged holders keep raising cash. It would still leave silver above where it started 2025. Confirmed by: a weekly close below $43 with the gold/silver ratio pushing toward 90–100 and speculators finally turning net short. Killed by: a fast reclaim of $50.
What to Watch Over the Next Few Weeks
- Weekly closes relative to $48–50. One close below is noise. Three in a row is information.
- The December Fed meeting. With hike odds near 73%, a hold would be a relief rally catalyst; a hike is largely priced but would confirm the bear case’s macro backdrop.
- The gold/silver ratio. Above 85 means silver is still being sold harder than gold. A turn back below 75 would be the first sign of relative strength.
- The weekly COT report. Watch for speculators finally moving to net short. That is what turned the 2015 and 2020 lows into durable bottoms.
- Exchange margin changes. Margin cuts tend to follow volatility down. A CME margin reduction would be a small but real sign that the leverage cycle has turned.
- Oil and the Strait of Hormuz. The current sell-off is an energy-driven inflation trade. If crude reverses, the rate story that is crushing silver weakens with it. Our History of Oil covers why Hormuz moves every market.
How to Approach It: Mind, Method, Money
Mind. The hardest trade in this market is the one that feels most obvious. At $121 the obvious trade was to buy the deficit. At $49 the obvious trade is to catch the bottom because “it’s already down 60%.” Both are the same mistake: acting on a story rather than on price. In 1980 silver fell another 80% after it was “already down 60%.” In 2011 it fell another 65% after a 33% drop.
Method. Let the levels do the work. $48–50, $43.27 and the channel top near $62 are where the market will reveal which road it is on. Buying a confirmed weekly reclaim of $50 with a stop under the week’s low is a defined trade. Buying because the price looks cheap is not.
Money. Silver fell by a quarter or more in a single day in January. Size accordingly. A position that would be normal in an index future is reckless in silver at current volatility. ATR position sizing handles this automatically by shrinking your size when the average range expands, and portfolio heat keeps one volatile market from blowing up the whole account. If you trade silver through futures, read How to Trade Futures first; the 2011 and 2026 margin hikes are a reminder that the exchange can change the cost of your position overnight.
The Bottom Line
Silver has done in nine months what took the 1980 bubble nine months: given back 60% from the top. It has fallen straight back to the $48–50 level that capped it for 45 years, the floor of a falling channel and a 73% retracement of the whole move. The deficit that powered the rally is real; the leverage that powered the spike has been, and is still being, punished. History says the next phase is usually a long base rather than a quick recovery, and that the best entries come when the crowd has given up and the futures market has turned short. Brandt thinks the first half of that is happening. Raschke’s data says the second half has not happened yet. Watch $50 on a weekly closing basis, and let the market tell you which of them is right.
Prices and data are as at the weekly close on 30 October 2026 unless stated. This article is market commentary for education, not a recommendation to buy or sell.
Data
TradingView – TVC:SILVER monthly (1970–2026) and weekly (2024–2026) OHLC bars, TVC:GOLD monthly closes, and the weekly and monthly technical ratings for TVC:SILVER, retrieved 31 October 2026. All charts in this article are built from this data.
Market reporting
Seeking Alpha via TradingView – 30 October Comex settlements, weekly moves, Fed decision.
Stocktwits via TradingView – CME FedWatch December odds, Peter Brandt’s comments.
GuruFocus via TradingView – Metals Focus on the gold/silver ratio.
Finance Magnates via TradingView and FXNX – the 29–30 January peak and crash, CME margin changes.
Outspoken Digest – the London squeeze behind the January spike.
Positioning
Titan FX CFTC silver data – non-commercial positions to 20 October 2026. Kitco – managed-money short history. FXStreet – commercial COT index.
Supply and demand
Silver Institute and Metals Focus, World Silver Survey 2026 (15 April 2026), via MetalCharts. Fresnillo guidance via Yahoo Finance.
History
Silver Thursday – the 1979–80 timeline and exchange actions. InvestmentNews, May 2011 and Nasdaq, May 2011 – the 2011 margin hikes and open interest.
Commentary referenced
Peter Brandt (@PeterLBrandt) and Linda Raschke (@LindaRaschke) on X, 30 October 2026.
 The Complete Trader's Edge
The full Mind · Method · Money framework. 70 chapters.
View on Amazon →
 Market Mayhem
400 years of bubbles, crashes, and the pattern that keeps repeating.
Buy on Amazon →
 Greatest Companies
How the world's greatest companies were built — and what traders learn from them.
View on Amazon →
 Greatest Traders
Eighty-six lives that explain the markets — Livermore to Madoff, told with the losses left in.
View on Amazon →