The moving average crossover is the first strategy almost every trader learns, and the golden cross makes headlines whenever it appears. Two lines cross, and you are told a new trend has begun. It is clean, it is simple, and it is one of the most lagging signals in all of technical analysis. That does not make it useless – it makes it a tool for a specific job. Used as an entry trigger, the crossover will frustrate you. Used as a trend filter, it can quietly improve every trade you take.
This guide covers what crossovers are, the famous golden and death crosses, why they lag so badly, and how to use them the right way.
What a Moving Average Crossover Is
A crossover happens when a faster (shorter-period) moving average crosses a slower (longer-period) one. When the fast average crosses above the slow one, it signals bullish momentum; when it crosses below, bearish. Traders use simple moving averages (SMAs) or exponential moving averages (EMAs), which weight recent prices more heavily and so react a little faster.
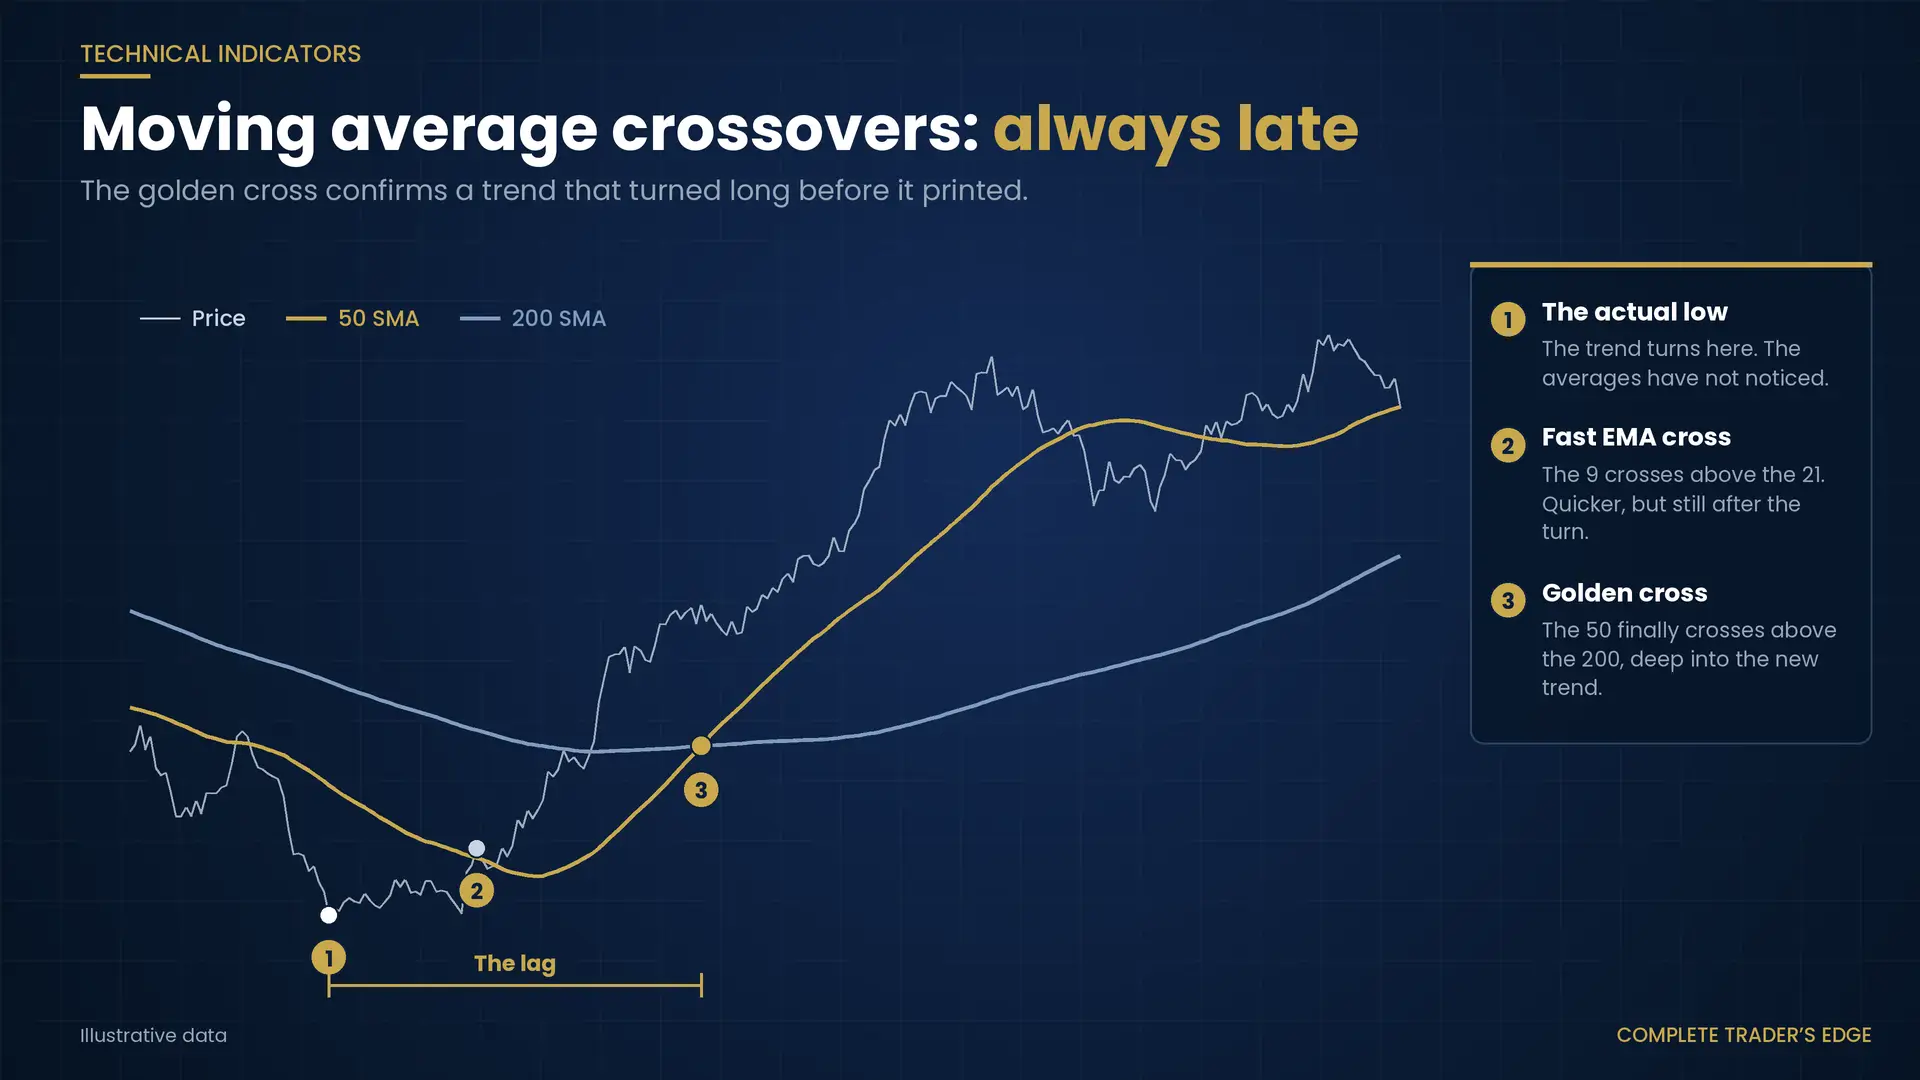
The two most famous versions use the 50-period and 200-period averages. The golden cross – the 50 crossing above the 200 – is treated as a major bullish signal. The death cross – the 50 crossing below the 200 – is treated as a major bearish one. Faster EMA crossovers (like the 9 and 21) are popular for shorter-term trading.
Why Crossovers Lag
A moving average is an average of past prices, so a crossover of two averages is a signal built on old data twice over. By the time a golden cross prints, the trend it is announcing has usually been underway for a while – the low is well behind you, and a good portion of the move is already gone. This is the crossover’s defining weakness: it confirms trends late and reverses late.
The lag is at its worst in ranging markets, where the two averages cross back and forth repeatedly with no follow-through, handing you a string of whipsaw losses. A crossover system traded blindly in a sideways market is a reliable way to bleed. This is exactly why the crossover works better as context than as a trigger.
How to Use It Properly
As a trend filter, not an entry. This is the crossover’s real strength. Use the relationship between the averages to define your bias: when the fast average is above the slow one, you look for long setups only; when it is below, shorts only. You are not entering on the cross – you are using it to decide which direction you are allowed to trade, then taking entries from structure and location.
The golden cross as a regime marker. On higher timeframes, a golden cross can mark a genuine shift in the broader trend regime – useful for framing your longer-term bias, even though it is far too slow to time an entry.
Combine timeframes. Let a crossover on the higher timeframe set your directional bias, then drop down to find precise, lower-risk entries with price action. The average sets the direction; the chart gives you the trade.
Crossovers set the bias, not the entry. By the time two averages cross, the market has already moved. Use the cross to decide which direction you are hunting, and let structure and price action time the actual trade.
The Limitations to Respect
Crossovers lag by design and whipsaw badly in ranges, producing their worst signals exactly when the market is going nowhere. The specific periods (50/200, 9/21) are not magic numbers – they are conventions, and no combination is inherently “correct.” Like every indicator, a crossover is a derivative of price that describes the past. Let the trend and the chart itself lead, and use the averages to keep you honest about direction.
Key Takeaways
- A crossover is a fast moving average crossing a slow one – bullish above, bearish below.
- Golden cross = 50 above 200 (bullish); death cross = 50 below 200 (bearish).
- Crossovers lag heavily and whipsaw in ranges – a poor entry trigger.
- Their real value is as a trend filter: they tell you which direction to trade, not when.
- Set bias with the cross on a higher timeframe; time entries with structure and price action.
Frequently Asked Questions
Is the golden cross a reliable buy signal?
Not as a precise entry. A golden cross confirms that a trend has already turned bullish, but because it is built on the 50 and 200 averages, it prints well after the low – much of the move is often already gone. It is far more useful as a marker of a shift in the broader trend regime than as a timing signal for an entry.
Should I use EMA or SMA for crossovers?
EMAs weight recent prices more heavily, so they react a little faster and lag slightly less – useful for shorter-term crossovers. SMAs are smoother and slower, which some traders prefer for the big-picture 50/200 signals. Neither is objectively better; both lag, and both work best as a bias filter rather than a trigger.
Moving averages are covered alongside the core tools in our guide to trading indicators and when they actually help.
Learn where indicators fit within a structure-first method using the Mind · Method · Money framework in The Complete Trader’s Edge by Louw van Riet.
 The Complete Trader's Edge
The full Mind · Method · Money framework. 70 chapters.
View on Amazon →
The Complete Trader's Edge
The full Mind · Method · Money framework. 70 chapters.
View on Amazon →
 Market Mayhem
400 years of bubbles, crashes, and the pattern that keeps repeating.
Buy on Amazon →
Market Mayhem
400 years of bubbles, crashes, and the pattern that keeps repeating.
Buy on Amazon →
 Greatest Companies
How the world's greatest companies were built — and what traders learn from them.
View on Amazon →
Greatest Companies
How the world's greatest companies were built — and what traders learn from them.
View on Amazon →
 Greatest Traders
Eighty-six lives that explain the markets — Livermore to Madoff, told with the losses left in.
View on Amazon →
Greatest Traders
Eighty-six lives that explain the markets — Livermore to Madoff, told with the losses left in.
View on Amazon →