

The United States has just harvested its smallest hard red winter wheat crop since 1957, and the price of that wheat is falling. KC hard red winter futures traded at $6.39 a bushel on 3 November 2026, down 26% from the $8.58 high set in the week of 31 August and back to roughly where they sat in March. The crop shortage is real, confirmed by the USDA’s final numbers. It just stopped being news months ago, and the things that moved wheat after that had little to do with Kansas.
Peter Brandt summed it up on X on 2 November: “Often best to ignore fundamental narratives.” This piece explains why that line holds for wheat this year, using the USDA’s own crop and stock figures, 21 years of TradingView price data adjusted for inflation, and the timeline of what actually drove the price. It then sets out what the episode means for anyone thinking about wheat, or any commodity, as an investment.
What Brandt Posted, and Why It Landed
Brandt’s post paired one sentence of fundamentals with one chart. The fundamental: hard red winter wheat had just produced the smallest US harvest in half a century. The chart: July 2027 KC wheat futures, falling steadily from about $8.60 in early September to $6.62, trading below a downward-sloping moving average.
Anyone who read the crop headlines in May would have expected the opposite. A historic shortage of the most widely grown US wheat class sounds like a reason for prices to rise and stay high. Instead, the market has done what Brandt has spent fifty years telling traders it often does: priced the story early, then moved on to the next one while the story was still being repeated.
One detail in his chart matters. July 2027 is next year’s crop, not this year’s. The market is telling you what it expects for wheat that has not been planted yet, and right now it does not expect a repeat of 2026.
How Small Was the 2026 Crop?
Very small, by any measure. The USDA’s Small Grains Annual Summary on 30 September put total US wheat production at 1.53 billion bushels, down 23% from 1.99 billion in 2025. Winter wheat harvested area was a record low. The damage was concentrated in hard red winter wheat, the bread-flour class grown across Kansas, Oklahoma, Texas and Colorado, where drought and spring freezes cut yields and forced growers to abandon acres.
| Class | 2025 | 2026 | Change |
|---|---|---|---|
| Hard red winter | 806m bu | 466m bu | −42% |
| Soft red winter | 353m bu | 294m bu | −17% |
| Hard red spring | 460m bu | 416m bu | −9% |
| Durum | 86m bu | 65m bu | −24% |
| All wheat | 1,989m bu | 1,534m bu | −23% |
The USDA’s Economic Research Service described the hard red winter crop in June as the smallest since the 1957/58 marketing year, and later estimates only cut it further. Brandt’s “50 years” actually understates it: on hard red winter alone, you have to go back nearly 70.
The shortfall also unfolded in public, month by month. The first official forecast came in the 12 May World Agricultural Supply and Demand Estimates (WASDE): 1.561 billion bushels of all wheat, the smallest since 1972. June put hard red winter at 497 million bushels. July cut it to 471 million. The September survey settled at 466 million. Every one of those reports was a headline. By the time the last one landed, nobody in the market was surprised.
The Price, Week by Week
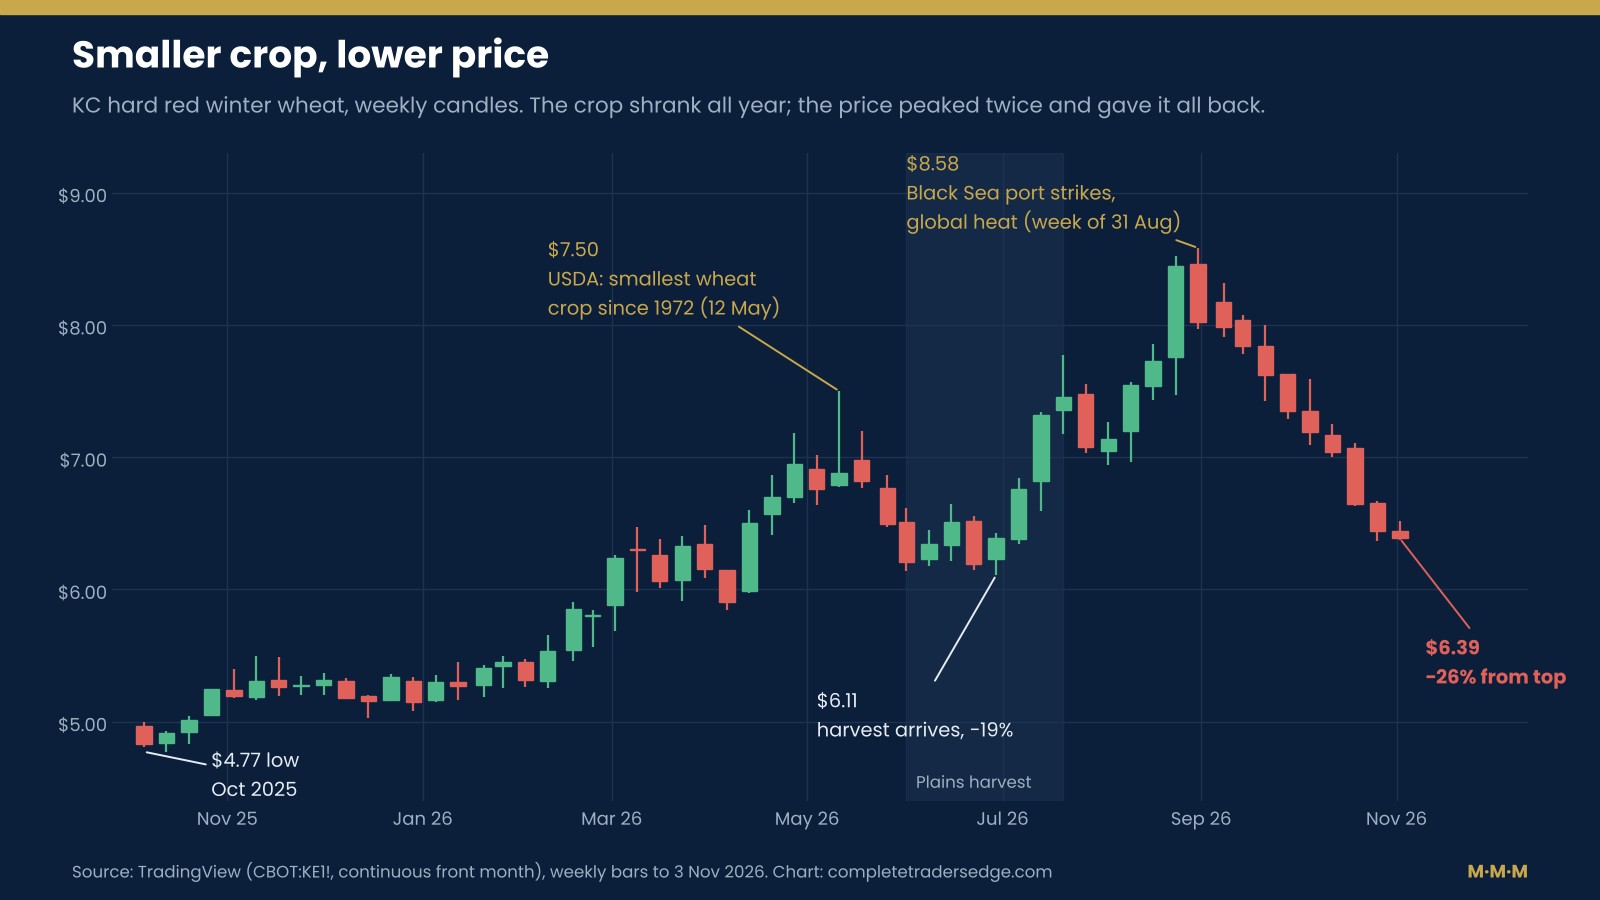
Put the price next to the crop reports and the year splits into four phases.
Phase 1: the forecast rally (October 2025 to May 2026)
KC wheat bottomed at $4.77 in the week of 13 October 2025. Through the winter and spring, as the drought across the southern Plains worsened and crop ratings fell, it climbed steadily. The rally peaked in the week the USDA published its first forecast, touching $7.50 intraday in mid-May, the highest level since September 2023. From the October low that was a 57% gain. The shortage was being priced while it was still a forecast.
Phase 2: harvest pressure (May to early July)
Then the combines rolled. As harvest moved north through Texas, Oklahoma and Kansas, the price fell 19%, to a weekly low of $6.11 at the end of June. This is the oldest pattern in agricultural markets. Farmers sell grain off the field, hedgers who held short positions through the growing season close them, and the “will there be enough?” premium leaves the price once the crop is physically in the bin. The harvest was terrible, and the price still fell while it was being collected.
Phase 3: the Black Sea rally (July to August)
The second and larger rally came after the Plains harvest was over, and it was not about the Plains. Through July and August, Russia and Ukraine escalated strikes on each other’s Black Sea grain ports. Al Jazeera, citing Ukraine’s Ministry of Infrastructure, reported that July alone saw 35 Russian attacks on vessels in port, 22 at sea and 67 on port facilities, against 14 vessel strikes in the whole of 2025. Ukrainian drones disrupted Russian shipments from the Sea of Azov, and attacks on Novorossiysk and Taman raised freight and insurance costs. On top of that, heat cut crop forecasts in Canada and Europe.
CME Group calculated that war damage to port infrastructure had cut year-on-year agricultural exports by 75% from Ukraine and 50% from Russia. Chicago wheat hit a three-year high on 28 August, and KC wheat reached $8.58 in the following week. Joe Glauber of the International Food Policy Research Institute put the core of it plainly: “it’s not a question of availability, it’s a question of affordability.” The world had wheat. It was the cost of moving it that spiked.
Phase 4: the unwind (September to now)
What drives a price up on logistics can drive it down just as fast when the logistics news turns. Through September and October, reports of renewed Russia–Ukraine talks raised the prospect of Black Sea exports recovering. Southern Hemisphere crops looked better: Argentina’s Rosario grain exchange raised its 2026/27 wheat forecast to 23.8 million tonnes from 21 million. US winter wheat planting went in under favourable weather. Chicago wheat lost 6.5% in a single week in late October. KC wheat has closed lower in every one of the nine weeks since its August high and now trades at $6.39.
The pattern in one sentence
The US crop drove the first rally and was fully priced by May. The bigger rally came from the Black Sea, after the US harvest was finished. The decline happened while the US shortage was being confirmed in the official numbers.
Why a Record-Small Crop Did Not Keep Prices High
It is worth being specific about why the obvious trade failed, because the same reasons apply to almost every supply story in every commodity.
1. Futures price what is coming, not what has happened
A futures market is a forecast with money behind it. By the time a shortage shows up in an official harvest report, traders who watched the drought monitor, the crop condition ratings and the rainfall maps through spring have already bought. The May high was the moment the forecast became consensus. After that, the crop could only surprise by being better or worse than expected, and it came in roughly as expected.
2. The cupboard was full before the crop failed
The US started the 2026/27 season with 935 million bushels of wheat already in storage, according to the USDA. That buffer is why, even after the smallest crop since the early 1970s, the October WASDE still projects 740 million bushels left over at the end of the season, about 40% of a full year’s use. A bad harvest after several good ones is a smaller problem than the headline suggests.
3. The US grows about 5% of the world’s wheat
The USDA puts 2026/27 world wheat production at 822 million tonnes. The US share is 41.7 million tonnes, roughly 5%. Russia alone is forecast at 88 million tonnes, the European Union at 133 million. Kansas wheat is priced in Kansas City, but it competes for buyers in Cairo and Jakarta against Black Sea, European, Canadian, Australian and Argentine grain. A US shortage is a world price story only if the rest of the world is short as well.
4. High prices fix high prices
When US wheat got expensive, buyers went elsewhere. The October WASDE cut projected US exports by 25 million bushels to 750 million, and imports rose to 145 million. That is the market rationing a short crop through price: less leaves, more comes in, and the stock cushion holds. The USDA’s forecast season-average farm price for 2026/27 is $6.30, down 10 cents from September.
5. The real driver changed, and then reversed
The August peak was built on Black Sea disruption and Northern Hemisphere heat, neither of which had anything to do with Kansas yields. Once peace-talk headlines and better Southern Hemisphere crops undercut that story, the premium went, and the US crop shortage could not hold the price up on its own. A trader who held wheat because of the US harvest would have been right about the harvest and wrong about the price.
Wheat in Today’s Money
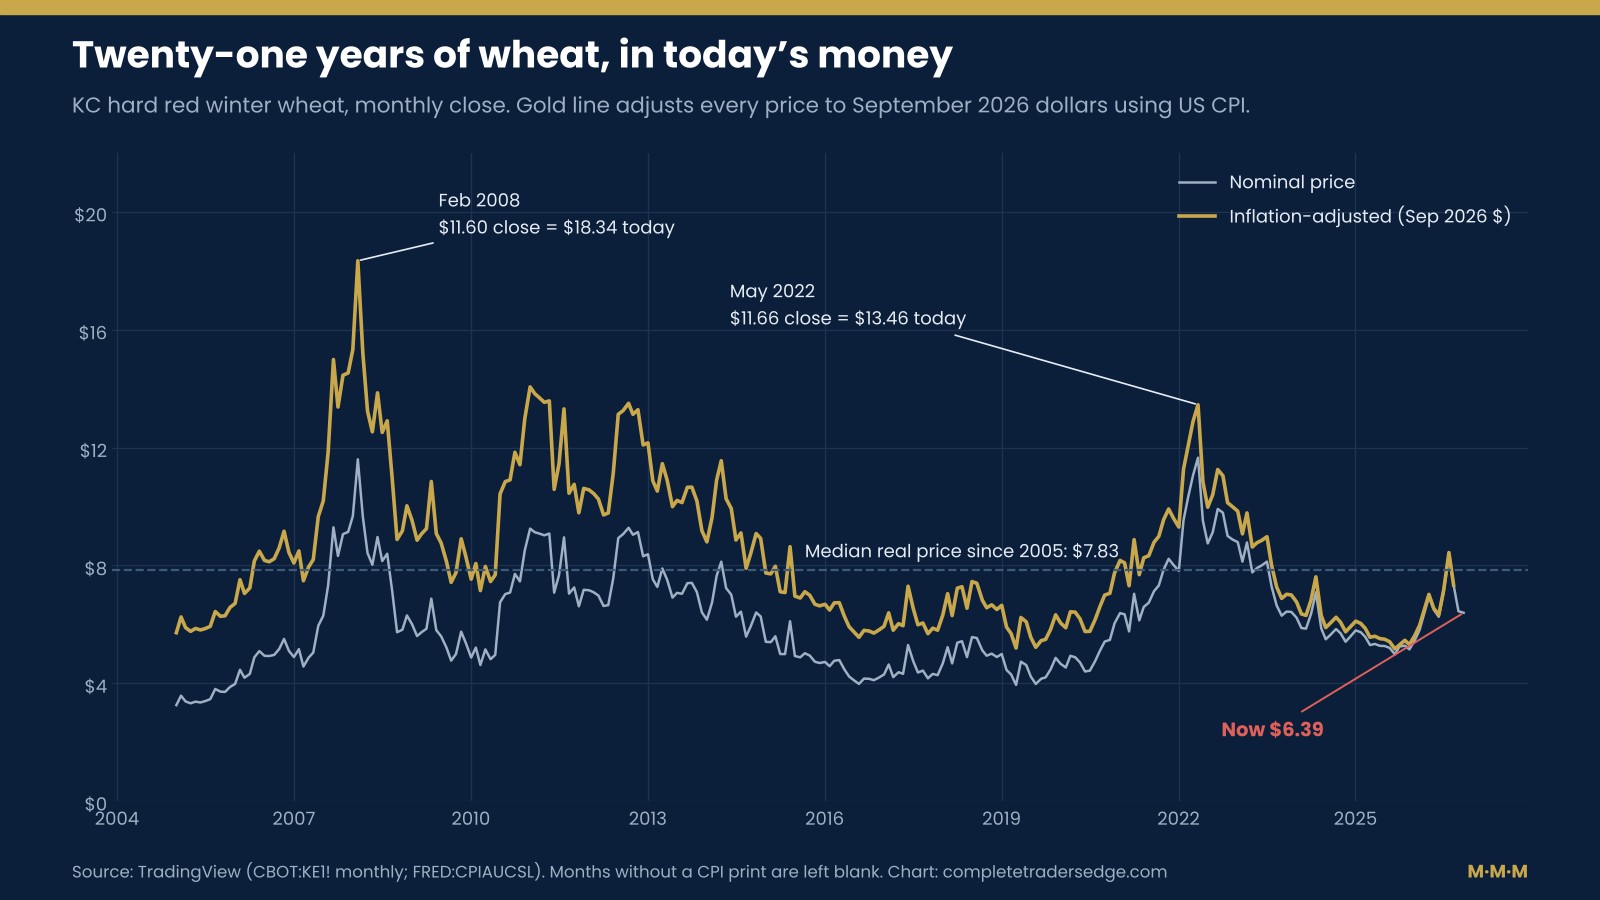
The nominal chart makes $6.39 look ordinary. The inflation-adjusted chart makes it look cheap. Converting every monthly close since 2005 into September 2026 dollars:
- February 2008: KC wheat closed the month at $11.60, worth $18.34 in today’s money. The intramonth high of $13.95 is about $22 today.
- May 2022: after Russia’s invasion of Ukraine, the month closed at $11.66, or $13.46 in today’s money. The high of $13.79 is about $15.92.
- The median since 2005: $7.83 a bushel in today’s money. Only about 27% of months since 2005 closed at a lower real price than $6.39.
Go back further and the gap widens. In February 1974, during the grain shock that followed the Soviet purchases of 1972, Chicago wheat futures traded as high as $6.36 on TradingView’s monthly series. Adjusted for US inflation since then, that is about $45 a bushel today. At $6.01 today, Chicago wheat is still below that 1974 peak in nominal terms, 52 years later.
Two honest caveats. First, a low real price is not a signal. Farming has become far more productive since 1974, so wheat is cheaper to grow, and it can stay cheap in real terms for decades. Second, cheap in history is not the same as cheap against the current supply picture. With 276 million tonnes of world stocks forecast for the end of 2026/27, the market is not short of wheat. It is the same lesson as silver’s fall from $121: history tells you the range, not the timing.
What It Means for Investors
The continuous chart is not a return you could have earned
Most wheat charts you will see, including the one above, splice together the nearest futures contract month after month. That is useful for seeing price, and misleading for judging returns. On 3 November, the continuous KC chart showed a 24.0% gain for 2026. The December 2026 contract itself, which you could actually have bought on 1 January and held, is up 11.6% over the same period.
| Instrument (TradingView, 3 Nov 2026) | Price | 2026 to date | Last month |
|---|---|---|---|
| KC HRW wheat, continuous front month (KE1!) | $6.385 | +24.0% | −13.4% |
| KC HRW wheat, December 2026 contract | $6.385 | +11.6% | −13.4% |
| Chicago SRW wheat, continuous (ZW1!) | $6.0125 | +18.7% | −11.8% |
| Teucrium Wheat Fund (WEAT) | $22.06 | +10.5% | −11.3% |
The gap is the cost of rolling. At the start of the year, later-dated wheat contracts traded above the nearby ones, a shape called contango. Anyone holding wheat through futures has to keep selling the expiring contract and buying the next, more expensive one. The continuous chart hides that cost. The December contract and the WEAT fund, which holds Chicago wheat futures rather than KC, both show it. If you buy a commodity fund to express a view on a crop, you are buying the futures curve as well as the crop.
Futures give you the exposure and the risk in full
One KC wheat contract covers 5,000 bushels, so every 10-cent move is $500 a contract. Wheat moved 26% in nine weeks this autumn and 19% in seven weeks in early summer. That is equity-crash volatility in a market that looks sleepy on a long chart. Our guide to how to trade futures covers margin, contract specifications and the position sizing maths before you put a cent at risk.
Wheat is a thin slice of a portfolio, not a core holding
Commodities carry no earnings or coupons. Over the long run, the return of holding a commodity through futures comes from price changes, roll yield and the interest earned on the cash held as margin, and roll yield can be negative for years at a time. Wheat can earn its place as a short-term hedge against food inflation or a tactical trade around a specific shock. As a buy-and-forget investment, the 2026 table above is the argument against it. For the long-only case made by its best-known advocate, read our profile of Jim Rogers.
The price is set by the marginal story, not the biggest one
The most important US crop fact of the year was the hard red winter shortfall. The facts that moved the price were Black Sea port strikes, Canadian heat, Argentine rain and peace-talk headlines. That is common in commodities: the price follows whatever is changing at the margin, and the obvious fact is usually already in it. Oil traders learned the same thing in 1973, as we covered in $100 Oil and a Market Built on a Few Giants.
What to Watch Next
- Plains moisture this winter. Brandt’s chart is July 2027 wheat. The 2027 crop is being planted now, and rain or snow across Kansas and Oklahoma over the next four months matters more to that contract than anything about 2026.
- Black Sea ports and any talks. This was the biggest single driver of the August spike and the September–October decline. A collapse in talks or a new round of port strikes is the clearest route back above $7.
- Russian export pace. The USDA cut Russia’s projected exports from 43 to 40 million tonnes in October while leaving its crop at 88 million. If that grain moves after all, the world will be better supplied than the forecast suggests.
- Southern Hemisphere harvests. Argentina and Australia harvest from now into the new year. Rosario’s 23.8 million tonne estimate for Argentina is well above the USDA’s 21.5 million, and Australia is forecast at 31 million.
- The chart. KC wheat is below its falling moving average, and each rally since September has failed lower. A higher weekly low followed by a reclaim of the average would be the first evidence the decline is finished. Until then, the trend is down.
- Positioning. The weekly CFTC report shows whether speculators have turned heavily short, which is often the fuel for sharp short-covering rallies in grains. Our guide to the COT report explains which columns to read.
How to Approach It: Mind, Method, Money
Mind. The trap this year was certainty. “Smallest crop since 1957” is a sentence that makes buying feel obvious, and obvious trades are crowded trades. The same sentence was true in June at $6.11, in August at $8.58 and today at $6.39. A fact that is true at every price cannot tell you which price is right.
Method. Use fundamentals to choose which markets to watch and price to decide when to act. A shortage story is a reason to put wheat on the screen. It is not an entry. Brandt’s approach, waiting for the chart to confirm the story before committing, would have kept a trader out of the September–October slide, because the trend turned before the narrative did.
Money. Wheat’s swings this year were the size of a stock market crash. Size for that. ATR position sizing automatically cuts your size when the market’s average range widens, and portfolio heat stops one volatile commodity from dominating the account. Before any trade, run the numbers through the CTE trading calculators.
The Bottom Line
The 2026 US hard red winter wheat crop was the smallest since 1957, and the price of that wheat is 26% below its August high. Both facts are true at the same time because the market priced the shortage in spring, the US entered the season with plenty of wheat in storage, the US grows only about 5% of the world’s crop, and the biggest rally of the year came from Black Sea logistics that have since eased. In today’s money, wheat is below its 21-year median. That makes it historically cheap, but not necessarily a buy. For investors, the lesson reaches well beyond wheat: by the time a supply story is a headline, it is usually in the price. Watch what is changing, let the chart confirm it, and size every commodity position as if it can lose a quarter of its value in two months, because this year it did.
Prices and data are as at 3 November 2026 unless stated. This article is market commentary for education, not a recommendation to buy or sell.
Data
TradingView – CBOT:KE1! weekly (October 2025–November 2026) and monthly (2005–2026) bars, CBOT:ZW1! monthly bars including 1972–1974, KEZ2026, KEN2027 and AMEX:WEAT quotes, and FRED:CPIAUCSL monthly CPI, retrieved 3 November 2026. All charts and inflation adjustments in this article are built from this data.
USDA
Small Grains 2026 Summary (30 September 2026) – production by class, yield and harvested area. WASDE, 9 October 2026 – US and world supply, exports, ending stocks and farm price. ERS Wheat Outlook, June 2026 – hard red winter at a 1957/58 low, beginning stocks.
Market reporting
Washington Association of Wheat Growers / AgWeb – the May forecast of the smallest crop since 1972. Wikifarmer – the mid-May high in HRW futures. Al Jazeera, 31 August 2026 – Black Sea port attacks, weather and Joe Glauber’s comments. CME Group OpenMarkets, September 2026 – Ukrainian and Russian export declines. Farmers Weekly, 28 October 2026 – peace-talk hopes, Argentina’s revised crop and the late-October decline.
Commentary referenced
Peter Brandt (@PeterLBrandt) on X, 2 November 2026.
 The Complete Trader's Edge
The full Mind · Method · Money framework. 70 chapters.
View on Amazon →
 Market Mayhem
400 years of bubbles, crashes, and the pattern that keeps repeating.
Buy on Amazon →
 Greatest Companies
How the world's greatest companies were built — and what traders learn from them.
View on Amazon →
 Greatest Traders
Eighty-six lives that explain the markets — Livermore to Madoff, told with the losses left in.
View on Amazon →