The trading journal is the single most consistently recommended tool in professional trader development, and the most consistently ignored by retail traders. This gap is not coincidental. Journalling requires honesty, discipline, and a willingness to confront uncomfortable truths about your own behaviour. These are exactly the qualities that separate improving traders from stagnating ones.
A trader without a journal is repeating mistakes they cannot see. They have no data on which setups work best, which sessions produce the worst results, or which emotional states correlate with rule violations. They are flying blind in a game where self-knowledge is the ultimate edge. This article gives you a complete journal system you can implement today.
Trade Log vs Trading Journal: The Critical Difference
Most traders who claim to keep a journal actually keep a trade log: a spreadsheet of entries, exits, and P&L. That is useful but incomplete. It answers “what happened” but not “why it happened” or “what should I do differently.”
| Trade Log (Incomplete) | Trading Journal (Complete) |
|---|---|
| Entry price, exit price, P&L | Entry price, exit price, P&L plus the setup criteria that justified the trade |
| Date and instrument | Date, instrument, session, and time of entry relative to Kill Zone |
| Win or loss | Win or loss plus process score (did you follow your plan?) |
| No emotional data | Emotional state before, during, and after the trade |
| No forward action | Specific lesson and action item for next session |
What a Complete Journal Entry Contains
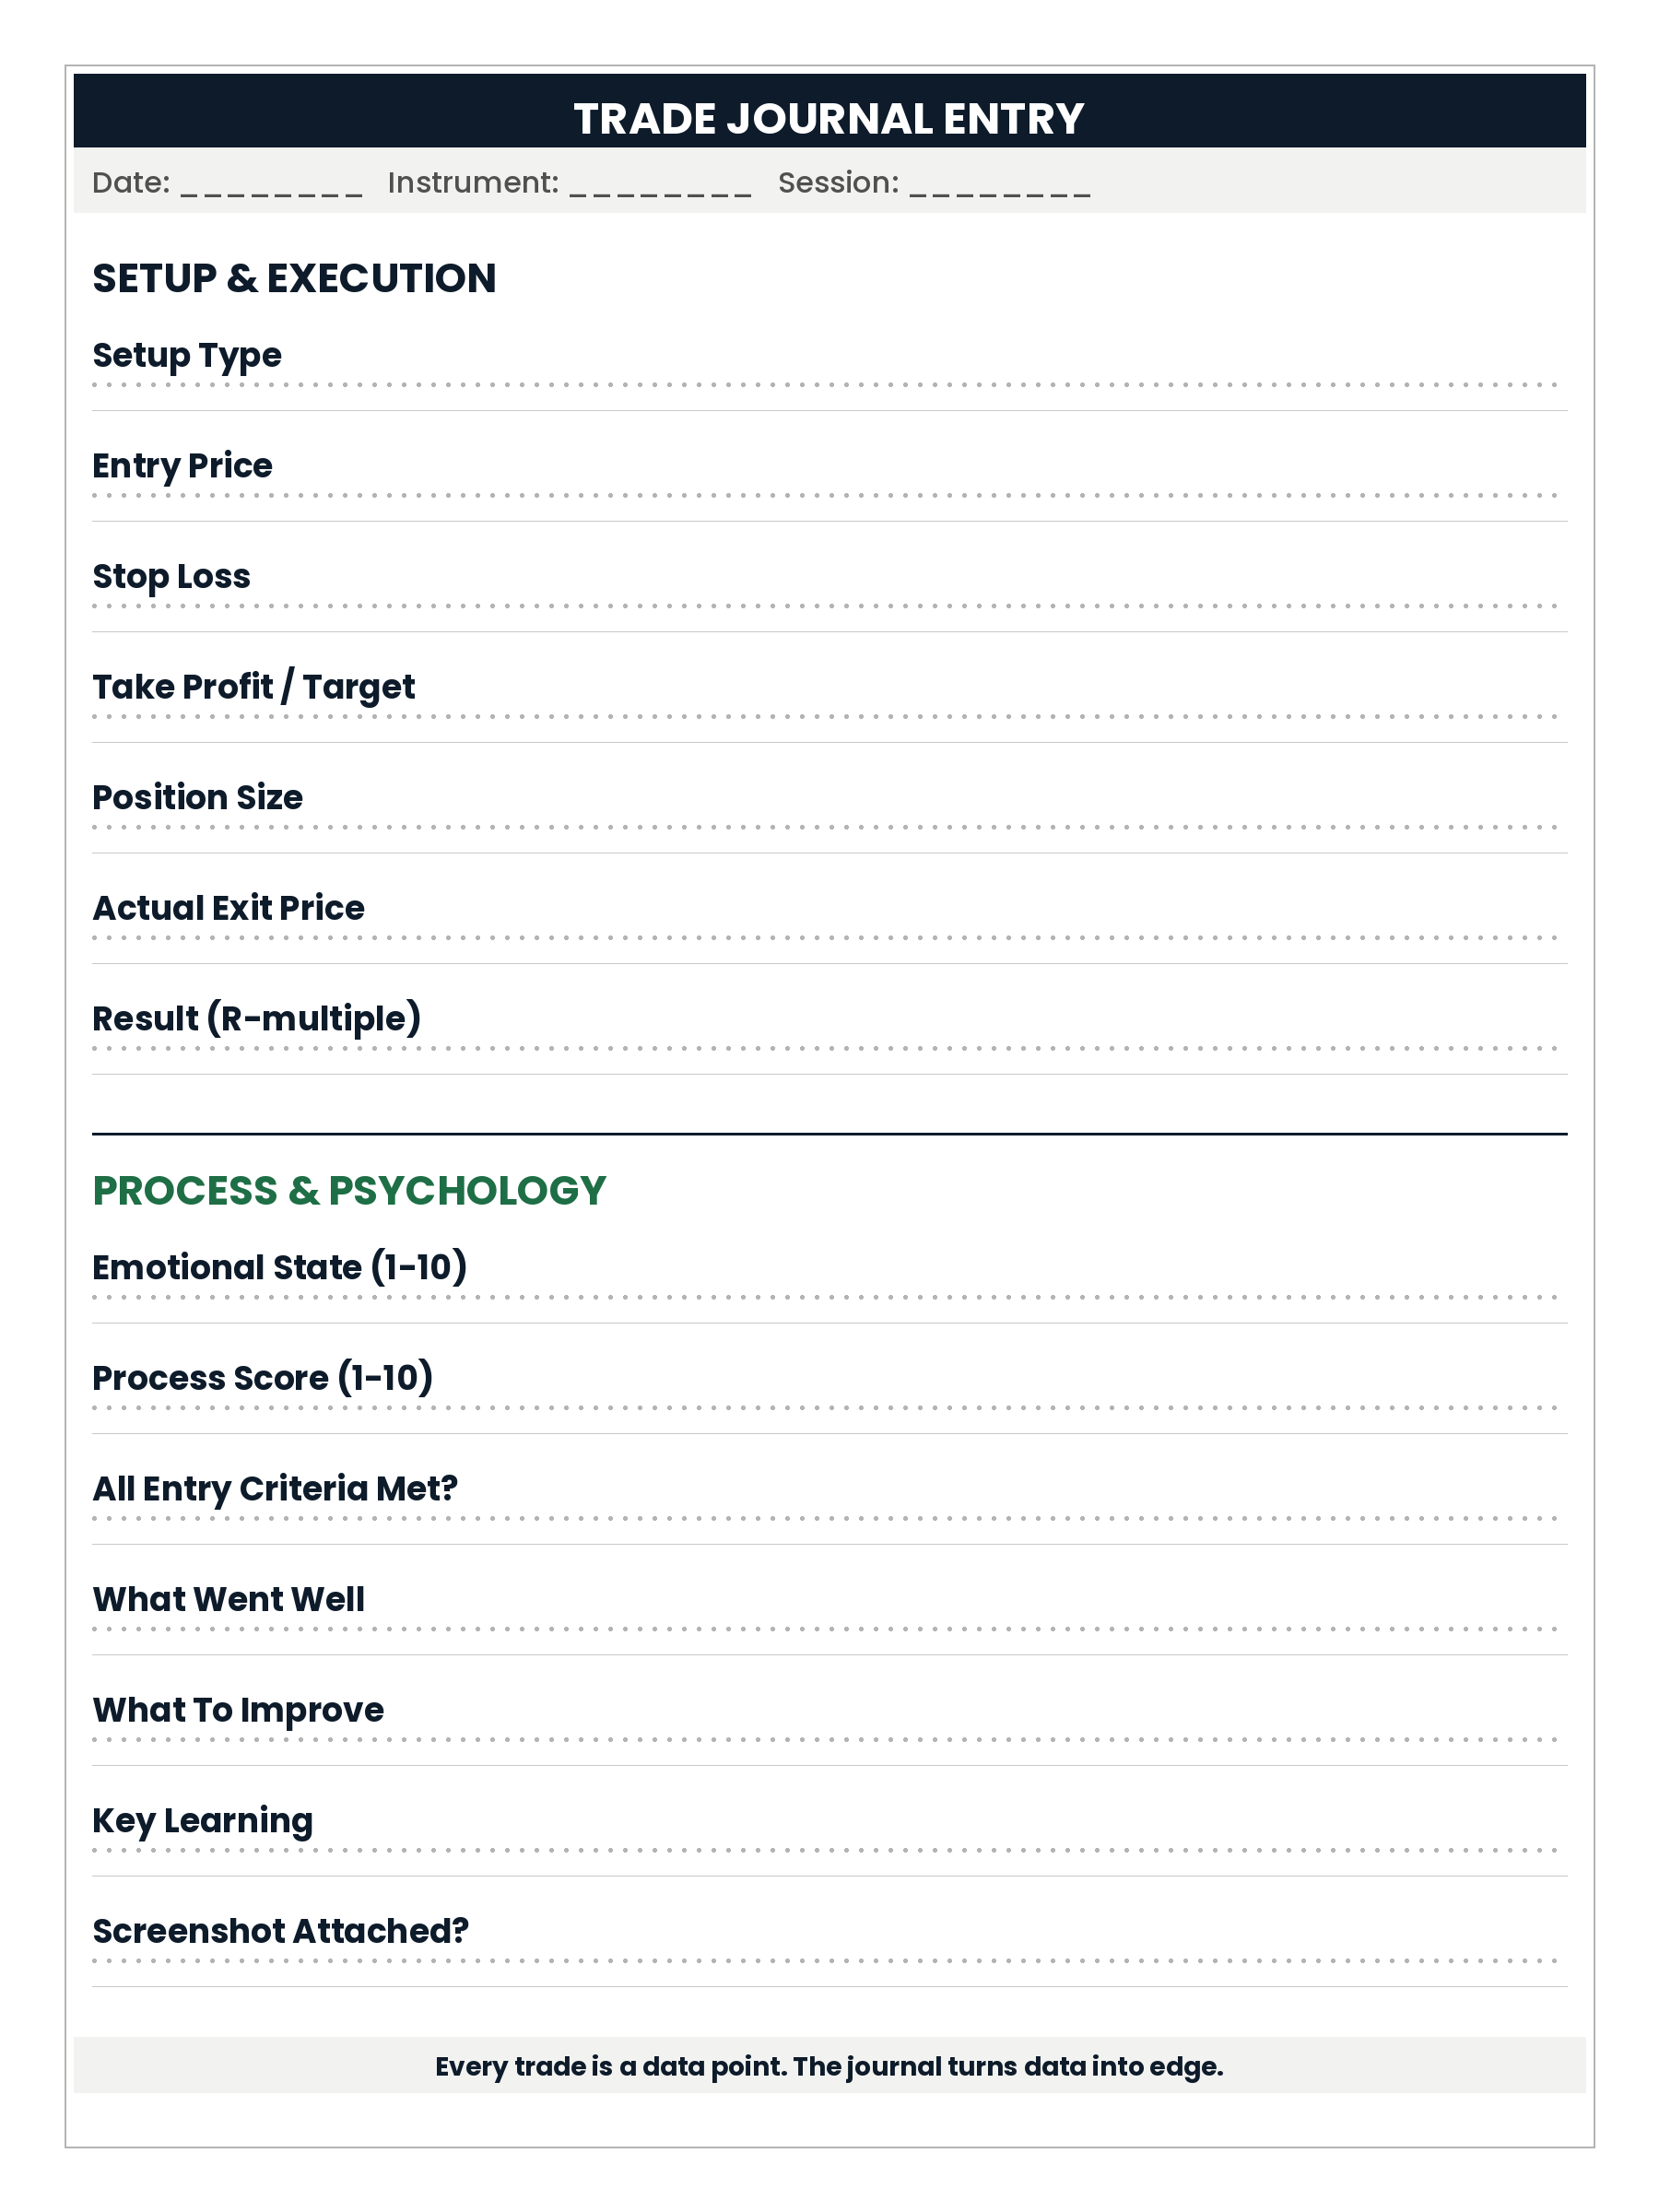
Every journal entry should capture seven elements. This takes 3 to 5 minutes per trade. The return on that time investment compounds over months into a level of self-knowledge that no course or mentor can provide.
1. Pre-trade analysis. Before you enter, write down why you are taking this trade. What is your market structure bias? What specific setup triggered the entry? What confluence factors are present (Order Block, FVG, Fibonacci, Volume Profile)? Writing this before entry forces you to articulate a thesis rather than reacting impulsively.
2. Entry details. Instrument, entry price, stop loss level, take profit target, position size, and the calculated risk in both percentage and dollar terms. This is the quantitative backbone of the entry.
3. Emotional state at entry. Rate your emotional state on a simple 1-to-5 scale. 1 means calm, focused, and executing the plan mechanically. 5 means anxious, frustrated, or driven by fear or greed. Over time, correlating this number with outcomes reveals your optimal emotional operating range.
4. Trade management notes. What happened while the trade was open? Did you move your stop? Adjust your target? Feel the urge to close early? Did you follow your management plan or deviate? These mid-trade decisions are where most edge is lost or preserved.
5. Exit details. Exit price, actual R:R achieved, and the reason for exit: target hit, stop hit, manual close (and why), or trailing stop triggered.
6. Process score. Did you follow your trading plan on this trade? Score 1 (fully adhered) or 0 (deviated). A trade that followed your rules but lost is scored 1. A trade that broke rules but won is scored 0. This is the single most important number in your journal. Over 50 trades, your average process score tells you more about your trajectory than your win rate.
7. Post-trade reflection. One to three sentences answering: What did I learn? What will I do the same or differently next time? This converts the trade from an event into a lesson.
Screenshot Your Charts
Every journal entry should include two chart screenshots: one at the moment of entry and one at exit. Mark your entry, stop, and target on the entry screenshot. These visual records are invaluable during weekly reviews because they capture context that numbers alone cannot. Six months from now, you will look back at these screenshots and see patterns in your entries that are invisible in a spreadsheet.
The Weekly Review: Where the Real Value Lives
Individual journal entries capture data. The weekly review transforms that data into insights. Spend 30 to 60 minutes every weekend reviewing the week’s trades. This is the single highest-leverage activity in your trading development.
The weekly review should answer these specific questions:
Performance metrics: How many trades this week? Win rate? Average R:R? Total R gained or lost? Process adherence score?
Pattern analysis: Which sessions produced the best results? Which setups had the highest win rate? Were losses clustered on specific days, times, or emotional states? Were there any revenge trades or off-plan entries?
Process quality: How many trades scored 1 on process adherence? For the trades that scored 0, what caused the deviation? Is there a recurring pattern in your rule violations?
Emotional patterns: What was your average emotional state score? Did trades taken at emotional state 4 or 5 perform worse than those at 1 or 2? If so, this is direct evidence that your emotions are costing you money, and you now know exactly when.
Action items for next week: Write one to three specific, actionable changes. Not vague intentions like “be more disciplined” but concrete rules like “no trades after 2 PM EST” or “reduce size to 0.5% after hitting daily loss limit.”
The Monthly and Quarterly Review
Beyond weekly reviews, a monthly review looks at broader patterns: is your equity curve trending upward? Are your process scores improving? Are specific instruments or sessions consistently underperforming? The quarterly review is strategic: are you making progress toward your annual trading goals? Does your strategy need structural adjustment based on three months of data?
These longer-term reviews prevent the myopia of focusing only on the last few trades. They give you the sample size and perspective needed to make meaningful strategic decisions.
Digital vs Physical Journals
Both work. What matters most is consistency. A simple Google Doc or Notion page used every day outperforms a sophisticated platform used intermittently. The best journal is the one you actually use.
That said, digital journals have practical advantages: searchability, easy screenshot insertion, automatic date stamping, and the ability to export data for analysis. Spreadsheet-based journals (Google Sheets or Excel) allow you to calculate win rates, average R:R, and process scores automatically.
The companion Trading Journal published alongside The Complete Trader’s Edge is designed with all seven fields pre-structured, so you simply fill in each section for every trade.
Key Lessons
- A journal records process and psychology, not just entries and exits. A trade log is necessary but insufficient.
- Seven elements per entry: pre-trade analysis, entry details, emotional state, management notes, exit details, process score, and post-trade reflection.
- Process score (plan adherence) is more important than P&L for measuring development.
- Weekly reviews reveal patterns invisible at the individual trade level. This is where compounding improvement happens.
- Consistency beats sophistication. Simple tools used daily outperform complex ones used occasionally.
Frequently Asked Questions
How long should I spend journalling each trade?
Three to five minutes per trade for the entry, plus two to three minutes for the post-trade reflection. The weekly review takes 30 to 60 minutes. This means a trader taking 3 to 5 trades per day spends roughly 20 to 30 minutes daily on journalling and 45 minutes on the weekend review. Total weekly time: about 3 hours. The return on this investment, measured in avoided mistakes and accelerated learning, is the highest of any activity in trading.
I trade many times per day. Do I journal every single trade?
Yes, initially. If you are taking 15+ trades per day and full journalling is genuinely unsustainable, use a condensed format: setup type, process score (1 or 0), emotional state (1-5), and one sentence on deviation if process score is 0. But the deeper question is whether 15+ trades per day is optimal. Most traders who journal every trade discover that their win rate and R:R are significantly better on their first 3 to 5 trades compared to later ones. The journal itself reveals the overtrading problem.
What is the best journalling software?
For most traders, a simple spreadsheet (Google Sheets or Excel) combined with a document for written reflections (Notion, Google Docs) is sufficient. Dedicated platforms like Edgewonk and TraderSync offer more advanced analytics but are only valuable if you use them consistently. Start with the simplest tool that captures all seven journal elements. Upgrade to specialised software only after you have established the daily journalling habit, typically after 60 to 90 days of consistent use.
What if I do not have time for a weekly review?
Make time. This is not optional if you are serious about improvement. The weekly review is where pattern recognition happens, where process violations become visible, and where action items for the next week are defined. If you cannot find 45 minutes on the weekend to review your trading, you need to examine whether you are treating trading as a business or a hobby. Businesses review their performance data. Hobbies do not.
Should I journal demo trades the same way as live trades?
Yes. The journalling habit should be established before you trade live. Demo trading with a full journal builds the neural pathway of analyse-execute-review that you will rely on when real money is at stake. It also provides your first data set: after 50 demo trades with complete journal entries, you will know your win rate, average R:R, process adherence score, and emotional patterns before risking a single dollar. That data gives you a massive advantage over traders who go live without any baseline performance information.
Continue Reading
▶ Trading Journal: The Complete System for Building Your Edge
▶ How to Build an Unbreakable Trading Routine
From The Book
This article covers concepts from Chapter 15 of The Complete Trader’s Edge.