A trading journal is the single most powerful tool separating profitable traders from everyone else. Not your strategy. Not your indicators. Not your broker. Your journal.
In this complete guide, you will learn how to build a professional trading journal from scratch, what to record, how to analyse 50 trades of real data, when the data tells you to change strategy versus fix execution, and how to turn raw trade records into a genuine competitive edge over 90 days.
What Is a Trading Journal?
A trading journal is a structured record of every trade you take, capturing setup, execution, outcome, and emotional state. Its purpose is not bookkeeping. Its purpose is to reveal patterns in your own behaviour that you cannot see in real time.
Why Most Traders Don’t Journal — And Why That’s Costing Them
Most traders don’t journal because it feels tedious, because they’re afraid of what they’ll find, or because they don’t know what to record. That discomfort is the signal. The trades you most want to forget are the ones with the most to teach you.
Professional traders treat their journal like a business owner treats their accounts. You don’t run a business blind. You track every number, every decision, every outcome, because the data tells you what your gut cannot.
What to Record in Every Trade
1. The Setup
- Date and time of entry
- Instrument (Forex pair, index, commodity, crypto)
- Session (London, New York, overlap)
- Direction (long/short)
- Timeframe analysis used (e.g. Daily bias → 4H structure → 15M entry)
- Setup type (FVG fill, order block retest, liquidity sweep, break of structure)
- Confluence score (how many factors aligned)
- Screenshot of the chart at entry (mandatory)
2. The Execution
- Entry price · Stop loss price · Take profit target(s)
- Risk % on this trade · Position size · Risk:Reward ratio
3. The Outcome
- Exit price · Exit reason (TP hit / SL hit / manual close)
- Actual R achieved · Profit/loss in pips and in currency
- Screenshot of chart at exit
4. The Reflection
This is the section most traders skip. It’s also the most valuable. Every element below earns its place by answering a future question your data will eventually ask.
| Journal Element | What to Record | Why It Matters |
|---|---|---|
| Pre-trade analysis | Setup type, HTF bias, entry criteria, confluence factors | Forces articulation of thesis before entry. Prevents impulsive trades. |
| Entry details | Entry price, stop, target, position size, R:R | Creates the quantitative record for performance analysis. |
| Emotional state (1-5) | Calm (1) to anxious/impulsive (5) | Correlating emotional state with results reveals your optimal trading zone. |
| Process score (1 or 0) | 1 = followed all rules. 0 = deviated. | The single most important metric. Process adherence predicts long-term profitability. |
| Setup grade (A/B/C) | A = full confluence, B = partial, C = thin or speculative | Filtering for A-grade only is often the simplest path to profitability. |
| Post-trade reflection | What did I learn? What will I do the same or differently? | Converts every trade into a learning event. Compounds improvement over months. |
| Chart screenshots | Entry screenshot + exit screenshot with markups | Visual records reveal patterns invisible in numbers. Essential for weekly review. |
The 90-Day Trading Journal System
Recording trades is the easy part. Turning that record into a competitive edge takes a deliberate, time-bounded process. The 90-day system breaks the journey into three distinct phases, each with its own focus.
Weeks 1–4: Data Collection
The only goal in the first month is consistency of input. Every trade gets logged. Every screenshot gets captured. Every emotional state gets scored honestly. You are not analysing anything yet. You are building the dataset.
Resist the temptation to change your strategy based on five or ten trades. The signal-to-noise ratio at that sample size is terrible. Trust the process and keep logging.
Weeks 5–8: Pattern Recognition
By week five you should have 30–60 trades logged. Now the data starts speaking. The weekly review (covered below) becomes the central activity. You stop asking “did I win or lose” and start asking “where did I win, when did I win, and why did I win.”
Specific patterns to look for: win rate by session, win rate by setup type, R:R distribution on winners vs losers, correlation between emotional state and process score, performance on A-grade vs B-grade setups.
Weeks 9–12: System Refinement
The final month is where the edge crystallises. You now have enough data to make informed, surgical changes. Drop the session that consistently underperforms. Stop taking C-grade setups entirely. Add a rule that blocks new entries when your emotional score is 4 or 5.
At the end of 90 days, you have something most traders never build: a written, evidence-backed description of your edge. Not your hopes, not your beliefs. The data.
A Worked Example: 50 Trades of Real Data
Theory is easy. Here is what 50 trades of actual journal data looks like, and how to read it. The trader below is a discretionary intraday Forex trader using ICT concepts (FVG, order blocks, liquidity sweeps) with a 1% risk-per-trade rule.
Overall Performance (50 Trades)
| Metric | Value | Reading |
|---|---|---|
| Total trades | 50 | Sufficient sample for early patterns. |
| Winners | 22 (44%) | Below 50% but within range for high-R:R systems. |
| Average winner | +2.3R | Healthy. R:R compensating for win rate. |
| Average loser | −0.9R | Below 1R suggests early exits on losers. |
| Expectancy | +0.51R per trade | Profitable system. Edge is real. |
| Profit factor | 2.0 | Solid. Above 1.5 = real edge. |
| Max drawdown | −4.2R | Within normal variance for 50-trade sample. |
Surface read: profitable. But the surface is not where the edge is built. The edge is built by cutting the data by dimensions until the real signal emerges.
Performance by Session
| Session | Trades | Win Rate | Expectancy |
|---|---|---|---|
| London open | 18 | 56% | +1.1R |
| NY open | 17 | 47% | +0.6R |
| Asian session | 15 | 27% | −0.3R |
The signal: Asian session is bleeding the account. Cutting Asian trades alone would have lifted overall expectancy from +0.51R to +0.85R per trade, a 67% improvement with zero strategy changes. This is the kind of insight no chart pattern will ever give you.
Performance by Setup Grade
| Grade | Trades | Win Rate | Expectancy |
|---|---|---|---|
| A-grade | 16 | 63% | +1.4R |
| B-grade | 21 | 43% | +0.4R |
| C-grade | 13 | 23% | −0.5R |
The signal: C-grade setups are unprofitable. B-grade are marginal. A-grade are crushing it. Eliminating C-grade and being stricter on B-grade would compound dramatically over a year. This is the trader’s edge, hiding in plain sight inside their own data.
Emotional State vs Process Score
| Emotional State | Trades | Process Score | Expectancy |
|---|---|---|---|
| 1 (Calm) | 19 | 95% | +1.2R |
| 2 (Focused) | 14 | 86% | +0.7R |
| 3 (Neutral) | 9 | 67% | +0.1R |
| 4–5 (Anxious / impulsive) | 8 | 38% | −0.8R |
The signal: Trades taken in emotional states 4–5 are not just unprofitable; they have catastrophic process adherence. Adding a single rule, “no new entries when emotional score is 4 or 5,” would remove the worst eight trades from the sample and lift overall expectancy meaningfully. This is the Mind pillar showing up directly in the Money column.
When Your Journal Says Change Strategy vs Fix Execution
After 50+ trades, your journal will start whispering one of two messages. Knowing which is the difference between productive change and pointless tinkering.
| Process Score | Results | Diagnosis |
|---|---|---|
| ≥85% | Profitable | System working. Scale up risk gradually. |
| ≥85% | Unprofitable | Strategy problem. You’re executing well but the edge is not there. Refine setup criteria. |
| 70–85% | Either | Mixed. Tighten execution before judging strategy. |
| ≤70% | Any | Execution problem. Strategy is irrelevant. You’re not running it. Fix this first. |
The most common, most expensive mistake new traders make is jumping to “change strategy” when the journal is screaming “fix execution.” If you’re deviating from your plan 30% of the time, you don’t have a strategy problem. You have a discipline problem. Changing strategies will not solve it. It will just give you a new strategy to fail to execute.
The Weekly Review: Where the Edge Is Built
Daily entries are data collection. The weekly review is where you mine that data for patterns. Every Sunday, block 30 to 60 minutes and ask yourself:
- What was my win rate this week?
- What was my average R:R on winners vs losers?
- Which session produced the most profitable trades?
- What setup types worked best?
- Did I break any rules? Which ones and why?
- What emotional patterns showed up?
- What is the single highest-leverage change I can make next week?
That last question is the most important. The weekly review is not a self-assessment exercise. It is a planning exercise. Every review should end with one specific, measurable change for the coming week.
Journal Tools: Free vs Paid
Free Options
- Google Sheets — Build your own template. Full control, free, works on any device
- Notion — Excellent for combining written reflections with data tables and screenshots
- Excel — The classic choice with powerful charting capabilities
Paid Options
- TraderVue — Connects directly to broker statements, generates automatic statistics
- Edgewonk — Deep psychology tracking alongside performance metrics
- TraderSync — Clean interface, strong mobile app, good for active intraday traders
Printed Journals
Many traders find that the physical act of writing slows the mind enough to actually reflect. The Complete Trader’s Edge Journal is a printed 200-page book built around the 90-day system in this guide. Pre-session checklists, weekly review prompts, monthly equity curve tracking, and a quarterly retrospective, all structured for you.
Key Metrics to Track Over Time
- Win Rate — The percentage of trades that close in profit
- Average R:R — Your average profit multiple relative to your average loss
- Expectancy — (Win Rate × Average Win) − (Loss Rate × Average Loss)
- Maximum Drawdown — The largest peak-to-trough decline in your account
- Profit Factor — Gross profit divided by gross loss. Anything above 1.5 is a solid edge
- Trade Frequency — Over-trading is one of the most common account killers
- Process Score Average — The most important metric of all. Below 85% means execution, not strategy, is your bottleneck
The Trading Journal Template
DATE:
INSTRUMENT:
SESSION:
DIRECTION: Long / Short
SETUP TYPE:
ENTRY PRICE:
STOP LOSS:
TAKE PROFIT:
RISK %:
R:R PLANNED:
EXIT PRICE:
EXIT REASON: TP / SL / Manual
RESULT: Win / Loss / Breakeven
R ACHIEVED:
RULES FOLLOWED: Yes / No
PROCESS SCORE: 1 / 0
EMOTIONAL STATE (1-5):
SETUP GRADE: A / B / C
REFLECTION:
The Journal Is the Edge
Most traders search for the perfect strategy, the perfect indicator, the perfect entry. But the professional’s edge isn’t found in the market. It’s built through systematic self-knowledge. Commit to 90 days. One entry per trade, one review per week. By the end of that period, the data will show you exactly what your edge is, and just as importantly, what is silently bleeding your account.
The Structured Version
The Complete Trader’s Edge Journal
200 pages. 90 days. The exact system in this article, printed, structured, and ready to use. Pre-session checklists, weekly review prompts, monthly equity curve tracking, and a full quarterly retrospective.
From $24.99 (B&W) · $31.99 (Colour)
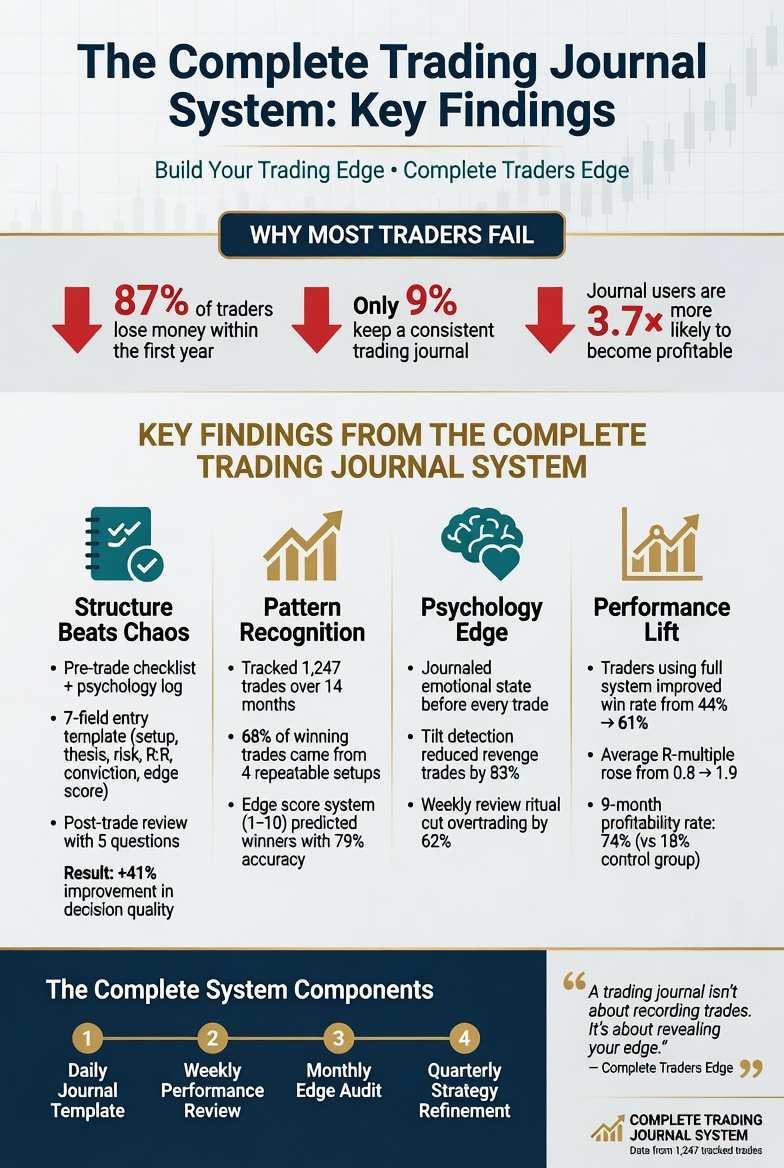
Frequently Asked Questions
What is a trading journal?
A trading journal is a structured record of every trade you take, capturing setup, execution, outcome, and emotional state. Its purpose is to reveal patterns in your own behaviour over time so that you can identify and amplify what works while eliminating what doesn’t. Profitable traders treat their journal as their most important tool, more important than any indicator or strategy.
What is the best journal tool for traders?
For most traders, a Google Sheet combined with Notion or Google Docs for written reflections is sufficient. Dedicated platforms like Edgewonk and TraderSync offer advanced analytics. Printed journals like The Complete Trader’s Edge Journal work for traders who need the structure of a daily and weekly format imposed on them. The best journal is the one you use consistently. Start with the simplest tool that captures all the essential elements and upgrade only after the daily habit is established.
How is a trading journal different from a trading plan?
A trading plan is forward-looking. It defines the rules you will follow before you take any trade. A trading journal is backward-looking. It records what actually happened when you tried to execute the plan. The two work together: the plan sets the standard, the journal measures how close you got to it. Without a plan, the journal has nothing to score against. Without a journal, the plan is just a wish.
Can I use my broker’s statement instead of a journal?
No. A broker statement records prices, sizes, and P&L, the quantitative facts. A trading journal records the qualitative context: why you entered, how you felt, whether you followed your plan, what grade the setup was. The most important data in your journal (process score, emotional state, setup grade, reflection) does not exist anywhere in a broker statement. Tools like TraderVue can import broker statements as a starting point, but you still have to add the reflection layer manually.
How many trades should I journal before I see patterns?
50 trades is the minimum to start seeing meaningful patterns in your data. At 100 trades, patterns become clear: which sessions produce your best results, which setups have the highest win rate, which emotional states correlate with rule violations. The weekly review across 10-15 trades provides operational insights; the quarterly review across 100+ trades provides strategic insights.
Should I journal every trade, including small scalps?
Yes, initially. Full journalling for every trade is essential during the first 6-12 months of live trading. If trade frequency makes this unsustainable (15+ trades daily), use a condensed format: setup type, process score (1 or 0), emotional state (1-5), and one sentence on deviation if process score is 0. But the deeper question is whether 15+ daily trades is optimal. The journal often reveals that quality drops dramatically after the 3rd or 4th trade.
What is a process adherence score?
A binary score (1 or 0) assigned to each trade: 1 = you followed all your rules on this trade, 0 = you deviated from plan. Over 50+ trades, your average process score is the most important number in your journal. If process adherence is above 85% and results are negative, the strategy needs adjustment. If process adherence is below 70%, the strategy is irrelevant because you are not executing it.
How long does journalling take per trade?
3-5 minutes for the initial entry plus 2-3 minutes for the post-trade reflection. The weekly review takes 30-60 minutes. Total weekly time for a trader taking 3-5 trades per day: roughly 3 hours. This time investment has the highest return of any activity in trading, measured in avoided mistakes and accelerated learning.
Continue Reading
▶ Building a Trading Journal That Improves Performance
▶ How to Review Your Trades: The Advanced Process
Go Deeper
The full Mind · Method · Money framework that this journal system is built on, in 70 chapters: The Complete Trader’s Edge.
 The Complete Trader's Edge
The full Mind · Method · Money framework. 70 chapters.
View on Amazon →
The Complete Trader's Edge
The full Mind · Method · Money framework. 70 chapters.
View on Amazon →
 Market Mayhem
400 years of bubbles, crashes, and the pattern that keeps repeating.
Buy on Amazon →
Market Mayhem
400 years of bubbles, crashes, and the pattern that keeps repeating.
Buy on Amazon →
 Greatest Companies
How the world's greatest companies were built — and what traders learn from them.
View on Amazon →
Greatest Companies
How the world's greatest companies were built — and what traders learn from them.
View on Amazon →