Gold is where ICT concepts perform at their most precise. The institutional participation in XAU/USD is enormous, the session structure is consistent, and the liquidity engineering that ICT methodology describes plays out on gold charts with textbook clarity. If you can trade ICT on gold profitably, you can trade it on anything.
This guide is not a general introduction to either ICT or gold. It assumes you already understand order blocks, fair value gaps, liquidity, and kill zones. What it covers is the specific application of these concepts to gold: which setups work best, which timeframes to use, how the session structure shapes ICT patterns on XAU/USD, and the precise trade models that produce consistent results.
KEY TAKEAWAYS
▸ Gold’s clean session structure makes it the single best instrument for ICT concepts. The London Judas Swing alone sets up 3–4 times a week.
Kill zones and liquidity sweeps both come out of the framework built by Michael J. Huddleston, the Inner Circle Trader. His time-based work is the part of ICT with the least precedent in earlier trading literature, which is worth knowing before you trade a session window on gold.
▸ Trade the AMD cycle: mark the Asian range, wait for London to sweep it, then enter on the displacement FVG or order block.
▸ The 15-minute chart is the sweet spot. Use the 1H for structure, the 5M only for tighter entries.
▸ Place stops beyond the sweep, not at the swing. Gold over-extends 20–50 pips before reversing.
▸ Risk 1% (0.5% on funded accounts) and target a minimum of 1:2 R:R. Gold’s larger ranges do the rest.
On this page
Why gold is the best instrument for ICT
The gold ICT session map (AMD)
The five best ICT setups on gold
Worked example: a London Judas Swing
Gold-specific ICT risk management
Why Gold Is the Best Instrument for ICT Trading
Gold has several characteristics that make it ideal for the ICT framework.
| ICT Requirement | Gold’s Characteristic | Why It Matters |
|---|---|---|
| Clear market structure | Gold trends persistently with clean HH/HL or LH/LL | Structural breaks are decisive, not ambiguous |
| Liquidity at obvious levels | Round numbers ($4,000, $4,100), session highs/lows | Stop hunts and sweeps are predictable |
| FVGs that fill reliably | Gold fills FVGs with high probability before continuing | Re-entry after displacement is consistently tradeable |
| Session-based volatility | Distinct Asian consolidation → London expansion | Kill Zone entries are time-filtered and high probability |
| Judas Swing pattern | London open consistently sweeps the Asian range first | The false opening move is the single best setup on gold |
| Strong displacement candles | Gold’s volatility produces large, clear displacement | Order blocks and FVGs are unambiguous, not borderline |
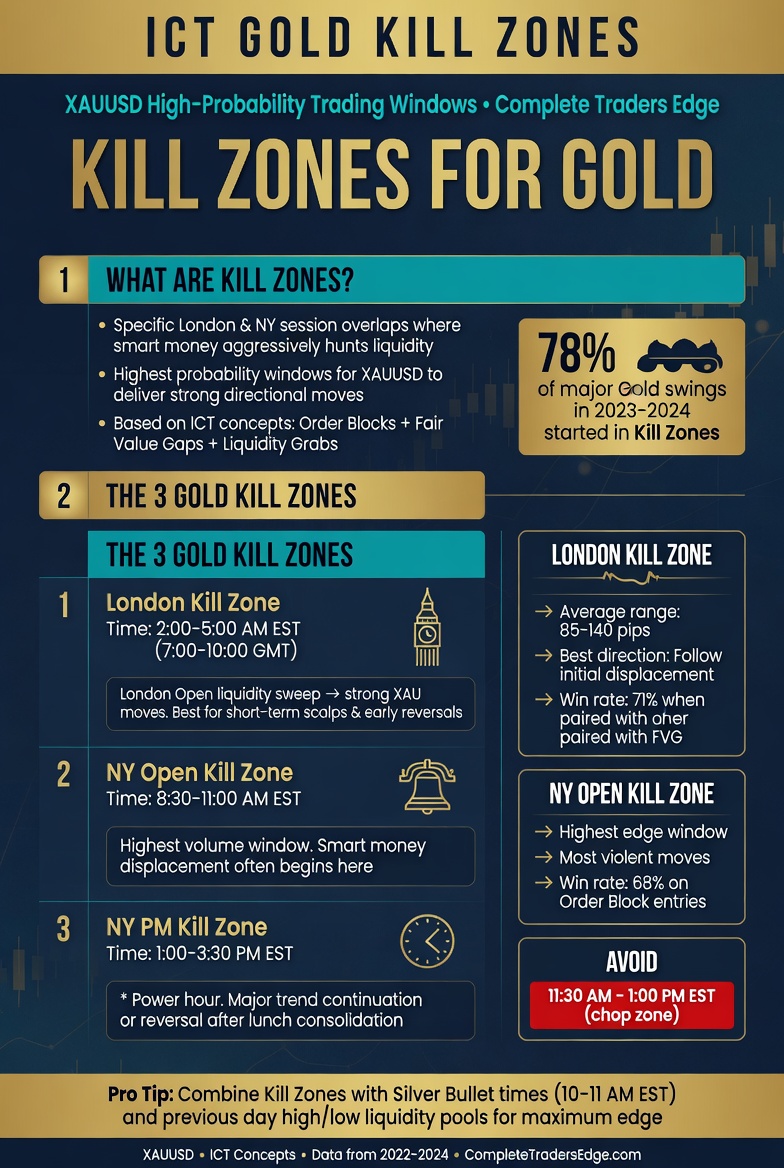
The Gold ICT Session Map
Every gold trading day follows a predictable session sequence. Understanding this sequence is the foundation of ICT trading on gold.
| Phase | Time (ET) | ICT Function | Your Action |
|---|---|---|---|
| Accumulation | 7:00 PM – 2:00 AM | Asian range forms; liquidity builds above and below | Mark the Asian high and low. Do not trade. |
| Manipulation | 2:00 AM – 3:30 AM | Judas Swing: London sweeps one side of the Asian range | Wait for the sweep. Identify the trapped side. |
| Distribution | 3:30 AM – 10:00 AM | True daily direction unfolds; OBs and FVGs form | Enter on pullbacks to FVGs/OBs. Run your trades. |
| Reversal/Fade | 10:00 AM – 12:00 PM | London Close; European institutions close books | Take profits. Tighten stops. Reduce exposure. |
This is the ICT Power of 3 (AMD: Accumulation, Manipulation, Distribution) applied specifically to gold’s session structure. It happens every single day with enough consistency that you can build an entire trading career around it.
The Five Best ICT Setups on Gold
1. The London Open Judas Swing
This is the highest-probability ICT setup on gold, period. The sequence is as follows. Asian session forms a 150-300 pip range. London opens and price immediately moves to sweep either the Asian high or the Asian low. The sweep takes out retail stop losses clustered at those levels. A displacement candle forms in the opposite direction. You enter on the pullback to the FVG or OB left by the displacement. Stop goes beyond the sweep. First target: opposite side of the Asian range. Extended target: previous day’s high or low.
This setup typically offers 1:2 to 1:4 R:R and appears 3-4 times per week on gold. The win rate is higher when the sweep direction aligns with the daily or 4-hour bias (sweeping the Asian low in an uptrend, sweeping the Asian high in a downtrend).
2. The FVG Pullback Entry
During the distribution phase (after the Judas Swing has played out), gold tends to make impulsive moves that leave fair value gaps on the 15-minute chart. When these gaps form in the direction of the daily bias, the pullback to fill the gap before continuation is one of the most reliable entries on gold.
The rules: wait for a clear displacement move during London or early New York. Identify the FVG on the 15-minute chart. Set a limit order at the 50% level of the FVG (the midpoint between the gap’s high and low). Stop below the FVG for longs, above for shorts. Target the next structural level or the 1.618 Fibonacci extension.
3. The Order Block Rejection
When gold pulls back to a 1-hour order block during a trending day, the rejection from that OB is a high-probability continuation entry. The order block must be the last opposing candle before a clear displacement move. The rejection should show as a wick into the OB followed by a strong close away from it on the 15-minute chart.
For this setup, the OB works best when it is inside the golden pocket (0.618-0.702 Fibonacci retracement) and when the Volume Profile shows a low-volume node at the same price level. Triple confluence (OB + Golden Pocket + LVN) produces the tightest stops and the cleanest entries.
4. The New York Continuation
When London establishes a clear directional move and New York opens with the same bias, the first pullback during the New York Kill Zone (7:00-10:00 AM ET) is a continuation entry. Look for an FVG or OB on the 5-minute chart that forms during the first 30 minutes of New York. Enter on the pullback. This setup is particularly powerful on days with scheduled US economic data that reinforces the London direction.
5. The Equal Highs/Lows Sweep
Gold frequently builds equal highs or equal lows during the Asian session or during multi-day consolidations. These equal levels are obvious liquidity targets. When price sweeps above equal highs (collecting buy stop liquidity) and immediately reverses, or sweeps below equal lows (collecting sell stop liquidity) and reverses, the entry is the same as any other liquidity sweep: enter on the displacement FVG or OB pullback.
On gold, equal-level sweeps at round numbers ($4,000, $4,100, $4,200) are especially powerful because round numbers concentrate both retail stop losses and option barrier activity.
Worked Example: A London Judas Swing on Gold
Numbers make this concrete. The walkthrough below is illustrative, a representative sequence rather than a specific dated trade, but every value reflects how gold behaves at current price levels near $4,100.
Setup. The daily bias is bullish (higher highs, higher lows) and the DXY is soft into the session. Overnight, the Asian range forms between $4,088 (low) and $4,104 (high), a 160-pip box. You mark both edges and stand aside.
The sweep. London opens at 2:00 AM ET. Within the first 40 minutes price drives down to $4,083, taking out the Asian low and the retail stops parked beneath it, then snaps back above $4,088. That is your Judas Swing: the trapped side is the sellers who were filled on the false break.
The entry. A displacement candle closes hard back inside the range and leaves a 15-minute fair value gap between $4,090 and $4,094. You set a limit at the 50% level, $4,092, and it fills on the pullback.
The trade. Stop goes below the sweep at $4,081, an 11-dollar (110-pip) stop that accounts for gold’s over-extension. First target is the opposite side of the Asian range at $4,104 (roughly 1:1), where you take 50% and move to breakeven. The remainder runs to the previous day’s high at $4,126, a 1:3 on the back half.
The maths. On a $10,000 account risking 1%, the 110-pip stop sizes the position at roughly 0.09 lots. The blended result across both targets is about +2.0R, a 2% gain on the account from a single clean setup. Miss the entry and you simply wait for the next one; on gold, another qualifying sweep is rarely more than a day or two away.
Gold-Specific ICT Risk Management
| Parameter | Gold (XAU/USD) | EUR/USD (for comparison) |
|---|---|---|
| Typical intraday stop | 50-150 pips | 15-30 pips |
| Risk per trade | 1% maximum | 1% maximum |
| Position size (on $10K, 1%, 100-pip stop) | 0.10 lots | 0.50 lots (on 20-pip stop) |
| Typical intraday target | 200-400 pips (1:2 to 1:3) | 40-80 pips (1:2 to 1:3) |
| News impact | 300-500+ pip moves on NFP/CPI/FOMC | 80-150 pip moves |
| Spread during London/NY | 10-25 pips (broker-dependent) | 0.1-1.0 pips |
The critical adjustment for ICT trading on gold is stop placement beyond the liquidity sweep, not at the swing high or low. Because gold’s volatility is higher, the sweep often extends 20-50 pips beyond the level before reversing. Your stop must account for this over-extension, which means wider stops and proportionally smaller positions. The R:R compensates because gold’s distribution moves are proportionally larger as well. Rather than eyeball the lot size, run each trade through the position size and risk calculators so the 1% is exact every time.
Common Mistakes to Avoid When Trading ICT on Gold
Most traders who struggle with ICT on gold are not wrong about the concepts. They are wrong about the execution details that gold specifically punishes.
Trading before the sweep. The most expensive mistake is entering during the accumulation phase because a level “looks ready.” Gold’s whole edge is the manipulation leg. If you have not seen liquidity taken, you do not have a trade. You have a guess.
Stops at the swing instead of beyond the sweep. Gold routinely wicks 20–50 pips past the level it is reversing from. A stop at the swing high or low gets clipped on the very move that confirms your idea. Place it beyond the sweep and size down to keep the risk at 1%.
Ignoring the DXY and the daily bias. Counter-trend sweeps fail far more often than sweeps aligned with structure. If the daily is bullish and the DXY is falling, you want to be buying the sweep of the Asian low, not shorting the sweep of the high.
Over-trading outside the Kill Zones. The London and New York windows exist because that is when institutional flow is present. Setups that appear late in the New York afternoon or during the Asian session carry a materially lower win rate. Discipline about time is as important as discipline about price.
The Complete ICT Gold Trade Checklist
| # | Step | Detail |
|---|---|---|
| 1 | Check daily bias | Daily chart market structure: bullish (HH/HL) or bearish (LH/LL)? |
| 2 | Check DXY | DXY weak = gold bullish lean. DXY strong = gold bearish lean. |
| 3 | Mark Asian range | Asian high and low on the 15M chart. |
| 4 | Mark key levels | Previous day H/L, round numbers, untested OBs and FVGs from 4H/1H. |
| 5 | Wait for Kill Zone | London (2:00-5:00 AM) or NY (7:00-10:00 AM). No trades outside. |
| 6 | Wait for sweep | Asian high/low swept, or equal highs/lows taken. |
| 7 | Confirm displacement | Strong candle(s) moving away from the sweep = institutional commitment. |
| 8 | Enter on FVG/OB | Pullback to the 15M FVG or OB left by the displacement. |
| 9 | Set stop | Beyond the sweep point (not the OB edge). Account for gold’s wick volatility. |
| 10 | Size position to 1% | Calculate from stop distance. No exceptions. |
| 11 | Manage with partials | Take 50% at 1:2 R:R. Move stop to breakeven. Let remainder run to 1:3+. |
Frequently Asked Questions About ICT Trading on Gold
Which ICT timeframe works best on gold?
The 15-minute chart is the best balance between signal clarity and noise on gold. Use the 1-hour chart to identify your order blocks and FVGs for structure, and the 15-minute for entry timing. The 5-minute is viable for experienced traders who want tighter entries but produces more false signals due to gold’s inherent volatility.
How often does the Judas Swing work on gold?
The London open Judas Swing appears in a recognisable form 3-4 times per week on gold. Not every instance produces a clean entry; sometimes the sweep is weak, or the displacement does not create a clear FVG. Approximately 2-3 of those weekly occurrences produce setups that meet full criteria. That is enough for a full-time gold trading career if executed consistently.
Can I trade ICT on gold during the New York session only?
Yes, but you miss the highest-probability window. The London Kill Zone produces the cleanest Judas Swing setups. The New York Kill Zone produces continuation setups and news-driven setups. If you can only trade one session, London is the better choice. If you can trade both, London for initial entries and New York for additions or second setups is the ideal workflow.
What R:R should I target on gold ICT setups?
Minimum 1:2. The average well-executed gold ICT setup produces 1:2 to 1:3. On trending days where the London and New York sessions align in the same direction, 1:4 and 1:5 targets are achievable by letting the second half of your position run. Never target less than 1:2 on gold; the spread and volatility make lower ratios unprofitable over a large sample.
Is ICT on gold viable for prop firm trading?
Extremely viable. Gold’s large ranges allow you to hit profit targets faster than on forex pairs. The key adjustment is reducing your risk per trade to 0.5% instead of 1% on funded accounts to give yourself more room for drawdown. With 0.5% risk and 1:2 R:R targets, you can build consistent returns while staying well within the 4-5% daily drawdown limits that most prop firms impose. Model the exact stop, lot size, and drawdown headroom for your account with the prop firm risk calculator.
▶ Continue Reading
▸ The ICT Power of 3: Accumulation, Manipulation, Distribution
▸ Fair Value Gaps (FVG): The Complete ICT Guide to Trading Imbalances
▸ The Stop-Hunt Explained: How Smart Money Engineers Liquidity Sweeps
The Complete Trader’s Edge
This article is adapted from The Complete Trader’s Edge by Louw van Riet. The book covers ICT methodology, gold trading, kill zones, and the complete Mind · Method · Money framework across 70 chapters.
Kill zones and liquidity sweeps are a modern vocabulary for older ideas. These two cover the foundations underneath them:
- Japanese Candlestick Charting Techniques — the reversal signatures that show up at the end of a sweep, decades before SMC named them.
- Trading in the Zone — because knowing the session times is not the part that costs most traders money.
 The Complete Trader's Edge
The full Mind · Method · Money framework. 70 chapters.
View on Amazon →
The Complete Trader's Edge
The full Mind · Method · Money framework. 70 chapters.
View on Amazon →
 Market Mayhem
400 years of bubbles, crashes, and the pattern that keeps repeating.
Buy on Amazon →
Market Mayhem
400 years of bubbles, crashes, and the pattern that keeps repeating.
Buy on Amazon →
 Greatest Companies
How the world's greatest companies were built — and what traders learn from them.
View on Amazon →
Greatest Companies
How the world's greatest companies were built — and what traders learn from them.
View on Amazon →