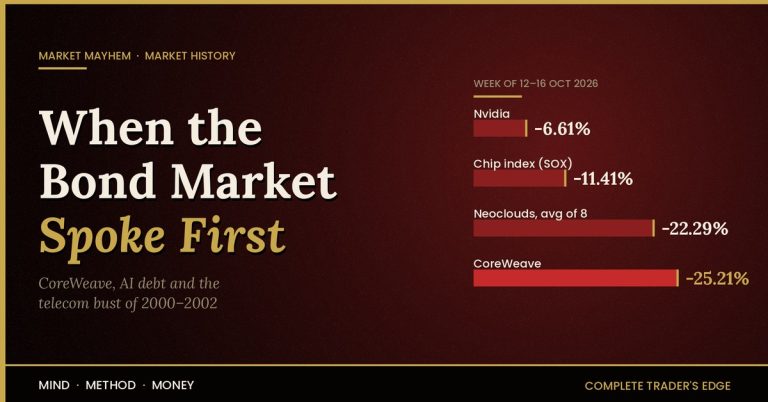


In one week, US crude closed above $100, consumer staples had their best week since February, and technology had its worst since April 2025. The November WTI contract rose 10.41% to settle at $101.41 on Friday 16 October 2026, after Iran stepped up attacks on tankers in the Strait of Hormuz and US inflation came in hotter than expected. Money left AI and chips and went into Coca-Cola, Walmart, Procter & Gamble and health care (Portfolio Terminal, whose weekly figures this piece uses throughout; Morningstar’s weekly update has WTI at $101.75 and technology at −6.49%, a difference of contract and timing).
The timing is hard to ignore. Fifty-three years ago this week, on 17 October 1973, the Arab members of OPEC announced production cuts, and two days later imposed an oil embargo on the United States. The market they hit was one that had spent three years crowding into a small group of large, expensive, “can’t-lose” growth stocks known as the Nifty Fifty. What followed was the worst bear market between 1929 and 2008, and the Nifty Fifty fell hardest of all.
This is not a piece about oil. CTE’s History of Oil covers the commodity from Drake’s well to Hormuz, and Gold Miners vs Oil Just Hit a 1970s Extreme covers the ratio. This is about what an oil shock did to a concentrated stock market, and what a trader can take from it.
The one-line version.
An oil shock is an inflation shock and a growth shock at the same time, which ties the central bank’s hands. A market that leans on a handful of expensive giants has no cushion when that happens. 1973 proved both. 2026 is testing both.
What happened in the week of 12 to 16 October 2026
Oil. WTI rose 10.41% on the week to $101.41 and Brent 4.91% to $109.86. On Thursday the Energy Information Administration reported that US commercial crude stocks fell 8.557 million barrels in the week to 9 October. CNBC reported on Friday that attacks around the Strait of Hormuz had surged over the prior ten days, with Iran saying it was stepping up strikes in response to the US blockade of its ports and tougher sanctions; analysts at Kpler said the attacks had driven Gulf crude flows sharply lower (CNBC). CNN had reported on 8 October that a record ten tankers were struck in the strait in a single week, against a previous high of six (CNN). The IEA agreed on 15 October to release more than 20 million barrels of diesel.
Inflation. The Bureau of Labor Statistics reported on 14 October that consumer prices rose 3.7% in the 12 months to September, with core CPI at 2.6%, both a tenth above expectations. Producer prices for final demand rose 6.3% on the year (BLS). By Friday, futures were pricing an 89% chance of a Federal Reserve rate hike by December, according to the CME FedWatch tool as reported by Investopedia. The Fed meets on 27 and 28 October.
Stocks. The S&P 500 fell 1.95% to 7,659.44 and the Nasdaq 4.48%, while the Dow rose 0.67%. The sector split was the story: consumer staples (XLP) +5.02%, energy (XLE) +4.86%, health care (XLV) +3.45%, technology (XLK) −7.70%. Coca-Cola rose 6.64%, Walmart 6.70% and Procter & Gamble 5.37%. Only four of eleven sectors fell, yet the index fell, because its largest sector was the one that fell most.
That last point is the one to hold on to. When leadership is concentrated, the index is only as safe as its leaders.
October 1973: the embargo
The Arab-Israeli War began on 6 October 1973. On 17 October the Arab members of OPEC announced production cuts, and on 19 October, immediately after President Nixon asked Congress for $2.2 billion in emergency aid to Israel, they imposed an embargo on oil exports to the United States (Federal Reserve History). The embargo was later extended to the Netherlands, Portugal and South Africa, a detail worth noting for CTE’s South African readers, who live in one of the few countries outside the original target list that was singled out (US Office of the Historian).
The price of oil went from $2.90 a barrel before the embargo to $11.65 in January 1974, nearly a fourfold rise. The embargo itself was lifted in March 1974. The higher prices stayed.
Supply could not respond because American production had already peaked and the country had become a net importer; there was no spare domestic capacity to switch on. The Fed, meanwhile, was already fighting inflation. Chair Arthur Burns said in 1974 that the shock came at “a most inopportune time”, with wholesale prices of industrial commodities already rising at more than 10% a year. Thirty years later, Ben Bernanke summed up the central bank’s problem in one sentence: monetary policy cannot offset the recessionary and inflationary effects of higher oil prices at the same time. Tighten to fight inflation and you deepen the recession. Ease to fight the recession and you feed the inflation. The Fed in 1973 and 1974 did some of each, and got stagflation.
The Nifty Fifty: priced for perfection
The stock market that met the embargo had a particular shape. After the speculative excesses of the late 1960s, institutional investors had retreated into a group of large, high-quality growth companies that were supposed to be safe at any price: IBM, Xerox, Polaroid, Avon, McDonald’s, Disney, Coca-Cola, Johnson & Johnson and a few dozen others. They were called “one-decision” stocks. You decided to buy, and you never had to decide to sell.
Because everyone agreed they were safe, they became expensive. Jeremy Siegel’s research on the group found that at the end of 1972 the Nifty Fifty traded at an average of 42 times earnings, against 19 for the S&P 500, and more than a fifth of them above 50 times. Polaroid was at 94.8 times earnings and Xerox at 45.8 (Siegel, Revisiting the Nifty Fifty, 1998, as summarised by A Wealth of Common Sense).
Nobody thought that was a problem. These were the best businesses in the world. The question of what you paid for them had quietly been removed from the conversation.
Interactive
The price of perfection: what a Nifty Fifty multiple does to your return
First, where the money went in the week of 12 to 16 October 2026. Then a calculator: pick the multiple you pay, the growth you get, and the multiple the market gives you back. The business can be excellent and the maths still loses.
Sector moves, week of 12–16 October 2026
Price of perfection calculator
Earnings grew
—
Over the holding period, from the growth rate you entered.
Share price change
—
Annualised return
—
Price only, before dividends.
Price = earnings × multiple, so price change = (1 + growth)years × (exit P/E ÷ entry P/E) − 1. The 1972 multiples are from Jeremy Siegel's Nifty Fifty research (Polaroid 94.8, Xerox 45.8, group average 42, S&P 500 19). The growth rates in the presets are illustrative inputs for you to change, not the companies' actual records. Educational only, not investment advice.
The 1973 to 1974 bear market
The S&P 500 peaked at 120.24 on 11 January 1973 and bottomed at 62.28 on 3 October 1974: a fall of 48.2% over 630 days (Yardeni Research). It was the deepest bear market since the Depression, and it would not be matched until 2008.
The Nifty Fifty held up at first. That was the whole point of them. As the market started falling in early 1973, the one-decision stocks were the last thing institutions wanted to sell. Then the embargo arrived, inflation moved into double digits, interest rates rose, and the earnings growth that justified a 42 times multiple stopped showing up. When the selling came, it came for the most expensive names hardest. Polaroid fell more than 90% from its peak. Avon fell more than 85%. Reuters Breakingviews, looking back in 2024, described a rally led by a small group of large, high-quality companies that then suffered a more severe collapse than the market itself (Reuters).
Here is the part that gets lost. Most of the Nifty Fifty were good businesses, and Siegel’s research found that a buy-and-hold investor who bought the whole group at the 1972 peak and never sold did eventually match the market, decades later. The businesses were fine. The price was the problem, and the price took twenty years to be forgiven. For a trader, twenty years is not a holding period. It is a career.
Then and now
| 1973–1974 | October 2026 (unresolved) | |
|---|---|---|
| Oil shock | Embargo on the US from 19 Oct 1973; price nearly quadrupled, $2.90 to $11.65, in three months | Hormuz tanker attacks; WTI +10.41% in one week to $101.41 on 16 Oct 2026 |
| Inflation | Already above 10% a year in industrial commodities before the shock; headline CPI moved into double digits in 1974 | CPI 3.7%, core 2.6%, producer prices 6.3% (September 2026) |
| Central bank | Fed caught between recession and inflation; stagflation | Fed meets 27–28 Oct; futures price an 89% chance of a hike by December |
| Market leadership | Nifty Fifty one-decision growth stocks at 42x earnings on average | Technology and AI; XLK fell 7.70% in the week while staples rose 5.02% |
| Outcome | S&P 500 −48.2% over 630 days; Polaroid −90%+, Avon −85%+ | Not yet known |
Where the comparison breaks down
It would be lazy to stop at the parallels. Three differences matter, and none of them needs an invented number.
The United States is now a major oil producer. In 1973 it was a net importer with no spare capacity. Today the US produces more crude than any other country, which changes the economics of an embargo. A Hormuz disruption still raises the world price, and the US pays that price, but it does not face the physical shortage of 1973. Petrol queues are not the risk. The price is.
The economy uses less oil per unit of output. Services, efficiency and the shift away from oil-fired electricity mean a doubling of the oil price does not feed through to inflation the way it did in the 1970s. It still feeds through. It feeds through less.
The Fed is a different institution. In 1973 the Fed had no inflation target, no public statement after meetings, and a chair under political pressure from the White House. Today it has all three of the opposite. Whether that produces a better outcome is not settled, but the comparison is not like for like.
And one way the comparison is stronger than it looks. The Nifty Fifty were about 50 stocks. Today’s market leadership is narrower than that. When a handful of companies make up a very large share of the index, a sector rotation out of them does more damage to an index fund than the 1973 rotation did, not less.
Five lessons for traders
1. An oil shock ties the central bank’s hands
Bernanke’s sentence is the whole lesson. When oil spikes, inflation rises and growth falls together, and the central bank cannot fix both. That means rate expectations become unstable, which means every asset priced off the discount rate becomes unstable. Trade the uncertainty, not a forecast of which way the Fed will jump. (Method.)
2. One-decision stocks are still priced, and price matters
The Nifty Fifty were excellent businesses bought at a multiple that assumed they would stay excellent forever. They mostly did. Buyers still lost 85% to 90% because the price had no margin for a bad decade. There is no quality of business that makes the entry price irrelevant. The Buffett version is that a wonderful company at a terrible price is a terrible investment. (Mind.)
3. Concentration is a position, whether you chose it or not
An index fund with a very large weight in one sector is not diversified. It is a sector bet with a diversified-sounding name. The week of 12 to 16 October 2026 showed this exactly: seven sectors rose, the index fell, because technology is the index. Know what you actually own. The intermarket analysis guide covers how to read these rotations before they finish. (Method.)
4. Defensives earn their keep in exactly these weeks
Staples, health care and energy are boring for years at a time. That is what they are for. Coca-Cola and Walmart rose more than 6% in a week when the Nasdaq fell 4.48%. Diversification is a cost in bull markets and an asset in weeks like this one; you cannot buy it after the fact. (Money.)
5. Do not trade the headline
Oil spikes are fast and two-way. A ceasefire headline, a strategic reserve release or a tanker making it through can take 5% off the price in an hour, and the next attack can put it back. If you trade energy or anything priced off it, size the position for the volatility you are seeing, not the volatility you are used to. The same discipline that governs the 1994 bond massacre governs here: the first move hurts everyone a little, the second move finds whoever cannot wait. (Money.)
The 1973 rule of thumb. The market does not punish good businesses. It punishes good businesses bought at prices that assumed nothing could go wrong, in the year something does.
For the longer history of how the oil business itself was built, broken up and rebuilt, read Standard Oil: The Empire That Grew Richer the Day It Died, and for the trader who made and lost fortunes on exactly these swings, T. Boone Pickens. Every chapter of Market Mayhem is a variation on the same pattern.
Frequently asked questions
What caused the 1973 oil crisis?
Arab members of OPEC announced production cuts on 17 October 1973 and, on 19 October, an embargo on oil exports to the United States in response to US support for Israel during the Arab-Israeli War. Oil went from $2.90 a barrel to $11.65 by January 1974. The embargo was lifted in March 1974, but prices never returned to their old level.
What were the Nifty Fifty stocks?
A group of roughly fifty large, high-quality US growth companies that institutional investors treated as safe to buy at any price in the early 1970s, including IBM, Xerox, Polaroid, Avon, McDonald’s, Disney and Coca-Cola. By the end of 1972 they traded at an average of about 42 times earnings. Most fell far more than the market in 1973 and 1974.
How much did stocks fall in 1973 to 1974?
The S&P 500 fell 48.2%, from 120.24 on 11 January 1973 to 62.28 on 3 October 1974, over 630 days. The most expensive Nifty Fifty stocks fell much further: Polaroid lost more than 90% and Avon more than 85% from their peaks.
Does $100 oil mean a stock market crash is coming?
Nobody knows, and anyone who says they do is guessing. History shows that oil shocks raise inflation and slow growth at the same time, which makes central bank policy and asset prices unstable. It does not show that every oil spike produces a bear market, and the US economy is far less exposed to oil than it was in 1973. The lesson is about managing risk, not predicting the outcome.
Which sectors tend to hold up during an oil shock?
In the week of 12 to 16 October 2026, consumer staples, energy and health care rose while technology fell. The general principle is that companies whose demand does not depend on the economic cycle, and companies that benefit directly from a higher oil price, tend to hold up better than long-duration growth stocks when rates and inflation rise. That is a tendency, not a rule, and it varies by shock.
Volatility is the price of being in the market this week.
Size for it before it sizes you, with the position size and drawdown calculators.
This article is educational and is not investment advice. 2026 market data as at 16 October 2026 from the sources linked; weekly index, sector and oil figures from Portfolio Terminal’s week in review of 17 October 2026. 1973 figures from Federal Reserve History, the US Office of the Historian, Yardeni Research and Jeremy Siegel’s Nifty Fifty research as linked.
 The Complete Trader's Edge
The full Mind · Method · Money framework. 70 chapters.
View on Amazon →
 Market Mayhem
400 years of bubbles, crashes, and the pattern that keeps repeating.
Buy on Amazon →
 Greatest Companies
How the world's greatest companies were built — and what traders learn from them.
View on Amazon →
 Greatest Traders
Eighty-six lives that explain the markets — Livermore to Madoff, told with the losses left in.
View on Amazon →