The Inner Circle Trader (ICT) methodology, developed by Michael J. Huddleston, has become one of the most widely studied technical frameworks in retail trading. At its core, it is a framework for understanding how institutional and smart money participants move markets, and specifically how they source the liquidity they need to build and exit large positions.
Understanding liquidity transforms how you read every chart. Price does not move randomly. It moves toward liquidity. Highs get taken out, lows get swept, and then the real move begins. Once you see this pattern, you cannot unsee it. This article explains the mechanics of liquidity, where it pools, how institutions target it, and how you can use this knowledge to stop being the target and start trading alongside the smart money.
What Is Liquidity?
In financial markets, liquidity is the availability of willing buyers and sellers at a given price. For retail traders, liquidity is invisible. You click buy, your order fills instantly, and you move on. But for institutional traders managing positions of $10 million, $100 million, or more, liquidity is the primary constraint.
A hedge fund that wants to buy $50 million of Gold cannot simply place a market order. There are not enough sellers at the current price to absorb that size without moving the market dramatically against them. They need to find concentrations of sell orders to buy against. And where do sell orders concentrate? At the exact levels where retail traders place their stop losses.
This is the fundamental insight of ICT: retail stop losses are institutional entry liquidity. When your long position gets stopped out, you are selling. The institution buying your shares is using your stop loss as their entry.
Where Liquidity Pools Form
Retail traders predictably cluster their stop losses and pending orders at specific locations. These clusters are what the ICT framework calls liquidity pools.
| Liquidity Location | Why Orders Cluster Here | What Institutions Do |
|---|---|---|
| Above swing highs | Short sellers place stops above recent highs; breakout traders place buy entries here | Drive price above the high to trigger these orders, then reverse down |
| Below swing lows | Long traders place stops below recent lows; breakdown traders place sell entries here | Drive price below the low to trigger stops, then reverse up |
| Equal highs / equal lows | Double tops/bottoms create obvious “resistance/support” where stops and entries stack | Sweep the equal level to harvest the concentrated liquidity, then move aggressively |
| Round numbers | Psychological levels ($2,000, $100, 1.1000) attract stops, limits, and take profits | Run price through the round number to trigger clustered orders before reversing |
The Liquidity Hunt: How Smart Money Engineers the Move
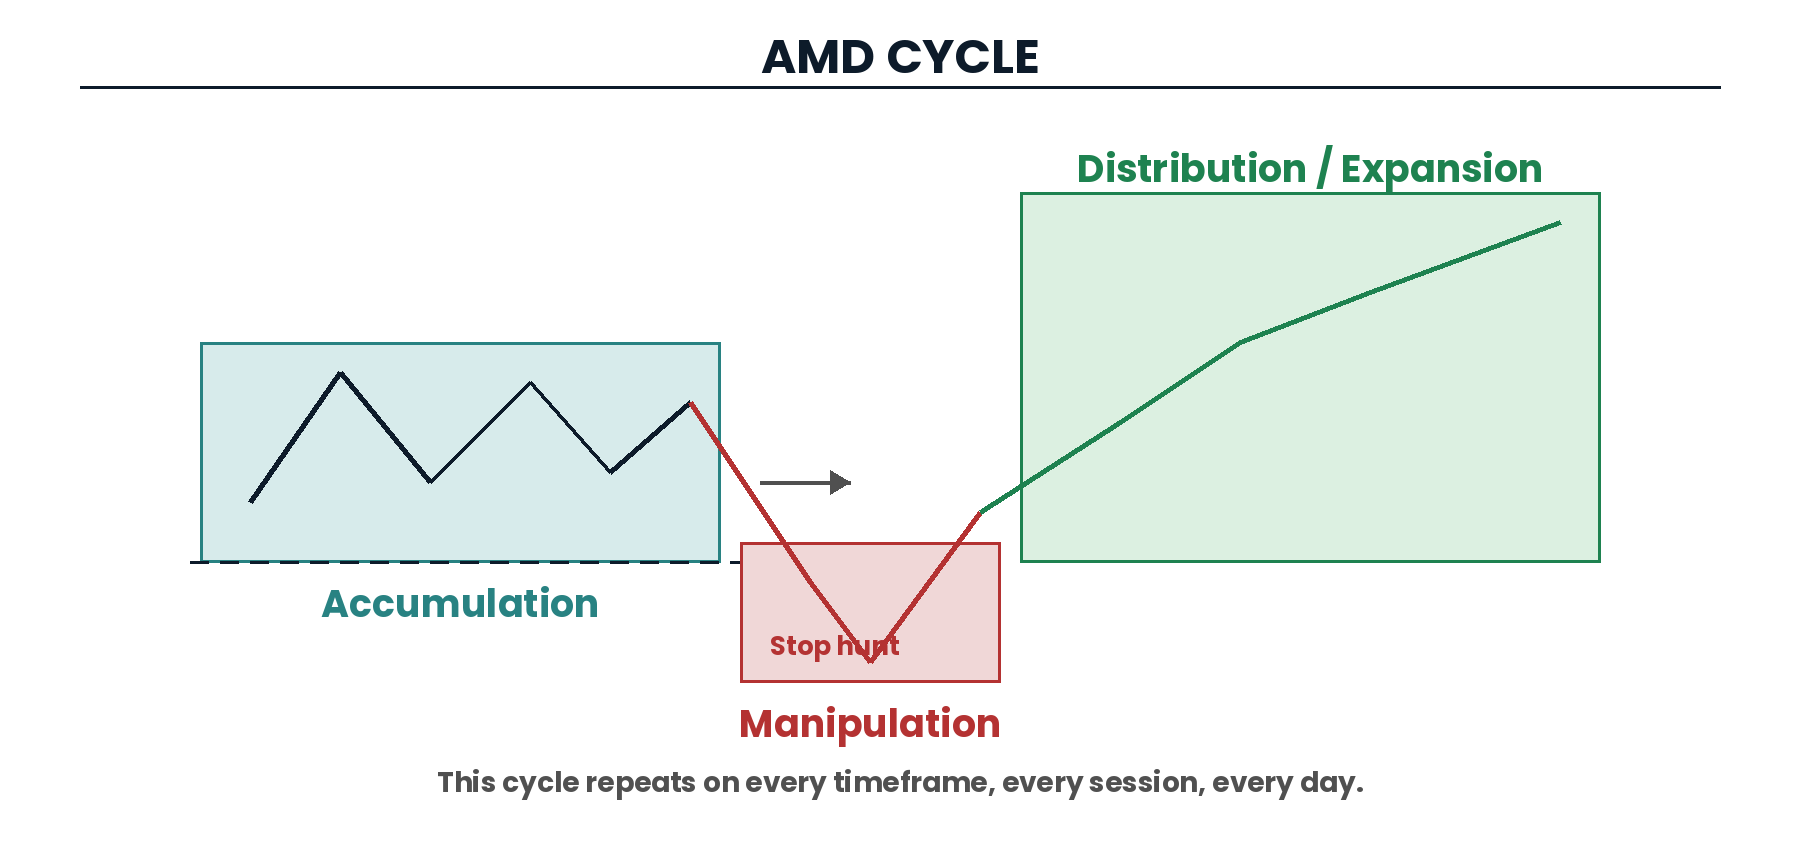
Before making a significant directional move, institutional order flow often pushes price briefly beyond obvious liquidity levels to trigger clustered orders, harvesting liquidity, before reversing in the actual intended direction. This is the Accumulation, Manipulation, Distribution (AMD) cycle.
Here is how it plays out in real time on Gold during the New York Kill Zone:
Accumulation phase. During the Asian session, price consolidates in a tight range between $2,340 and $2,348. Retail traders see the range and place buy stops above $2,348 and sell stops below $2,340. Liquidity builds on both sides.
Manipulation phase. At the London open, price drops sharply below $2,340, triggering all the buy-side stops. Retail longs are stopped out (they sell). Breakdown traders enter short (they sell). All this selling provides liquidity for institutions to buy at lower prices. The wick below $2,340 is the manipulation.
Distribution phase. Having filled their buy orders against the selling liquidity, institutions allow price to move in their intended direction. Price reverses aggressively from below $2,340 and rallies to $2,365 by the New York session. The move that looked like a breakdown was actually a stop hunt that set up the real move.
How to Trade Liquidity Sweeps
Once you understand where liquidity sits and how it gets targeted, you can position yourself on the right side of the move.
Step 1: Mark the liquidity. Before each session, identify the obvious liquidity levels: previous session highs and lows, equal highs and equal lows, and the most recent significant swing points. These are the levels institutions are likely targeting.
Step 2: Wait for the sweep. Do not enter at the liquidity level. Wait for price to push beyond it, triggering the stops. The sweep is identifiable by a sharp wick beyond the level that quickly reverses. A candle that breaks below a swing low but closes back above it is a classic sweep signal.
Step 3: Enter after the reversal confirms. After the sweep, look for a Change of Character on your entry timeframe (15-minute or 1-hour): a structural shift that confirms the sweep is complete and the real move is beginning. Enter in the direction of the reversal with a stop beyond the sweep low (for a bullish setup).
Step 4: Target the opposite liquidity. If institutions swept the sell-side liquidity (below swing lows) to fill longs, their likely target is the buy-side liquidity (above swing highs on the other side of the range). This gives you a clear, logical target and typically produces excellent risk-to-reward ratios.
Liquidity and the ICT Framework
Liquidity is the thread that connects every ICT concept. Order Blocks are the zones where institutions placed their orders after harvesting liquidity. Fair Value Gaps are created by the impulsive displacement that follows liquidity harvesting. Kill Zones are the time windows when institutional liquidity operations are most active. Market structure shifts are caused by institutions completing their liquidity cycle and initiating the next phase of price delivery.
Without understanding liquidity, these concepts are isolated tools. With it, they form a coherent model of how and why price moves the way it does.
Key Lessons
- Institutional traders need liquidity to fill large orders. They target where retail stops and pending orders cluster.
- Liquidity pools sit above swing highs, below swing lows, at equal highs/lows, and at round numbers.
- The liquidity hunt (stop hunt) briefly pushes beyond obvious levels before reversing. This is institutional order filling, not random noise.
- Trade the reversal after the sweep, not at the obvious level. Wait for confirmation before entering.
- Target the opposite liquidity pool for your take profit. Institutions sweep one side to fuel the move to the other.
Frequently Asked Questions
Is every stop loss hit a liquidity hunt?
No. Sometimes stops are hit because the trade thesis was genuinely wrong and price continues in the stop direction. The distinction is what happens after the stop is triggered. A liquidity sweep takes stops and then reverses aggressively, often within minutes. A genuine trend continuation takes stops and keeps going with follow-through momentum. The candle close is your primary diagnostic: a wick through the level with a close back inside suggests a sweep. A body close through the level suggests genuine structural change.
How do I stop getting swept before the real move?
Two approaches. First, place your stop loss beyond the obvious level where stops cluster. If everyone’s stop is at $2,340, place yours at $2,335. The extra 5 pips costs slightly more risk per trade but significantly reduces the chance of being swept. Second, wait for the sweep to happen before entering. Instead of buying at support and hoping it holds, wait for the sweep below support and enter on the reversal candle. This way, the liquidity hunt works for you instead of against you.
Can I see liquidity on my chart?
Not directly. Liquidity (resting orders) is invisible. What you can see is where liquidity is likely to be based on obvious price structure. Equal highs scream “stops above here.” Equal lows scream “stops below here.” Previous day/week highs and lows are well-known liquidity targets. With practice, marking these levels becomes second nature, and you begin to see the market as a sequence of liquidity targets rather than random movement.
How does liquidity relate to the Wyckoff method?
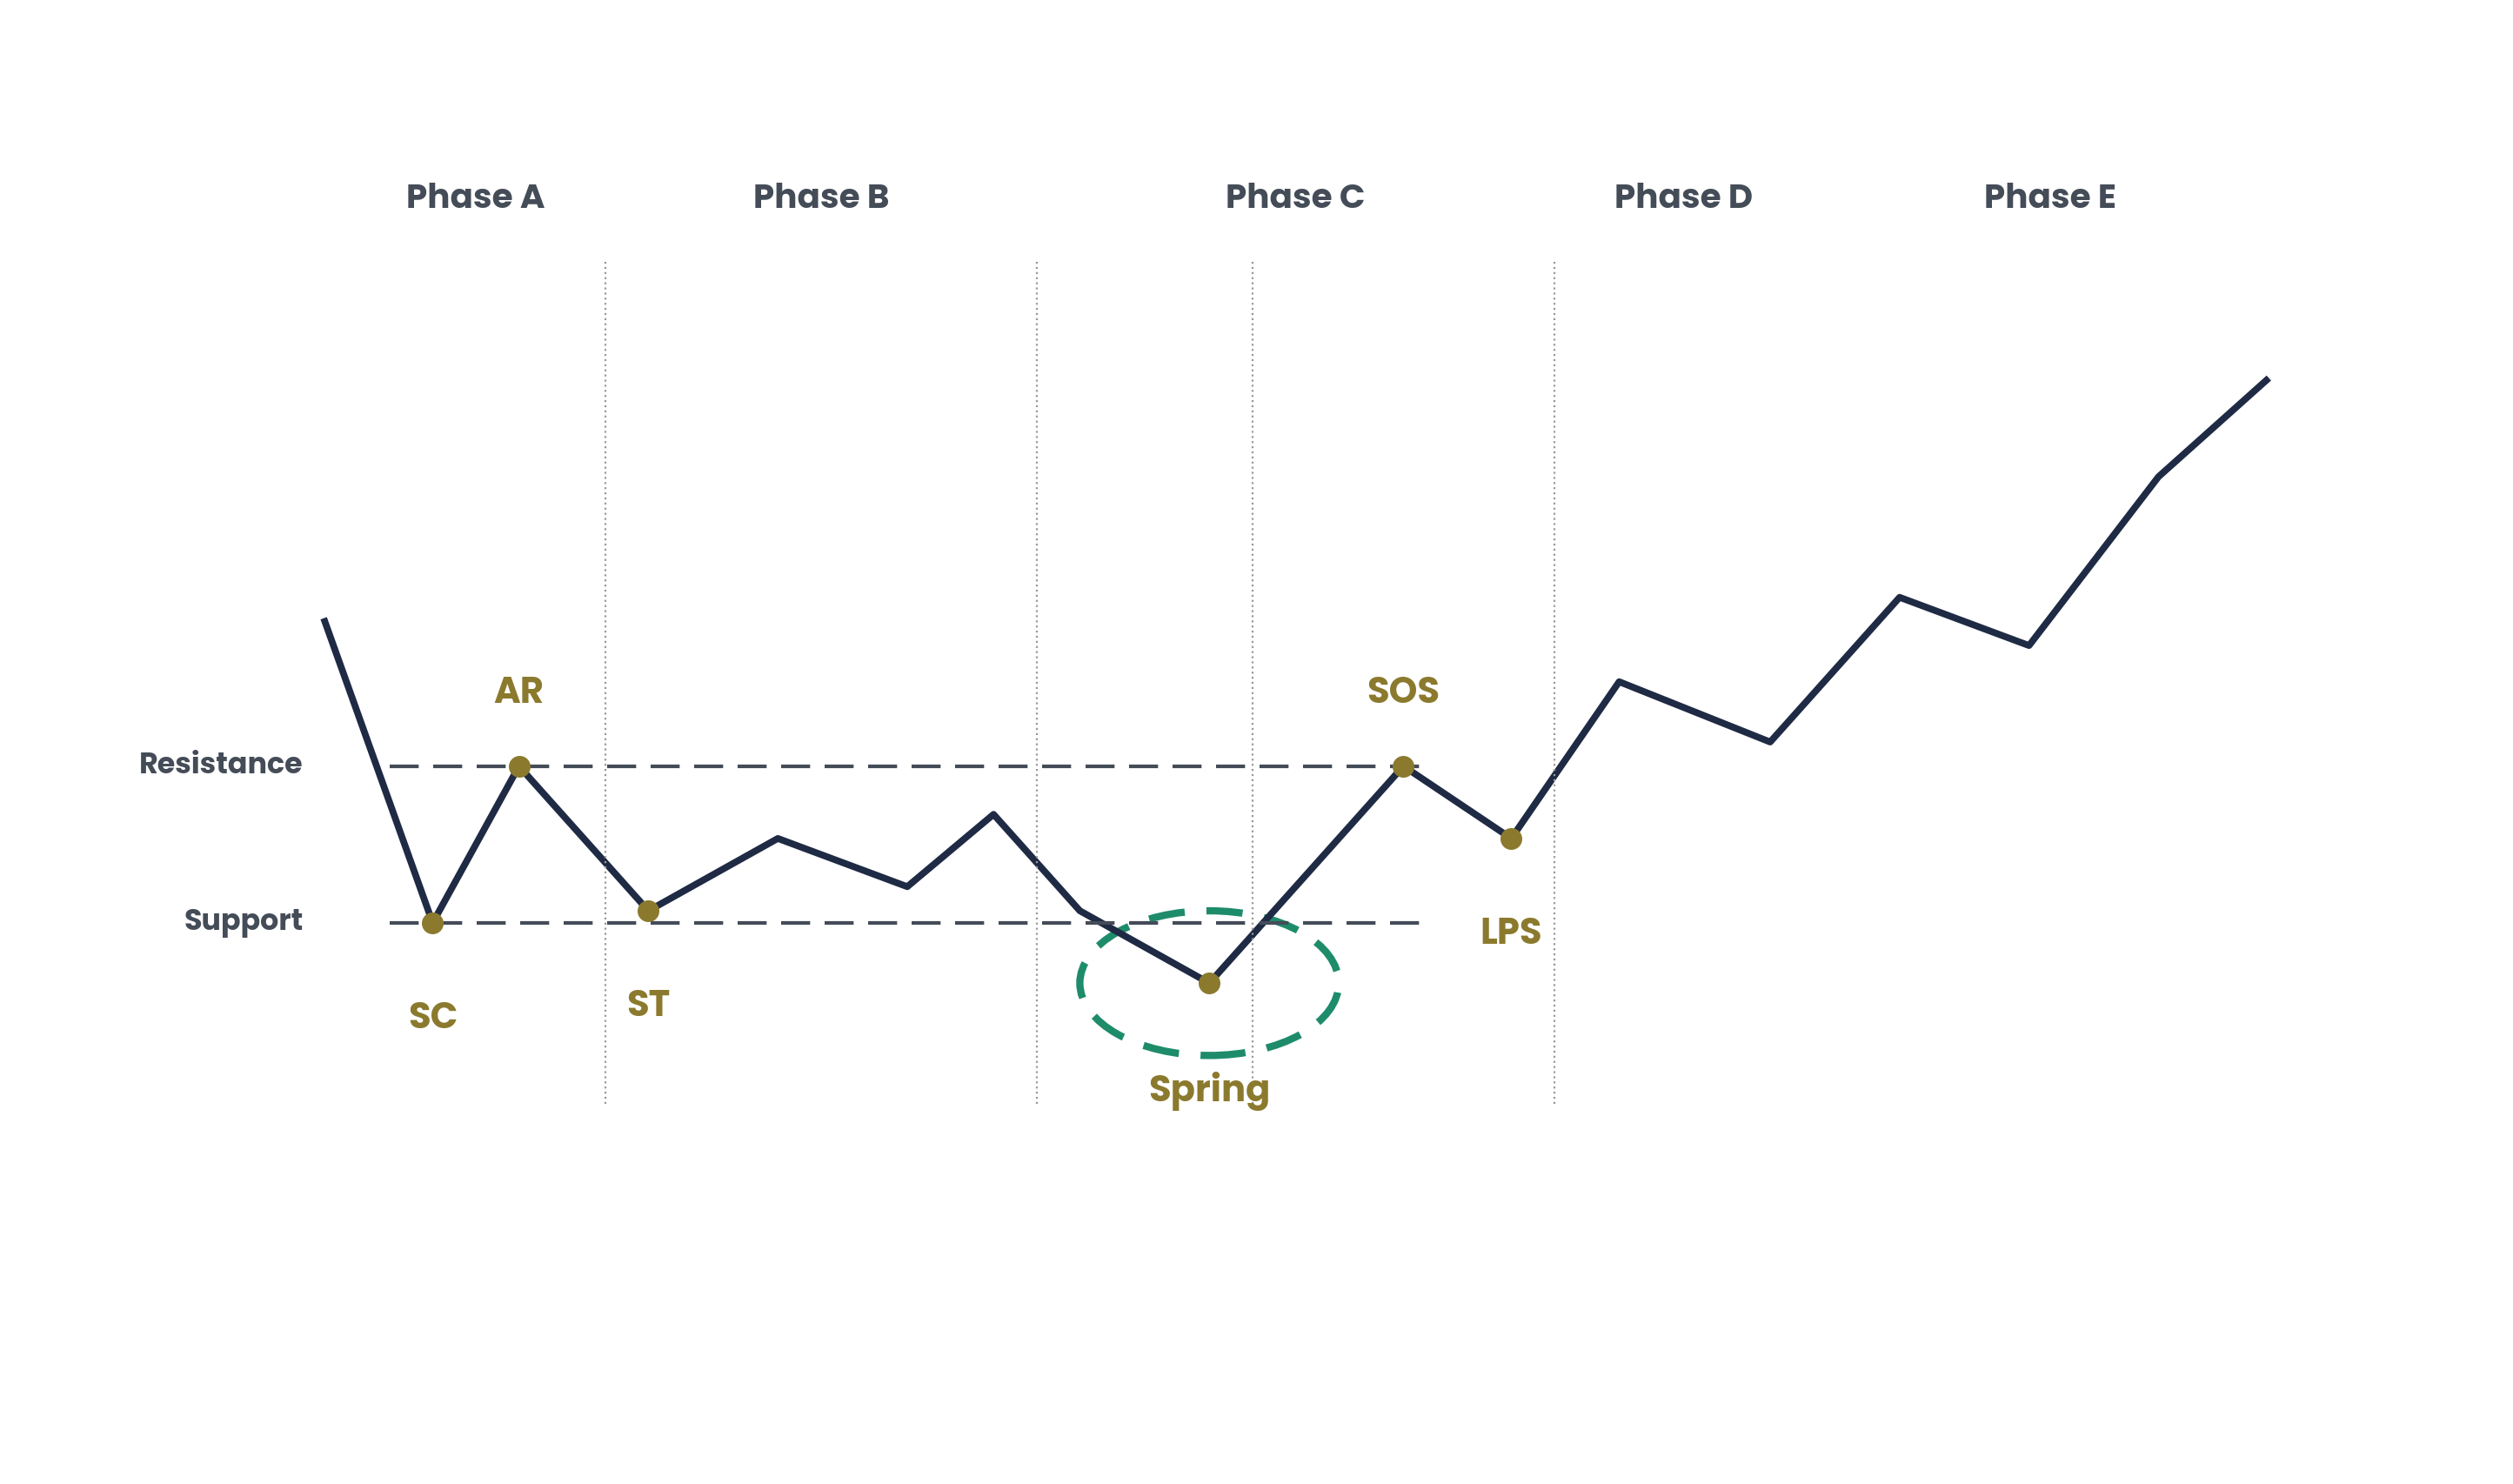
Wyckoff’s framework, developed nearly a century before ICT, describes the same phenomenon in different language. Wyckoff’s “spring” is a liquidity sweep below support in an accumulation range. His “upthrust” is a sweep above resistance in a distribution range. His “composite man” is what ICT calls “smart money.” The Wyckoff method and ICT are describing the same institutional behaviour through different analytical lenses.
Does this work on all instruments and timeframes?
The principle is universal because it describes the mechanics of how large orders interact with markets. It works on forex, Gold, Silver, BTC, indices (NQ, ES), and stocks. The most visible liquidity sweeps occur on instruments with high retail participation (forex majors, Gold, Bitcoin) because the retail stop clusters are larger and more predictable. Higher timeframe sweeps (daily, 4-hour) are more significant than lower timeframe sweeps because they represent larger institutional operations.
Continue Reading
▶ Order Blocks: Identifying Institutional Footprints
From The Book
This article covers concepts from Chapter 31 of The Complete Trader’s Edge.
 The Complete Trader's Edge
The full Mind · Method · Money framework. 70 chapters.
View on Amazon →
The Complete Trader's Edge
The full Mind · Method · Money framework. 70 chapters.
View on Amazon →
 Market Mayhem
400 years of bubbles, crashes, and the pattern that keeps repeating.
Buy on Amazon →
Market Mayhem
400 years of bubbles, crashes, and the pattern that keeps repeating.
Buy on Amazon →
 Greatest Companies
How the world's greatest companies were built — and what traders learn from them.
View on Amazon →
Greatest Companies
How the world's greatest companies were built — and what traders learn from them.
View on Amazon →
 Greatest Traders
Eighty-six lives that explain the markets — Livermore to Madoff, told with the losses left in.
View on Amazon →
Greatest Traders
Eighty-six lives that explain the markets — Livermore to Madoff, told with the losses left in.
View on Amazon →