Elliott Wave Theory is one of the most debated frameworks in technical analysis. Its proponents believe it provides a roadmap for predicting market turns with remarkable precision. Its critics argue it is subjective, overfitted, and impossible to apply in real time. The truth, as usual, lies somewhere in between — and understanding where Elliott Wave adds genuine value and where it falls apart is essential for any serious technical trader.
This guide will not teach you to draw wave counts with dogmatic certainty. It will teach you the core principles of Elliott Wave, how they map onto the institutional price delivery concepts used in smart money trading, and how to extract practical trading value without falling into the common traps of wave analysis.
The Core Theory
Ralph Nelson Elliott developed his theory in the 1930s after studying decades of stock market data. His central observation was that markets move in recognisable patterns driven by collective human psychology — and that these patterns repeat at every scale, from minute charts to multi-decade cycles.
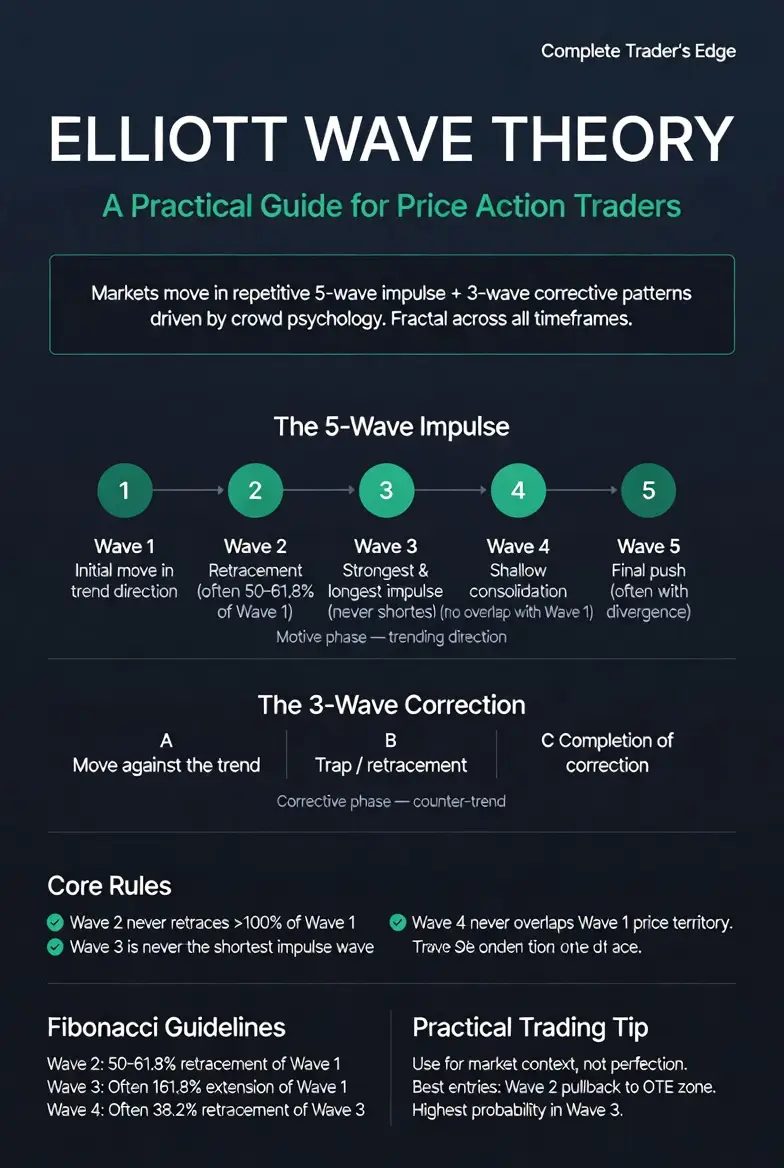
The basic structure is a five-wave motive pattern followed by a three-wave corrective pattern:
The motive wave (1-2-3-4-5): This is the trending phase. Waves 1, 3, and 5 move in the direction of the primary trend (impulse waves). Waves 2 and 4 move against the trend (corrective waves within the impulse). Wave 3 is typically the longest and most powerful. Wave 5 is the final push before a significant reversal.
The corrective wave (A-B-C): This is the counter-trend phase. Wave A moves against the prior trend. Wave B is a partial retracement that often traps traders into thinking the trend has resumed. Wave C completes the correction, often reaching or exceeding the end of wave A.
Elliott observed that this 5-3 pattern is fractal — it appears at every degree of trend, from intraday swings to multi-year market cycles. A wave 1 on the daily chart is itself composed of five smaller waves on the hourly chart. Each wave down is composed of five smaller waves on an even shorter timeframe. This fractal quality is what gives the theory its intellectual appeal and its practical difficulty.
The Rules and Guidelines
Elliott Wave has three inviolable rules that distinguish valid wave counts from invalid ones:
Rule 1: Wave 2 can never retrace more than 100% of wave 1. If it does, your wave count is wrong.
Rule 2: Wave 3 can never be the shortest of the three impulse waves (1, 3, and 5). In practice, wave 3 is almost always the longest.
Rule 3: Wave 4 can never overlap with the price territory of wave 1 (except in diagonal patterns). This means the low of wave 4 must stay above the high of wave 1 in an uptrend.
Beyond these hard rules, there are guidelines — tendencies that occur frequently but are not required. Wave 2 often retraces 50-61.8% of wave 1. Wave 3 often extends to 161.8% of wave 1. Wave 4 often retraces 38.2% of wave 3. These are the Fibonacci relationships that give Elliott Wave its mathematical framework.
Where Elliott Wave Meets Smart Money Concepts
Here is where the theory becomes genuinely useful for traders using the ICT framework. The five-wave motive pattern maps remarkably well onto the institutional price delivery model:
Wave 1 = Initial displacement. The first impulsive move away from an accumulation zone. In ICT terms, this is the initial break of structure after smart money has accumulated positions. It creates the first fair value gap and order block of the new trend.
Wave 2 = Retracement to the order block. Price pulls back to fill the FVG or test the order block left by wave 1. This is where institutional traders add to their positions. In ICT terms, this is the optimal trade entry (OTE) zone — the golden pocket between the 61.8% and 78.6% Fibonacci retracement.
Wave 3 = The power move. The strongest and most extended impulse. This is where liquidity is aggressively sought, multiple FVGs are created, and the trend accelerates. In the Power of 3 model, this corresponds to the distribution phase — smart money driving price aggressively in their intended direction.
Wave 4 = Consolidation and liquidity engineering. A shallower pullback that often takes the form of a complex correction (flat, triangle, or combination). In ICT terms, this is where the market maker model creates a dealing range, engineers liquidity on both sides, and prepares for the final push.
Wave 5 = The final expansion. The last push of the trend, often driven by retail FOMO rather than institutional conviction. Volume typically diverges (lower highs in volume while price makes higher highs). In ICT terms, this is where smart money begins distributing positions to late-arriving retail traders.
The A-B-C correction = The reversal sequence. Wave A is the initial break of structure in the opposite direction. Wave B is the trap — a move that looks like trend resumption but is actually a stop-hunt designed to sweep the last remaining positions before wave C drives price sharply in the new direction.
The Practical Problems with Elliott Wave
Despite its intellectual elegance, Elliott Wave presents serious practical challenges:
Subjectivity. Give ten Elliott Wave analysts the same chart and you will get ten different wave counts. The theory provides enough flexibility in its “alternative count” framework that almost any price movement can be fitted to a wave structure after the fact. This post-hoc fitting is the theory’s greatest weakness — it is much easier to label waves in hindsight than in real time.
Complexity of corrections. While impulse waves are relatively straightforward (five waves with clear rules), corrective waves can take dozens of forms — flats, zigzags, triangles, double corrections, triple corrections, running corrections. This complexity means that during corrective phases, the wave count is often ambiguous until the correction is complete.
The “alternate count” escape hatch. Practitioners typically maintain multiple possible wave counts and eliminate them as price progresses. While this is intellectually honest, it reduces the theory’s practical value as a predictive tool. If your framework requires three possible scenarios with different implications, you need additional tools to determine which scenario is playing out.
Time horizon mismatch. Elliott Wave analysis is most reliable on higher timeframes (daily and above) where the wave patterns have time to develop clearly. On intraday charts, the signal-to-noise ratio drops sharply and wave counts become unreliable.
How to Extract Practical Value from Elliott Wave
Given these limitations, here is how to use Elliott Wave as a supporting tool rather than a primary trading system:
Use it for context, not entries. Elliott Wave is excellent for answering the question “where are we in the larger cycle?” Are we in an early impulse (waves 1-2) with significant room to run? Are we in a late impulse (wave 5) where the trend is likely exhausting? Are we in a correction where the next major move has not yet started? This context improves your decision-making on lower timeframes without requiring precise wave counts.
Combine with Fibonacci levels. The Fibonacci relationships within Elliott Wave (wave 2 retraces to 61.8%, wave 3 extends to 161.8%, wave 4 retraces to 38.2%) provide concrete price levels you can use for entries, targets, and invalidation points. These levels work whether your wave count is perfect or not — because Fibonacci levels have their own statistical validity independent of wave theory.
Use market structure as the primary tool. Market structure analysis — the sequence of higher highs and higher lows (uptrend) or lower highs and lower lows (downtrend) — tells you the same directional information as an Elliott Wave impulse count, but without the complexity and subjectivity. Use wave analysis to enrich your understanding, not to replace simpler, more robust tools.
Look for the high-probability scenarios. Not all wave positions are equally tradeable. The highest-probability setups in Elliott Wave are: buying the wave 2 pullback to the OTE zone, trading the wave 3 extension with momentum, and positioning for the wave C of a correction. These three scenarios offer the clearest risk-reward and the most overlap with smart money concepts.
Accept imperfection. You will never have a perfect wave count in real time. The goal is not perfection — it is tilting the probabilities in your favour. If Elliott Wave analysis gives you 60% directional accuracy combined with proper position sizing and stop loss discipline, the mathematics work in your favour over hundreds of trades.
Elliott Wave and the Mind · Method · Money Framework
Mind: The biggest psychological trap in Elliott Wave is confirmation bias — seeing the wave count you want to see rather than what the chart is actually showing. Maintain objectivity by always identifying the wave count that would invalidate your trade, not just the one that supports it.
Method: Use Elliott Wave as a macro context tool that sits above your primary entry methodology. If your trading strategy is ICT-based, wave analysis helps you identify which setups have the best odds based on where price sits in the larger cycle.
Money: Wave 3 trades justify larger position sizes because the probability and momentum are both in your favour. Wave 5 trades demand smaller sizes because the trend is exhausting. Wave B traps demand extreme caution because they are designed to catch traders on the wrong side. Let the wave context inform your sizing.
Key Takeaways
🌊 Elliott Wave describes a 5-wave impulse followed by a 3-wave correction — a pattern that maps onto institutional price delivery models.
🎯 The highest-probability trades: wave 2 pullback to OTE, wave 3 extension, and wave C completion.
⚠️ The theory is subjective and difficult to apply in real time. Use it for context, not as a standalone system.
🔗 Combining Elliott Wave with ICT concepts (order blocks, FVGs, liquidity) creates a more robust framework than either approach alone.
 The Complete Trader's Edge
The full Mind · Method · Money framework. 70 chapters.
View on Amazon →
The Complete Trader's Edge
The full Mind · Method · Money framework. 70 chapters.
View on Amazon →
 Market Mayhem
400 years of bubbles, crashes, and the pattern that keeps repeating.
Buy on Amazon →
Market Mayhem
400 years of bubbles, crashes, and the pattern that keeps repeating.
Buy on Amazon →
 Greatest Companies
How the world's greatest companies were built — and what traders learn from them.
View on Amazon →
Greatest Companies
How the world's greatest companies were built — and what traders learn from them.
View on Amazon →
 Greatest Traders
Eighty-six lives that explain the markets — Livermore to Madoff, told with the losses left in.
View on Amazon →
Greatest Traders
Eighty-six lives that explain the markets — Livermore to Madoff, told with the losses left in.
View on Amazon →