

Every chart tells the same story. Price expands, retraces, consolidates, and reverses. These are not random behaviours. They are the four elements of ICT price delivery, the framework that explains how institutional participants move price from one level to the next, and how you can use that understanding to position yourself on the right side of the market.
Most traders look at a chart and see noise. They see candles moving up, then down, then sideways, and they react emotionally to each swing. But when you understand price delivery, you start seeing the logic behind every move. You see institutions accumulating, engineering liquidity, and delivering price to their targets. This article breaks down all four elements, shows you how to identify each one in real time, and gives you a decision framework for what to do when you recognise them.
What Is ICT Price Delivery?
Price delivery is the mechanism by which institutional order flow moves price from one area of interest to another. Markets do not move randomly. They are driven by large participants who need to fill massive orders at specific price levels. The process of filling those orders creates predictable patterns that repeat across every instrument and every timeframe.
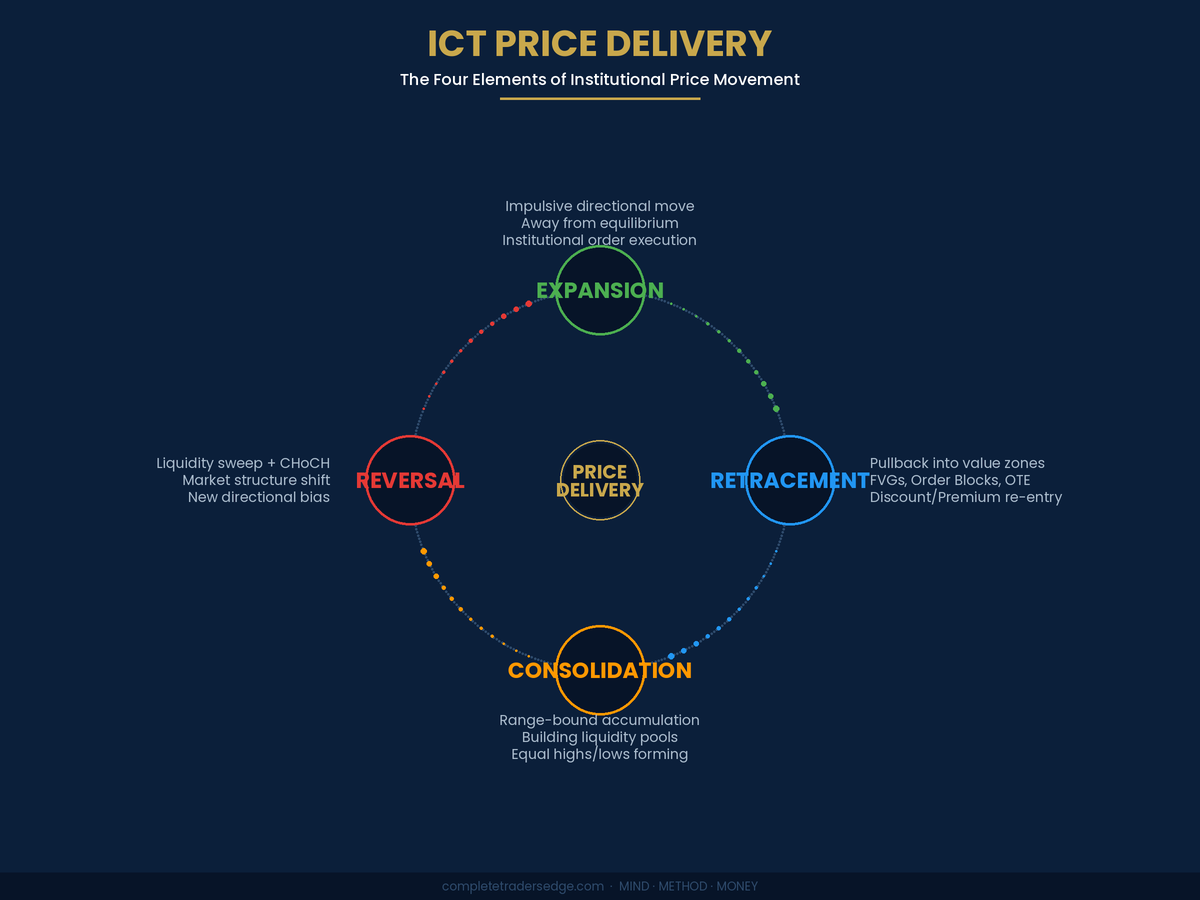
The ICT framework identifies four distinct elements of price delivery. Every candle on your chart falls into one of these categories. When you can identify which phase price is currently in, you know exactly what to expect next and how to respond.
The four elements are: Expansion, Retracement, Consolidation, and Reversal. They form a cycle. Price expands away from equilibrium, retraces back toward value, consolidates while liquidity builds, and eventually reverses when one side of the market has been swept. Understanding where you are in this cycle at any given moment is the single most valuable skill in technical analysis.
Element 1: Expansion
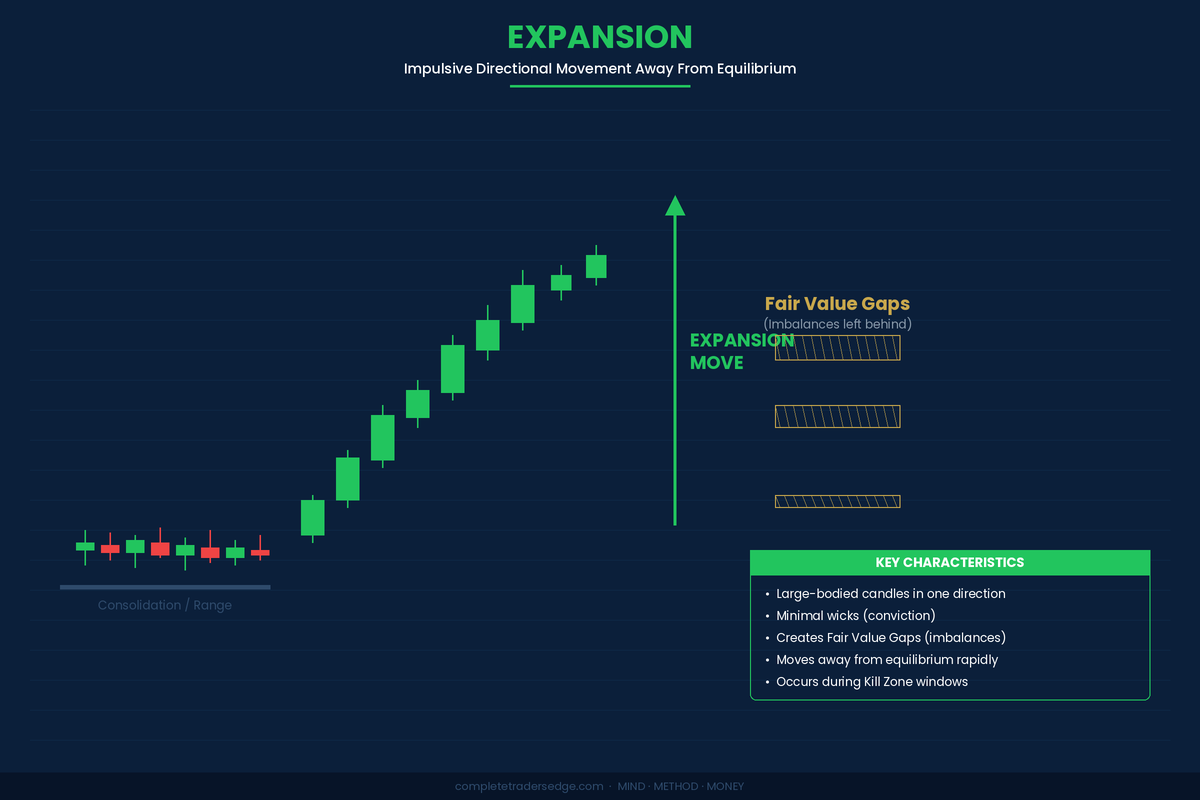
Expansion is the most recognisable element of price delivery. It is the impulsive, directional move where institutions are actively executing large orders and price is moving rapidly away from equilibrium. This is the phase where money is made, but only if you are already positioned before it begins.
Expansion candles are large-bodied with minimal wicks. They show conviction. There is no hesitation in an expansion move. Price is simply being delivered from one level to the next. As price expands, it leaves behind Fair Value Gaps (FVGs), the imbalances between three consecutive candles that mark where price moved too quickly for all orders to be filled.
These FVGs are not just visual artefacts. They are the breadcrumbs that institutional order flow leaves behind, and they become the zones where price is likely to return during the retracement phase.
How to Identify Expansion
Large-bodied candles moving decisively in one direction. Minimal upper and lower wicks, which indicate that price closed near its extremes. Fair Value Gaps forming in the wake of the move. Strong directional bias, often originating from a Break of Structure or a Kill Zone opening.
What to Do During Expansion
Do not chase. This is the most critical rule. When you see expansion that you are not already positioned in, your job is to mark the FVGs and order blocks that price left behind. Those are your future entry zones. Chasing an expansion move is how retail traders consistently buy the top and sell the bottom. Instead, wait for the retracement.
Element 2: Retracement
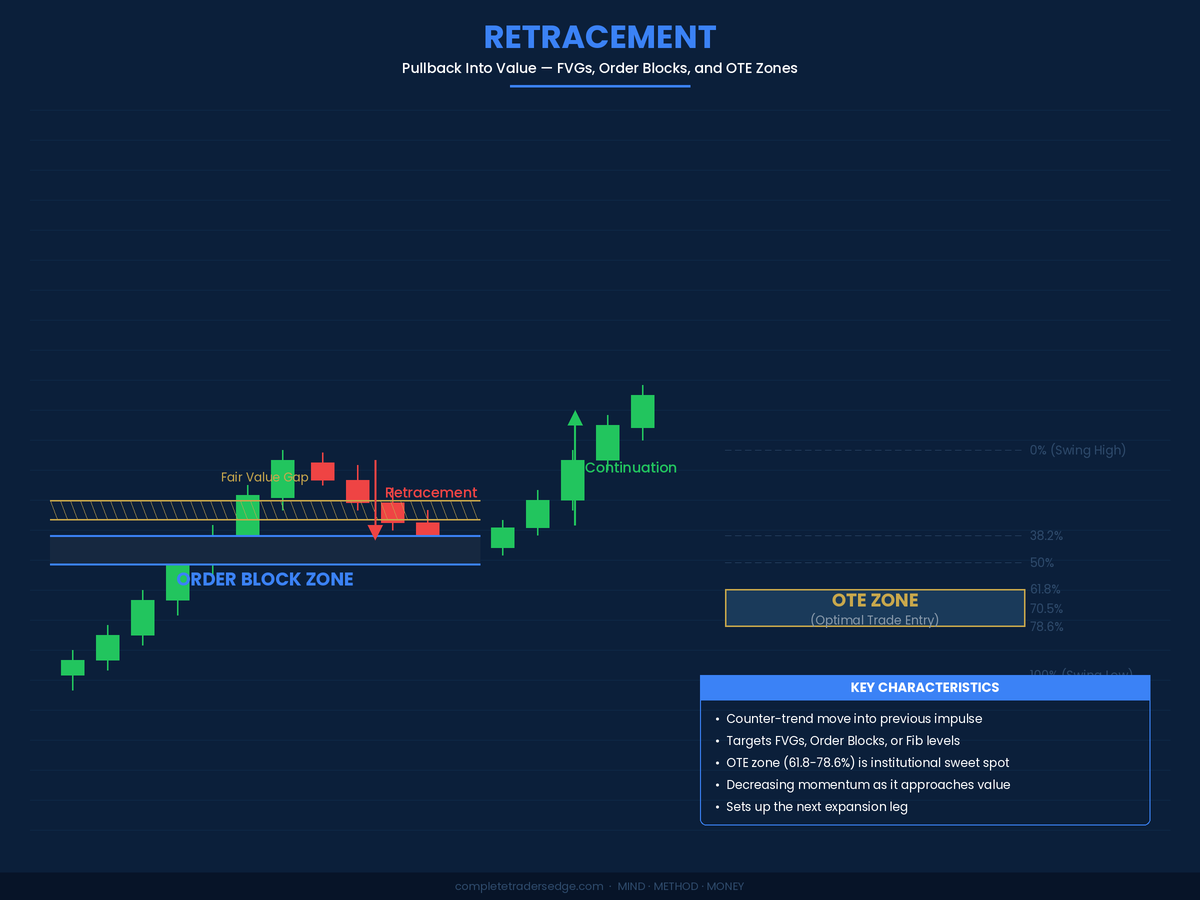
Retracement is the counter-trend move back into the previous impulse. After an expansion, price does not continue in a straight line forever. It pulls back, and that pullback is not random. It targets specific zones where institutional interest sits: FVGs, order blocks, and the Optimal Trade Entry (OTE) zone between the 61.8% and 78.6% Fibonacci retracement levels.
Retracement is where the highest-probability entries live. This is the phase where you stop watching and start acting. When price retraces into an order block that sits within the OTE zone and also fills a Fair Value Gap, you have a confluence stack that dramatically increases the probability of your trade.
How to Identify Retracement
Counter-trend candles that are smaller than the expansion candles. Price approaching a previously marked FVG or order block. Entry into the 50% to 78.6% Fibonacci zone of the prior swing. Momentum visibly slowing as price nears the value zone.
What to Do During Retracement
Prepare your entry. Watch for a reaction at the order block or FVG. Confirm on a lower timeframe with a Change of Character (CHoCH), a lower timeframe structural shift that tells you the retracement is ending and the next expansion is beginning. Set your stop loss beyond the zone, and target the next opposing level. This is your bread-and-butter setup.
Element 3: Consolidation
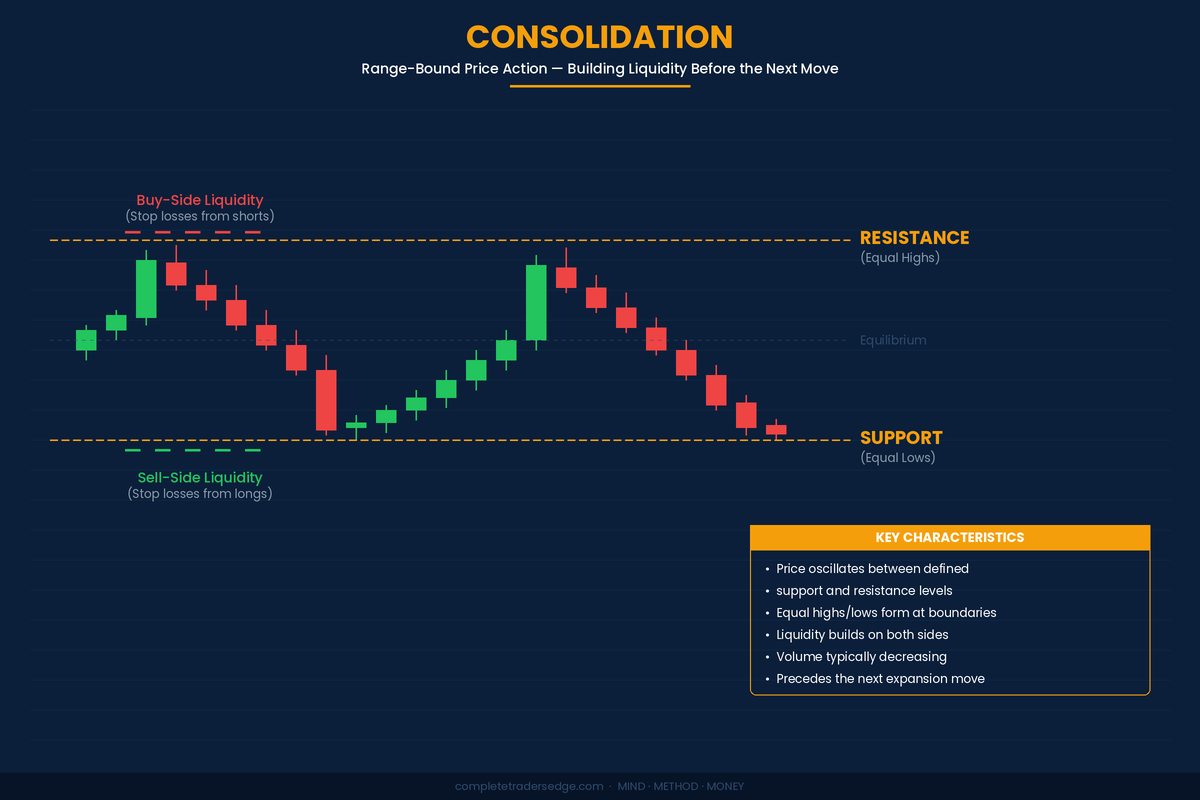
Consolidation is the phase that tests your patience. Price moves sideways between a defined support and resistance level, oscillating back and forth without committing to a direction. It looks like nothing is happening. It feels like the market is dead.
In reality, consolidation is one of the most important phases of price delivery. During consolidation, liquidity is being built on both sides of the range. Equal highs form near resistance as traders place sell orders and stop losses above. Equal lows form near support as traders place buy orders and stop losses below. The market is quietly loading fuel for the next expansion.
This is the accumulation or distribution phase that Wyckoff described nearly a century ago. Institutions are building their positions within the range, using the oscillating price action to fill their orders gradually without moving the market prematurely.
How to Identify Consolidation
Price bouncing between clearly defined levels. Equal highs and equal lows forming at the range boundaries. Volume typically decreasing as the range tightens. Multiple failed breakout attempts that quickly reverse back into the range.
What to Do During Consolidation
The single best thing you can do during consolidation is nothing. Do not trade the range. Trading inside a consolidation range is a low-probability game because you are fighting against institutional accumulation. Instead, map the liquidity. Identify where the equal highs and equal lows sit. Mark the liquidity pools above and below the range. Then wait for the sweep that signals the range is ending and the next expansion is beginning.
Element 4: Reversal
Reversal is the most dramatic element of price delivery. It is the moment where the market’s directional bias flips. The trend that everyone believed was intact suddenly breaks, and price begins moving in the opposite direction with conviction.
Reversals do not happen randomly. They follow a specific sequence that, once you learn to recognise it, becomes one of the most reliable patterns in the market.
The Reversal Sequence
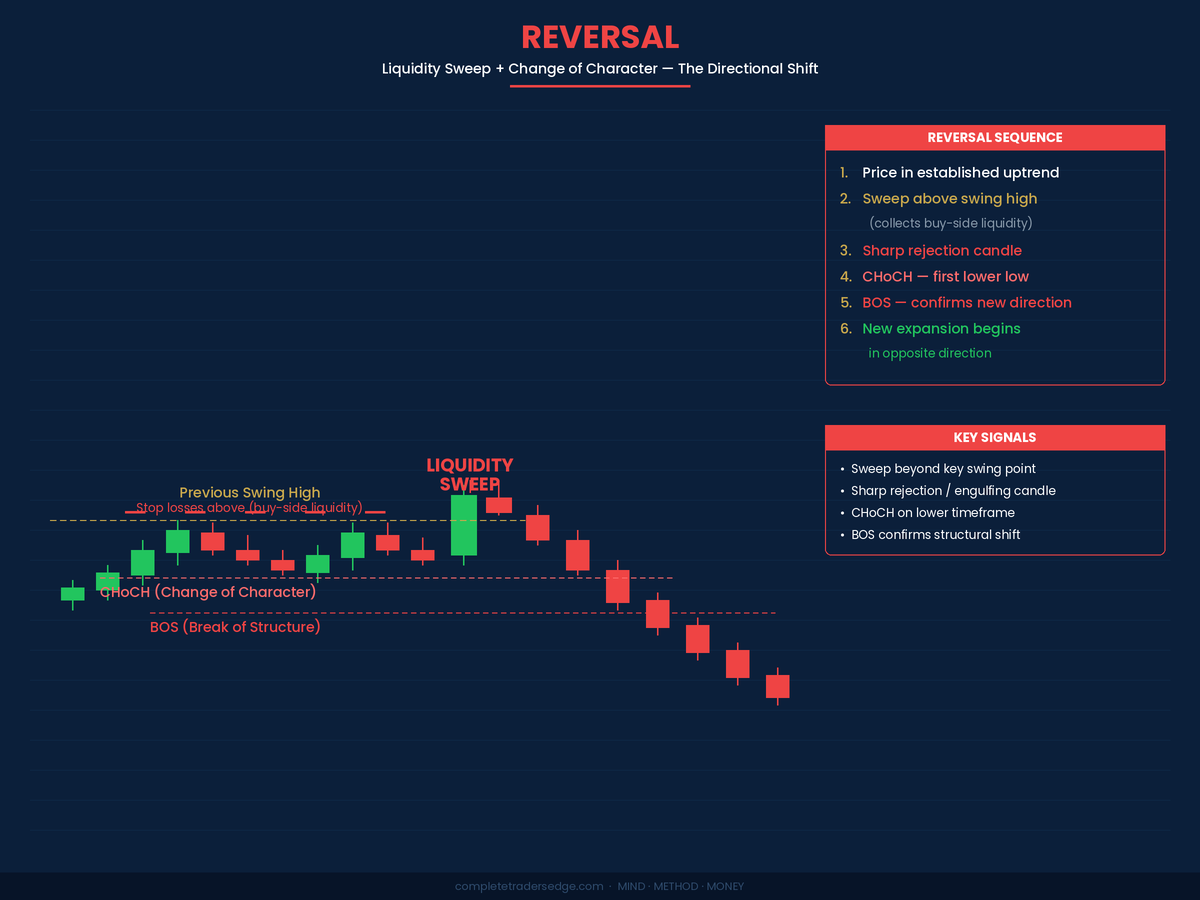
First, price is in an established trend, making higher highs and higher lows in an uptrend, or lower highs and lower lows in a downtrend. Second, price sweeps beyond a key swing point, collecting the liquidity that has built up beyond that level. This is the liquidity sweep: the stop hunt that triggers the orders institutions need to fill their counter-trend positions.
Third, a sharp rejection candle appears. The sweep was not a breakout. It was a trap. Fourth, a Change of Character (CHoCH) occurs on the lower timeframe, the first structural violation that signals the old trend may be ending. Fifth, a Break of Structure (BOS) confirms the new direction. The market has shifted.
What to Do During a Reversal
Wait for confirmation. A sweep alone is not enough. You need the CHoCH and ideally the BOS before committing to the new direction. Once confirmed, enter on a retracement into the new order block that formed at the point of reversal. Your stop goes beyond the sweep high or low, and your target is the next significant level in the new direction. The reversal feeds directly into a new expansion, and the cycle begins again.
How Price Delivery Maps to the Trading Day
Price delivery is not just a framework for reading charts. It maps directly onto the structure of the trading day. Each Kill Zone tends to produce a specific type of price delivery, and understanding this gives you an edge before the market even opens.
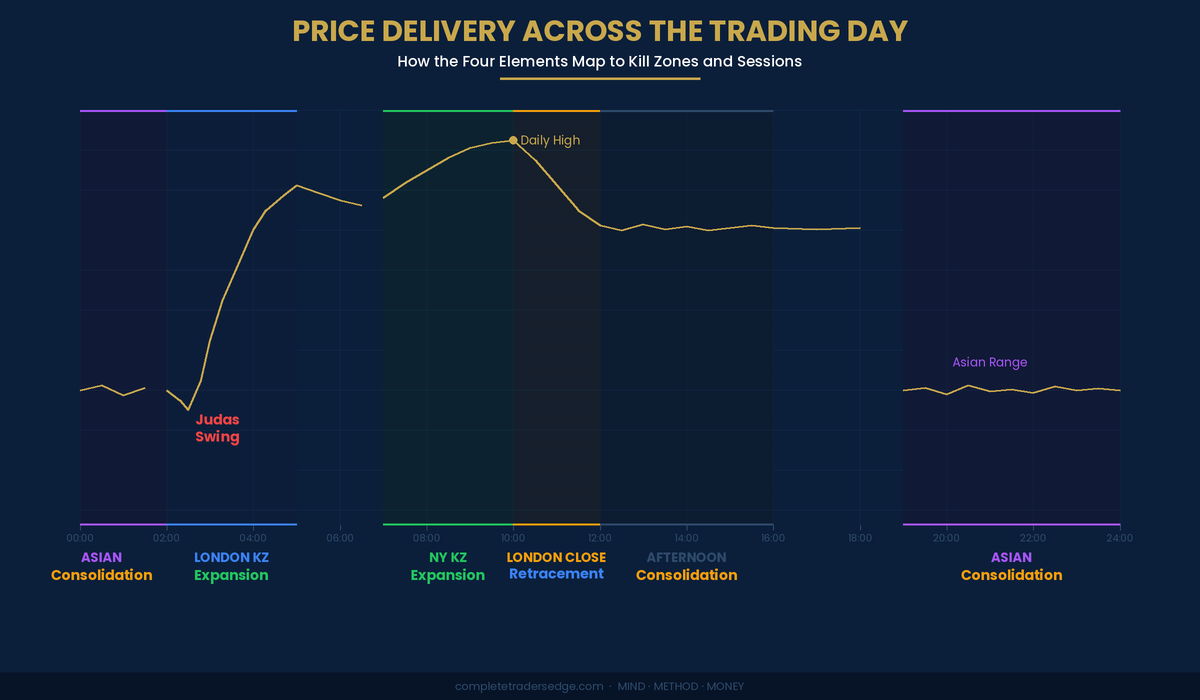
The Asian session (19:00-02:00 ET) typically produces consolidation. Price ranges, builds liquidity on both sides, and establishes the levels that the London session will target. The London Kill Zone (02:00-05:00 ET) typically produces the first expansion of the day. This is where the Judas Swing often appears: a false move that sweeps Asian session liquidity before price reverses into the true daily direction.
The New York Kill Zone (07:00-10:00 ET) either continues the London expansion or reverses it. If New York confirms London’s direction, expect further expansion. If it reverses, you are witnessing a daily reversal setup. The London Close (10:00-12:00 ET) typically produces a retracement as European banks close their books. And the afternoon session tends to consolidate, setting up the next day’s cycle.
This is not a rigid formula. Markets do not follow scripts perfectly. But the pattern repeats often enough that framing your day through the lens of price delivery phases gives you a structural advantage over traders who treat every session identically.
The Decision Framework: What Phase Is Price In?
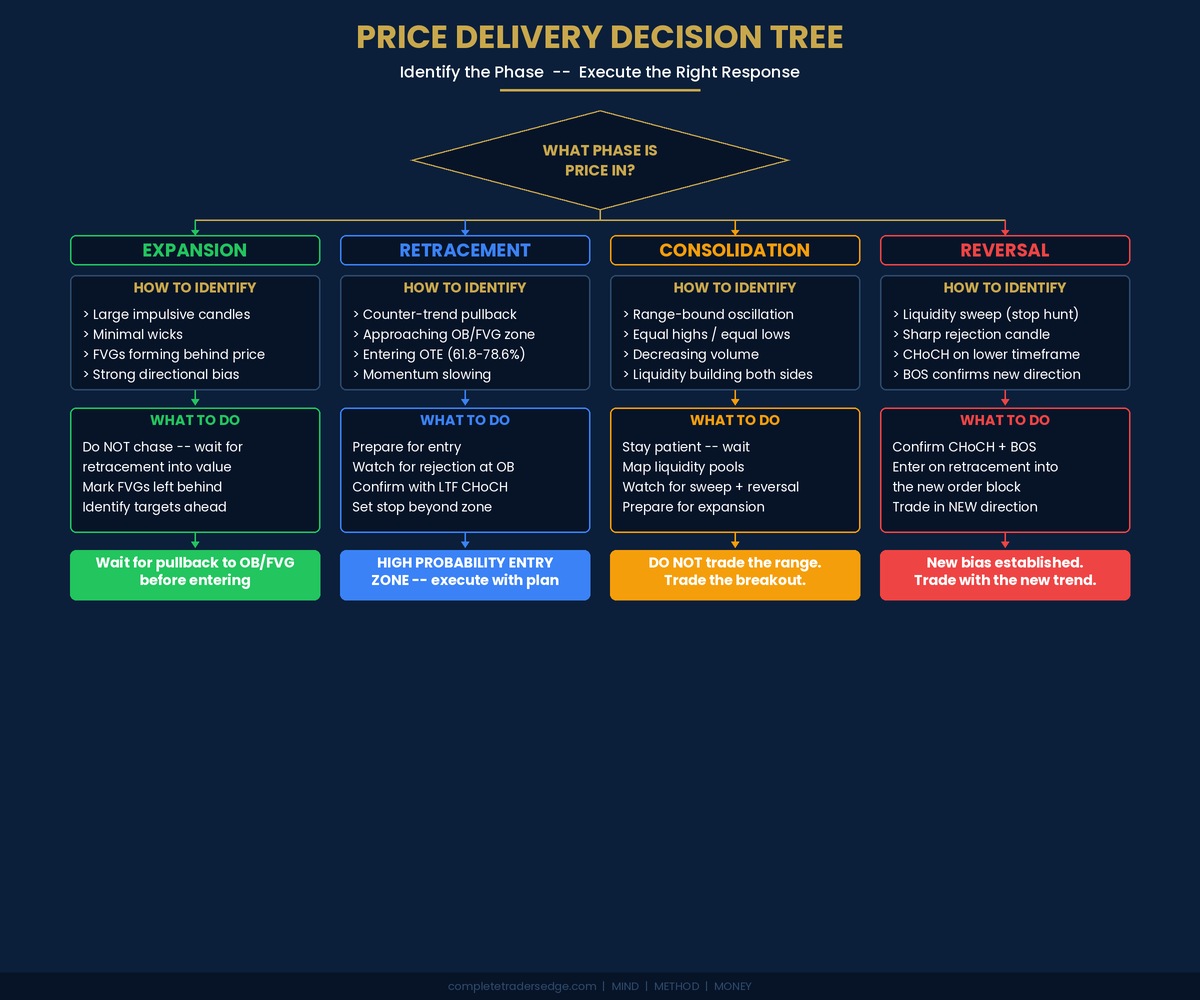
Every time you sit down at your chart, the first question you should ask is: what phase of price delivery is the market currently in? The answer determines everything you do next.
If price is expanding, do not chase. Mark the levels it leaves behind. If price is retracing, prepare to enter. Watch for reactions at your pre-marked zones. If price is consolidating, stay patient. Map liquidity and wait for the breakout. If price is reversing, confirm the sequence. Then position for the new trend.
This framework eliminates the paralysis that most traders feel when staring at a chart. You always know what to do because you always know where you are in the cycle. You stop reacting to individual candles and start reading the story that price is telling.
Putting It All Together
Price delivery is the foundation that ties every other ICT concept together. Order blocks, Fair Value Gaps, liquidity sweeps, Kill Zones, the OTE zone – they are all expressions of these four elements working in sequence. When you understand price delivery, you understand why price does what it does, not just what it did.
Start by labelling the phases on your chart. Go back through the last week of price action on your primary instrument and mark every expansion, retracement, consolidation, and reversal. Notice how they cycle. Notice how Kill Zones align with specific phases. Notice how FVGs appear during expansion and get filled during retracement.
This is not a strategy you bolt on to your trading. It is the lens through which every strategy becomes clearer. It is the difference between seeing individual trees and seeing the forest. Once you understand how price is delivered, you will never look at a chart the same way again.
Key Takeaways
- Expansion is the impulsive move. Do not chase it. Mark the FVGs and order blocks it creates, then wait for the retracement.
- Retracement is where the highest-probability entries live. Look for confluence at OBs, FVGs, and the OTE Fibonacci zone (61.8-78.6%).
- Consolidation is the patience phase. Do not trade the range. Map the liquidity pools and prepare for the next expansion.
- Reversal follows a specific sequence: liquidity sweep, rejection, CHoCH, BOS. Wait for confirmation before trading the new direction.
- Price delivery maps to the trading day: Asian consolidation, London expansion, NY continuation or reversal, London Close retracement.
- Always ask: “What phase is price in?” This single question eliminates most trading mistakes.
Continue Learning
Price delivery connects directly to many of the concepts we cover in depth across the site. For a deep dive into the zones where institutions leave their footprints, read Order Blocks Explained and Fair Value Gaps Explained. To understand the fuel that drives expansion and reversal, see Liquidity in Trading. And for the structural framework that confirms trend direction, start with our Market Structure Guide.
Price delivery is Method. Understanding when not to trade is Mind. And managing your risk at every entry is Money. All three work together.
 The Complete Trader's Edge
The full Mind · Method · Money framework. 70 chapters.
View on Amazon →
 Market Mayhem
400 years of bubbles, crashes, and the pattern that keeps repeating.
Buy on Amazon →
 Greatest Companies
How the world's greatest companies were built — and what traders learn from them.
View on Amazon →
 Greatest Traders
Eighty-six lives that explain the markets — Livermore to Madoff, told with the losses left in.
View on Amazon →