

Gold miners have just been more expensive, measured in barrels of oil, than at any time since 1975. In February 2026 a basket of gold-mining shares bought more crude than it had in fifty years. Then war with Iran all but halted tanker traffic through the Strait of Hormuz, oil jumped from $67 to over $100 in a month, and that ratio was cut in half.
That sequence has happened once before. In December 1973 miners priced in oil sat at a record, and the Arab oil embargo arrived within weeks. What followed was the most famous precious-metals bull market of the twentieth century. It was also one of the worst decades ever for owning gold miners instead of oil.
This piece rebuilds both episodes from 58 years of monthly TradingView data: gold, silver, WTI crude, and three different measures of the miners. The claim doing the rounds on social media checks out. The bullish story usually attached to it only half does.
Our read in brief.
The extreme is real. Miners against oil peaked in February 2026 at their highest since July 1975 on our longest-running series, and at a record on the modern GDX ETF.
In the 1970s, the same setup was followed by an oil shock, a ratio collapse of 88%, a 45% correction in gold, and then a six-fold rally in gold to January 1980. The metals were the trade. Miners, measured against oil, never got back to their 1973 peak.
If the analog holds, it argues for respecting the metals, not for assuming miners will “catch up” to energy.
The chart behind the claim
This week NorthstarCharts posted the observation that set this off: gold and silver miners had recently reached a valuation against oil not seen since the 1970s, with an invitation to look at what happened to miners, oil and the metals after that.
The problem with checking a 1970s claim is that almost every miner index people quote today did not exist then. The Philadelphia Gold & Silver Index (XAU) starts in December 1983. The NYSE Arca Gold BUGS index starts in the 1990s. The VanEck Gold Miners ETF (GDX) listed in 2006.
So we used the longest continuous miner series available on TradingView: ASA Gold and Precious Metals (NYSE:ASA), a closed-end fund that has held gold-mining shares since 1958 and was, through the 1970s, in effect a listed portfolio of South African gold mines. Divide its share price by the price of a barrel of WTI crude and you get miners priced in oil, month by month, back to 1968.
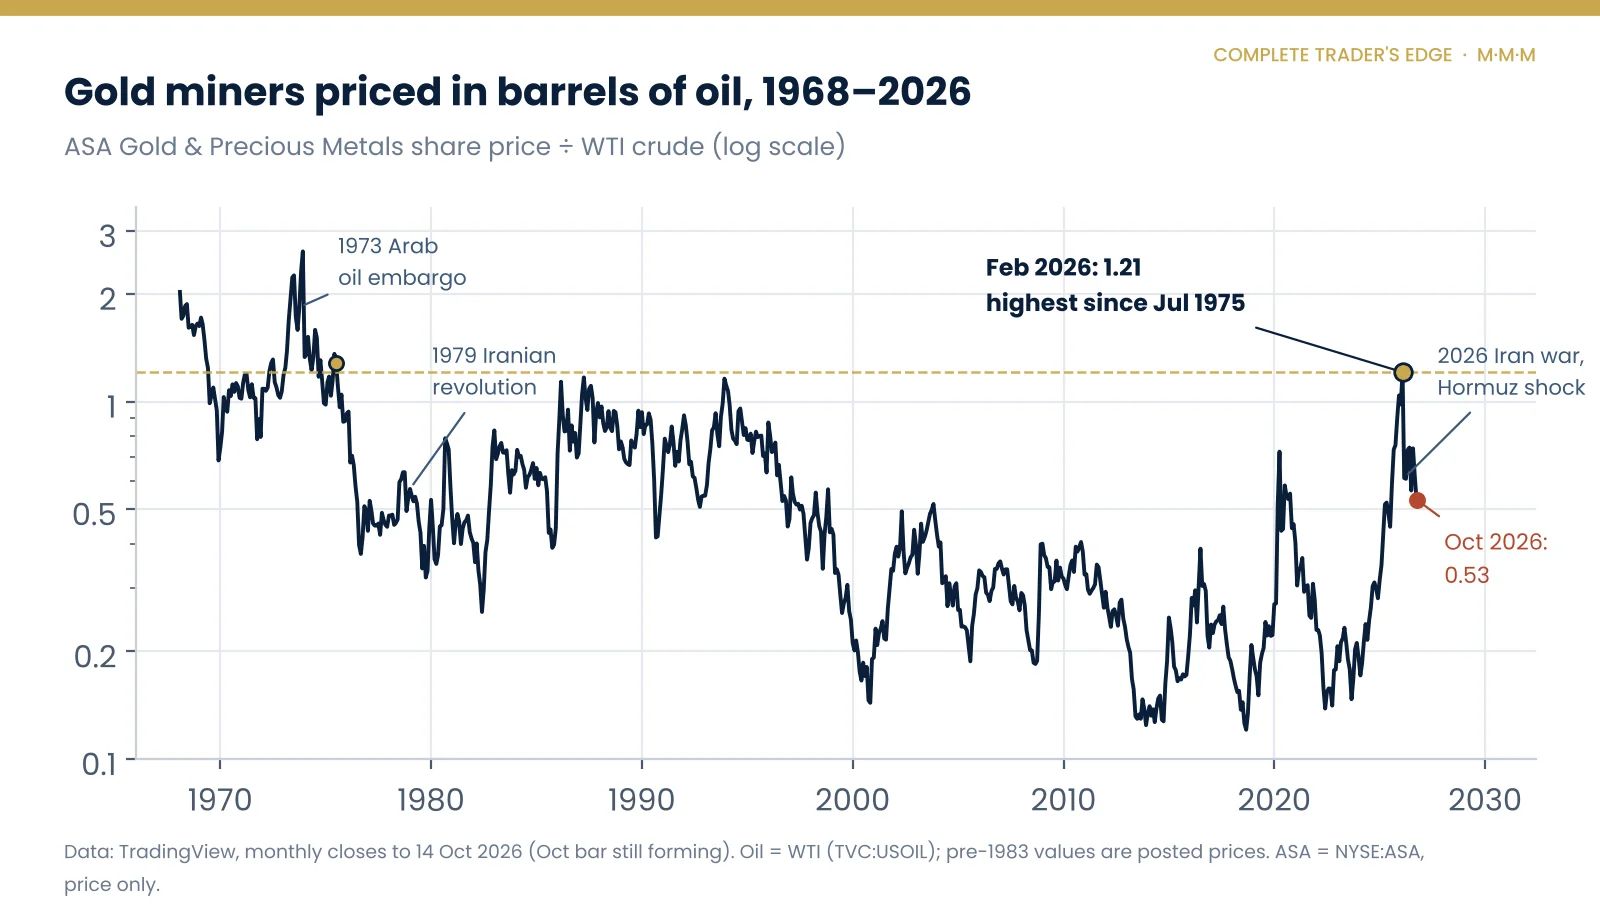
The February 2026 reading of 1.21 was the highest since July 1975. Within eight months it had fallen 56%, to 0.53. Both halves of that sentence matter, and most commentary has only looked at the first.
Gold miners vs oil: the modern indices agree
One fund is a thin basis for a fifty-year claim, so we checked it against everything else. Every miner and metal series we tested set its 2026 high against oil in the same month, February, and every one has since given back roughly half.
| Priced in WTI crude | Feb 2026 peak | Last time higher | Oct 2026 | Since peak | Long-run median |
|---|---|---|---|---|---|
| ASA (miners, from 1968) | 1.21 | Jul 1975 | 0.53 | −56% | 0.45 |
| XAU index (from Dec 1983) | 6.99 | May 1996 | 3.55 | −49% | 2.46 |
| GDX ETF (from May 2006) | 1.72 | Never (record) | 0.87 | −50% | 0.49 |
| Silver (from 1968) | 1.39 | Never (record in this data) | 0.58 | −58% | 0.30 |
| Gold (from 1968) | 78.5 | Apr 2020 (oil crash) | 42.6 | −46% | 16.0 |
Monthly closes from TradingView (NYSE:ASA, NASDAQ:XAU, AMEX:GDX, TVC:SILVER, TVC:GOLD, TVC:USOIL). October 2026 is the bar as at 14 October and is still forming.
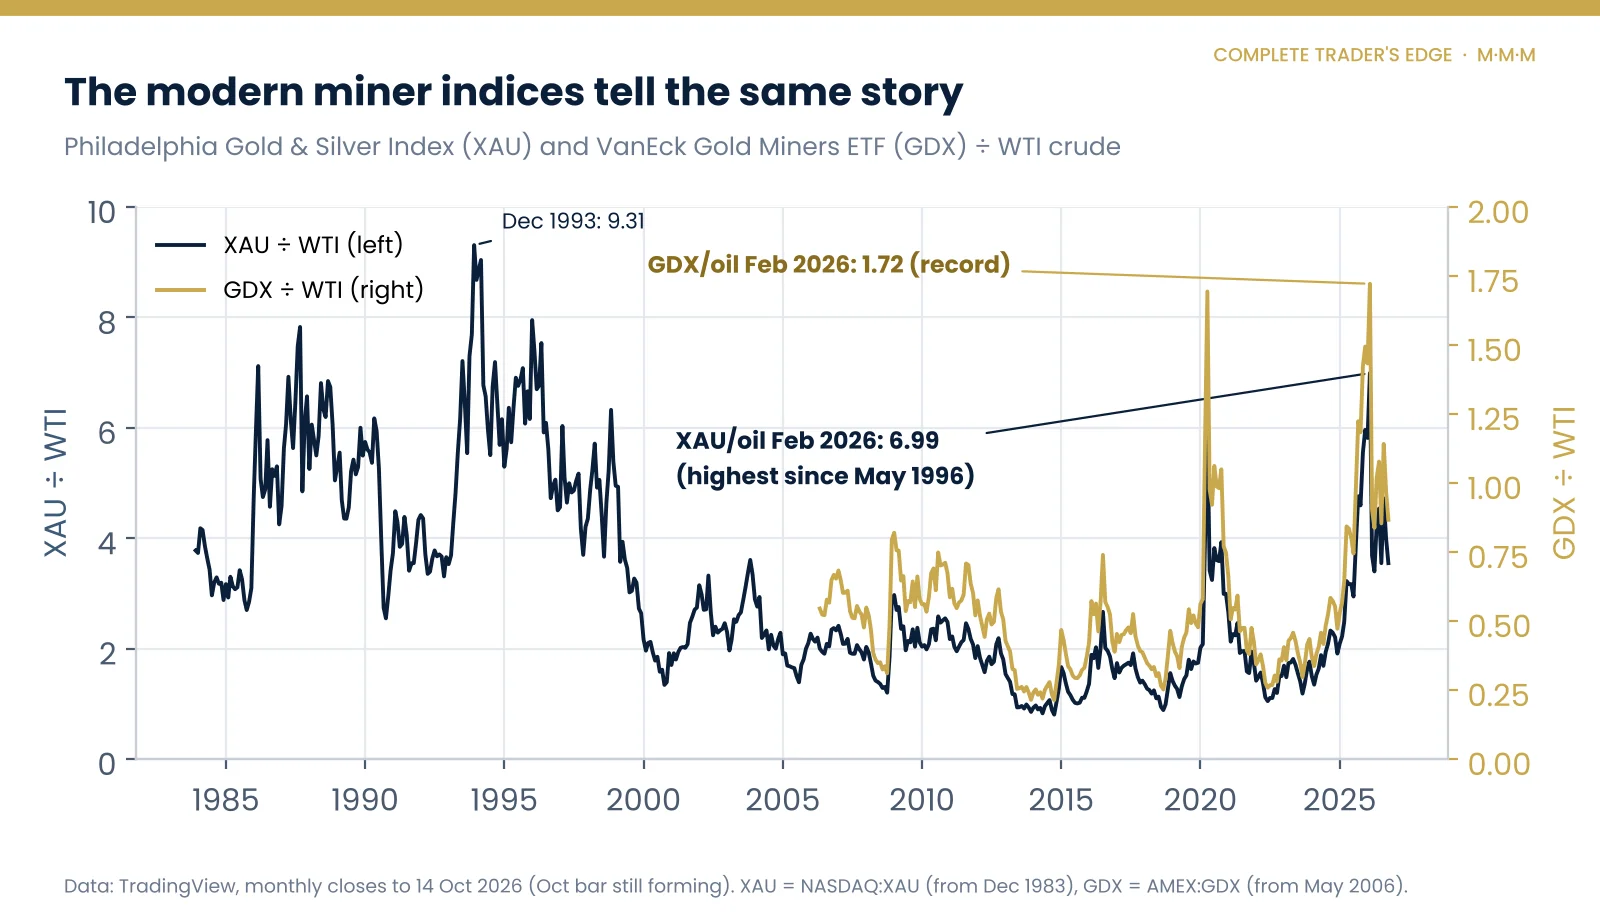
Two readings in that table deserve a second look. Silver bought more oil in February 2026 than at any point since our data begins in 1968, including January 1980, when the Hunt brothers had cornered the market. And gold bought 78 barrels of crude, against a long-run median of 16. Only the April 2020 oil crash, when WTI briefly traded below zero, beat it.
Whatever else is true, February 2026 was an outlier in the relationship between precious metals and energy. Outliers are where reversals start.
What miners priced in oil actually measures
A miner’s share price is, roughly, a bet on its margin. Revenue is the metal price. Costs are labour, equipment, royalties, and energy: diesel for the haul trucks, power for crushing and processing ore. Gold mining is an energy-hungry business, and when crude doubles, every ounce becomes more expensive to dig.
That makes the miners-to-oil ratio a crude margin gauge. When it climbs, the market is pricing metal prices running far ahead of input costs, which is exactly what happened through 2025 as gold went from about $2,600 to over $4,300 while WTI drifted into the high $50s. When it collapses, as it did in March 2026, the market is pricing the opposite: costs catching up with revenue.
The trap in reading this ratio as “cheap” or “expensive”. A high miners-to-oil ratio does not mean miners are overvalued. It means the market already believes margins are wide. The ratio peaks when that belief is most widely held, which is usually just before something tests it.
The 1970s, in five phases
The 1970s get remembered as one long gold bull market. The monthly data shows something much rougher: two great rallies separated by a brutal bear market, with oil, gold and the miners taking turns to lead.
| Phase | Gold | Silver | WTI | ASA (miners) | Miners ÷ oil |
|---|---|---|---|---|---|
| 1. The run-up Dec 1969 – Dec 1973 | +219% | +79% | +29% | +395% | +284% |
| 2. The oil shock Dec 1973 – Dec 1974 | +66% | +33% | +159% | −3% | −62% |
| 3. The bear market Dec 1974 – Aug 1976 | −45% | −5% | +9% | −56% | −60% |
| 4. The blow-off Aug 1976 – Jan 1980 | +560% | +719% | +167% | +257% | +34% |
| 5. The bust Jan 1980 – Jun 1982 | −54% | −83% | +8% | −48% | −51% |
Monthly closes. Oil before 1983 is the WTI posted price, which was set administratively rather than traded freely; it moved in steps, not every month.
Phase 1: the run-up. President Nixon closed the gold window in August 1971, and gold began to trade freely against a dollar that no longer had to be redeemed in it. Gold tripled. The miners did even better, nearly quintupling, because a miner’s profits rise faster than the metal when costs stay put. And costs did stay put: oil was still a price-controlled posted price of a few dollars a barrel. Miners priced in oil rose 284%. That was the “cosmic” phase, and it came before the oil shock, not after it.
Phase 2: the shock. The Yom Kippur War began in October 1973 and Arab producers imposed an oil embargo. The posted price of WTI went from $4.31 in December 1973 to $10.11 in January 1974. Miners priced in oil halved in a single month. Gold kept rising, finishing 1974 up 66%, but the miners went nowhere. Their margins were being squeezed from below.
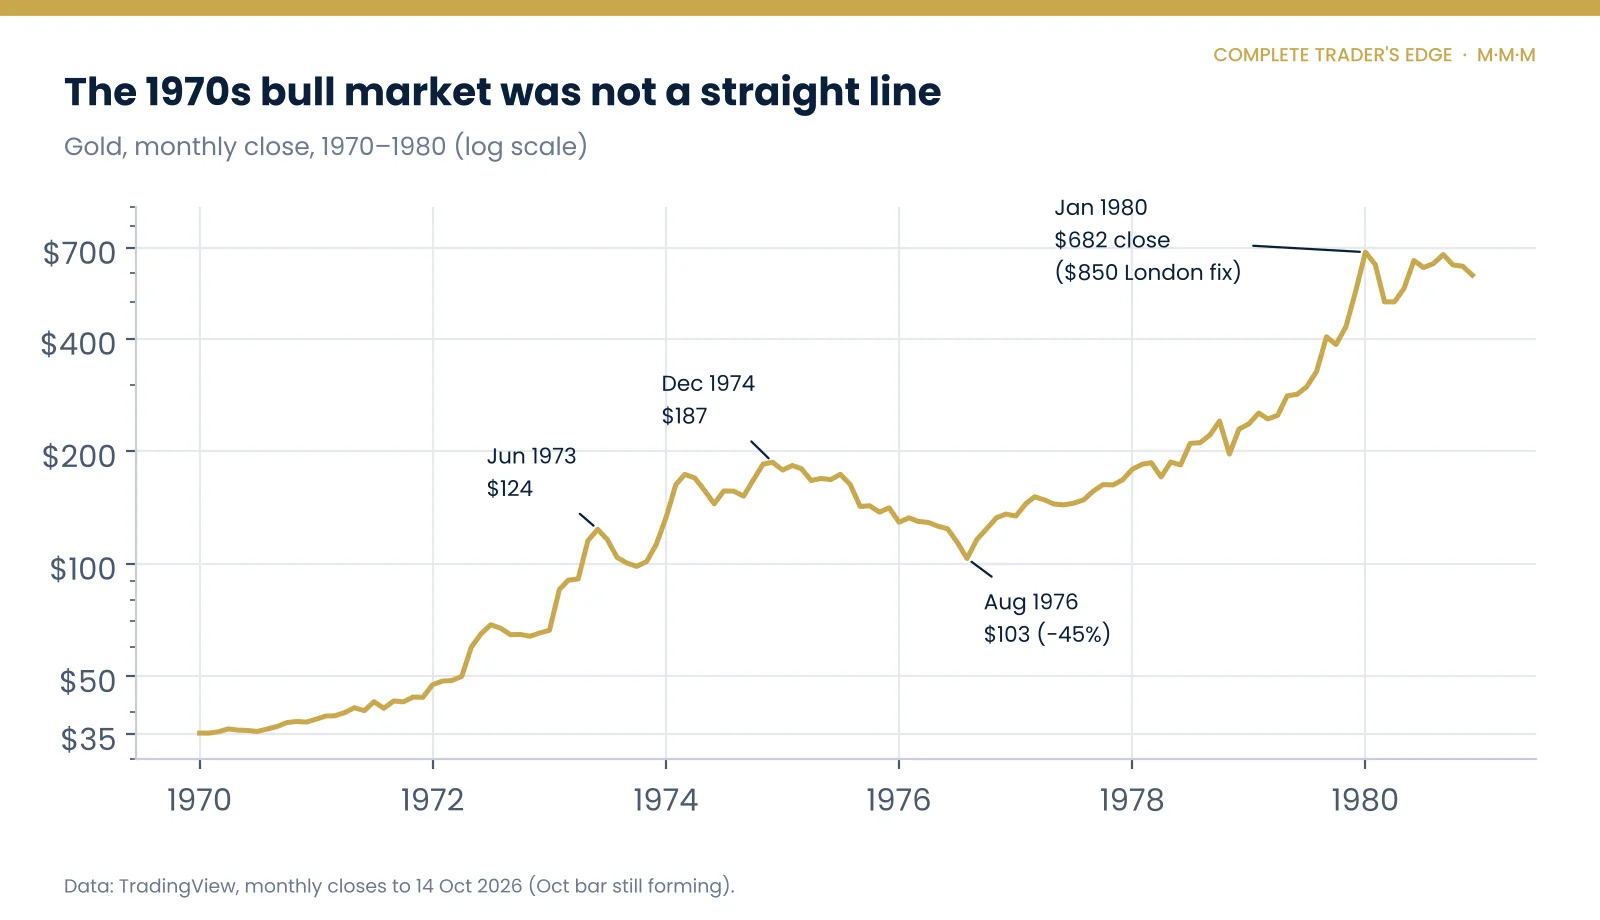
Phase 3: the bear market. Americans were allowed to own gold again from the end of 1974, and gold, which had run hard into that date, turned lower. It fell from $187 to $103 by August 1976, a 45% drawdown in the middle of what is now called a bull market. ASA lost 56%. Anyone who bought the miners in late 1973 because the ratio looked strong was down heavily in absolute terms within three years.
Phase 4: the blow-off. From the 1976 low gold rose more than six-fold to a January 1980 monthly close of $681.50, briefly fixing at $850 in London on 21 January. Silver did even better as the Hunt brothers’ corner pushed it towards $50 intramonth. This is the part of the decade everyone remembers. Look at the last column, though: even in the blow-off, miners priced in oil only rose 34%, because the Iranian revolution doubled oil again in 1979.
Phase 5: the bust. Paul Volcker’s Fed broke inflation with double-digit interest rates. Silver lost 83%, gold more than half. The cycle that began with the closing of the gold window ended with the most aggressive monetary tightening in modern American history.
The 1970s scorecard: metals beat miners
Take the whole decade and the ranking is clear. From December 1969 to the January 1980 peak, the metals left everything else behind.
| Asset | Dec 1969 | Jan 1980 | Change | Peak monthly close |
|---|---|---|---|---|
| Gold | $35.19 | $681.50 | +1,837% | $681.50 (Jan 1980) |
| Silver | $1.83 | $34.00 | +1,756% | $35.20 (Feb 1980) |
| WTI crude | $3.35 | $32.50 | +870% | $39.50 (Apr 1980) |
| ASA (gold miners) | $2.29 | $17.25 | +653% | $28.42 (Sep 1980) |
Split-adjusted share prices, excluding dividends. Many published figures quote gold at “+2,300%” for the decade; that uses the $850 intraday fix rather than a monthly close.
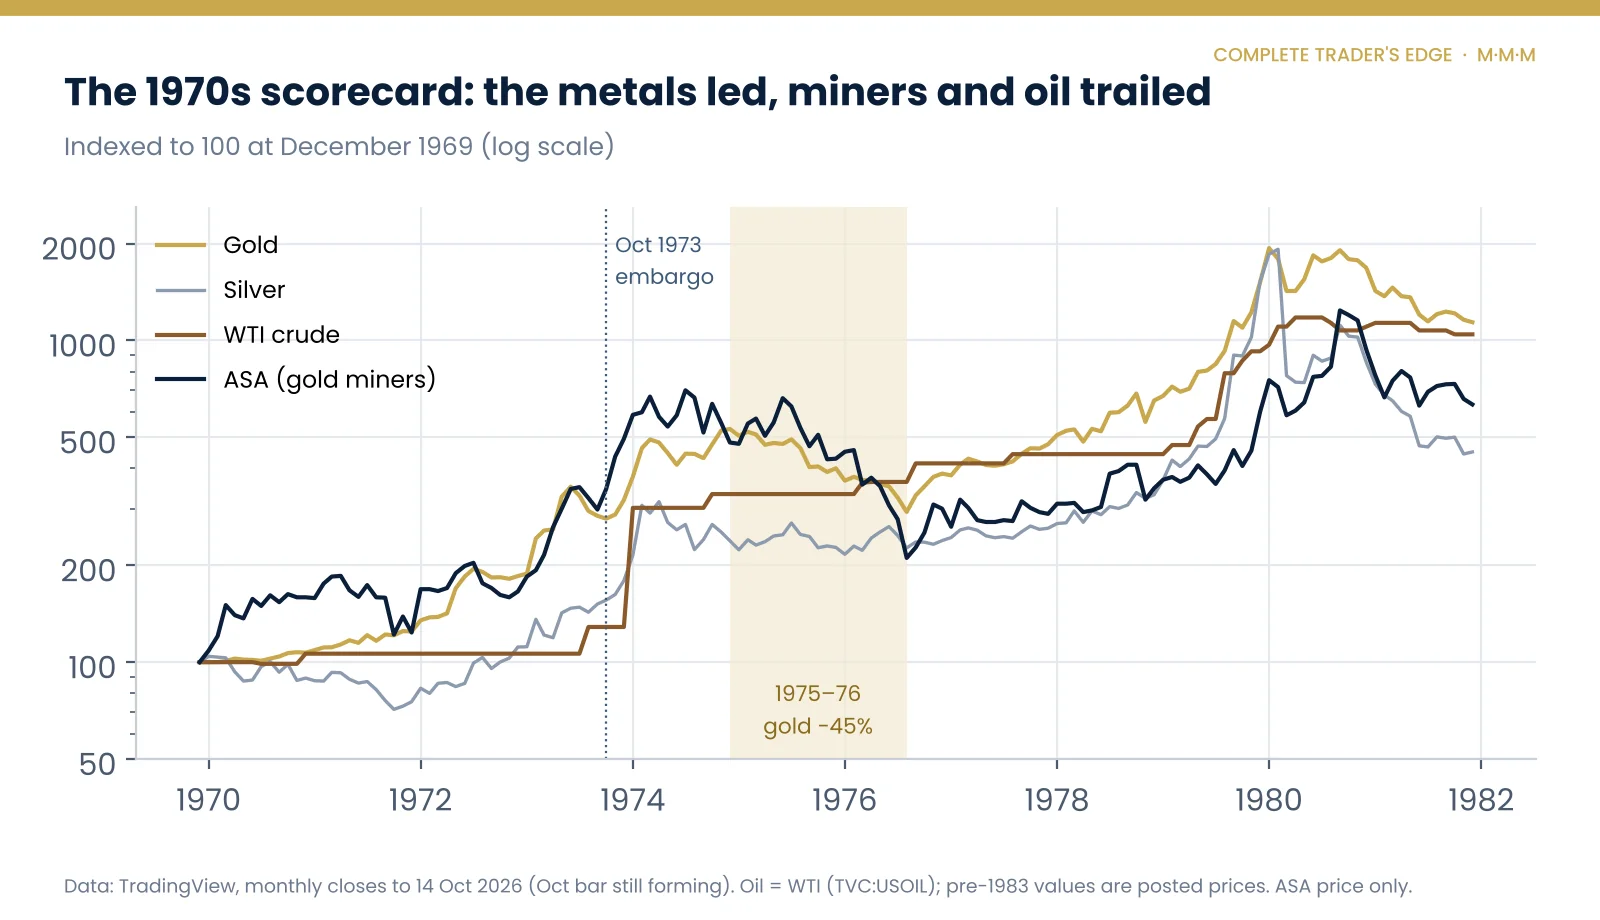
Miners still delivered a large absolute return. A nearly eight-fold gain in ten years is a life-changing number. But a gold miner is supposed to be leveraged to gold, and through the 1970s it was the other way round: the metal outran the companies digging it. Rising costs, energy above all, ate into that leverage.
The uncomfortable part: miners never got back above oil
This is the chart we think matters most, and the one missing from most of the discussion. We lined up the two peaks in miners priced in oil, December 1973 and February 2026, and tracked what happened next.
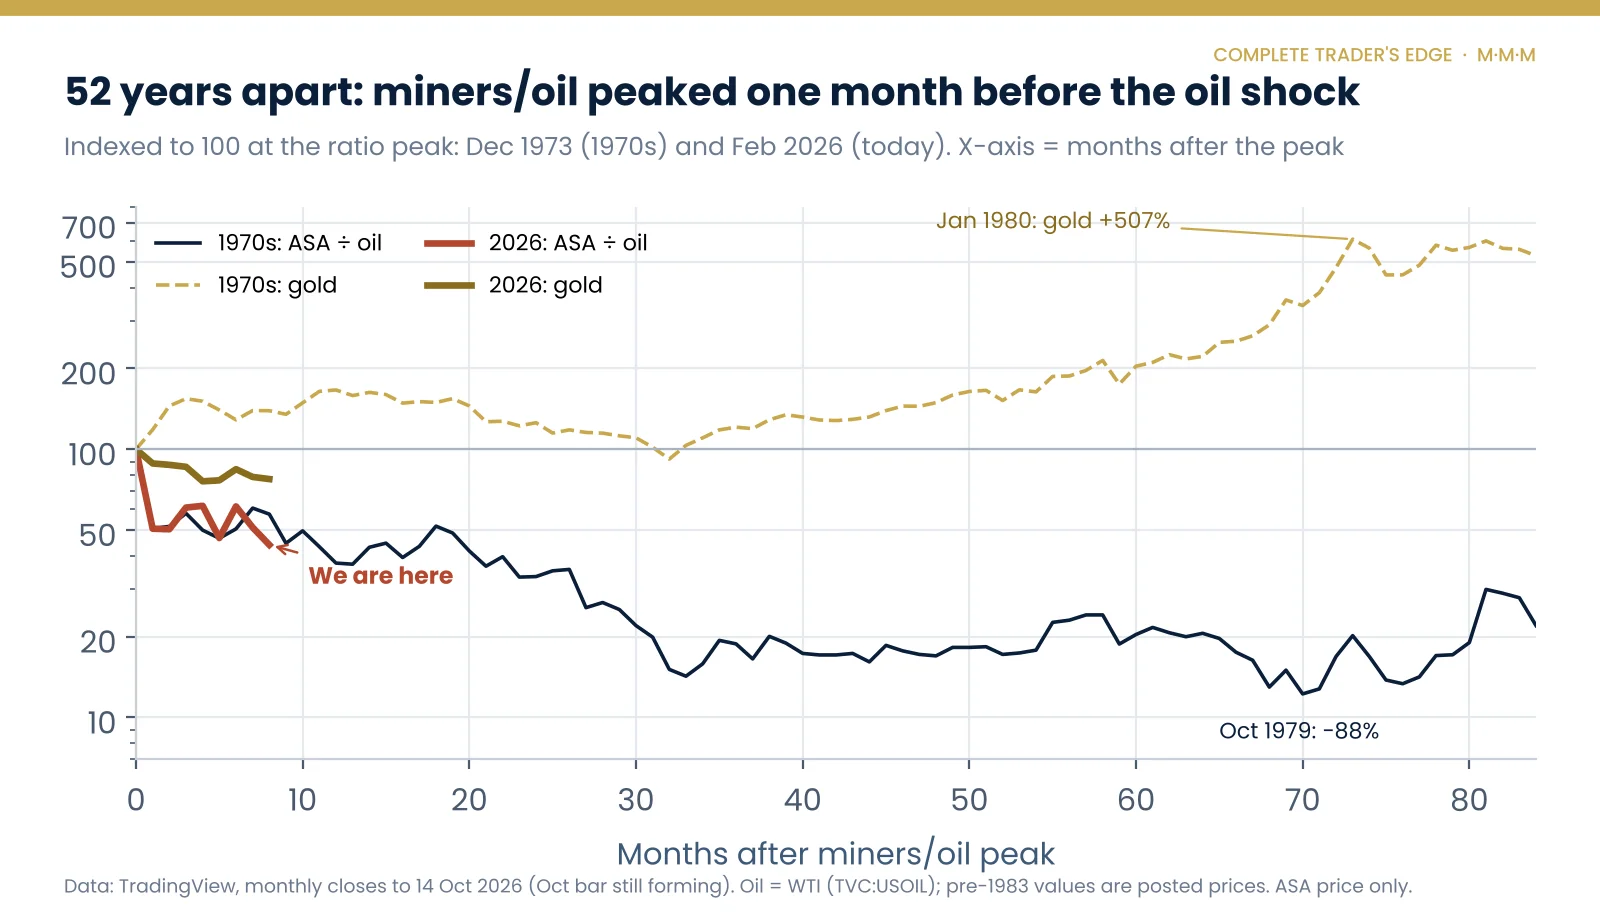
The first month is almost eerily similar. Miners priced in oil fell 49% from December 1973 to January 1974. They fell 49% again from February to March 2026. In both cases war in the Middle East had just sent oil sharply higher.
After that, the 1970s path is not the bullish story people expect. The ratio kept falling. By October 1979 it was 88% below its December 1973 peak. Even at the decade’s high in 1980 it was still below its 1973 level, and as our first chart shows, it did not reclaim even the July 1975 reading until February 2026.
Meanwhile gold, priced in dollars, rose 507% from December 1973 to January 1980. Silver rose 935%. ASA rose just 52% in price while oil rose 654%.
So what did happen next last time?
The metals had one of the great runs of the century. Miners priced in oil collapsed and stayed down for half a century. Both statements are true at the same time, and the second one is the part of the analog that is easy to miss if you only remember the 1980 gold chart.
1973 and 2026, side by side
The parallels are striking enough to take seriously. So are the differences.
| 1973–74 | 2026 | |
|---|---|---|
| Trigger | Yom Kippur War, Arab oil embargo (Oct 1973) | Iran war, tanker traffic through Hormuz nearly halted (Mar 2026) |
| Miners ÷ oil peak | Dec 1973: 2.63 (all-time high in this data) | Feb 2026: 1.21 (highest since Jul 1975) |
| First month after | −49% | −49% |
| Oil, first month | +135% ($4.31 to $10.11 posted) | +51% ($67.28 to $101.55) |
| Gold, 8 months later | +39% | −23% |
| Silver, 8 months later | +25% | −41% |
| Miners ÷ oil, 8 months later | −43% | −56% |
| Backdrop | Dollar newly cut loose from gold; inflation accelerating | Gold up about 2.5 times in two years; Fed still hiking, long yields near 20-year highs |
The single biggest difference is in the gold row. In 1974 gold kept rising through the oil shock and only broke down a year later. In 2026 gold peaked first. It hit an intraday record of about $5,595 on 29 January, then fell 9% in a day when Kevin Warsh was named the next Federal Reserve chair (VanEck). At $4,086 it is now 27% below that high. Silver, which traded above $120 intramonth in January, is down more than half.
One reading is that 2026 is running the 1970s script out of order: the oil shock and the precious-metals correction arriving together, rather than a year apart. If so, the 1975–76 equivalent may be the period we are in now, not a period still to come. The other reading is that the analog has already broken. We cannot tell you which, and neither can anyone else with confidence.
Expensive against oil, cheap against gold
There is one more ratio that complicates the simple story, and it points the other way.
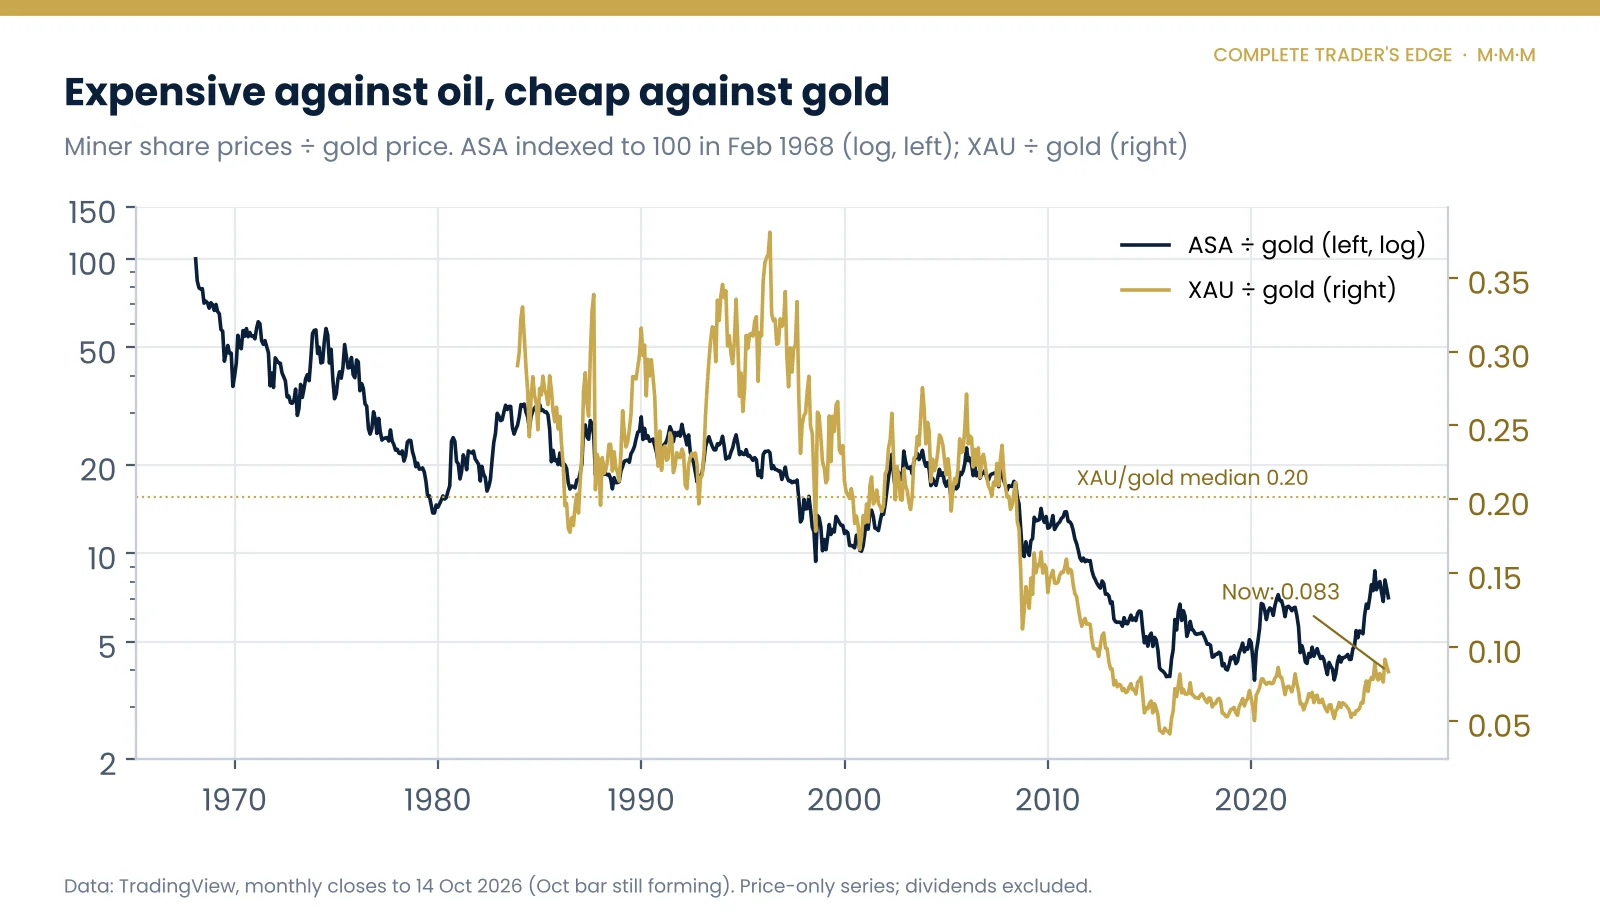
Priced in gold rather than oil, miners are still near multi-decade lows. The XAU index is worth 0.083 times the gold price today, against a long-run median of 0.20. ASA relative to gold sits in the bottom quarter of its 58-year history. The GDX ratio is close to its median, the one exception.
So the same companies can be described two ways. Against oil, they had their best stretch in fifty years. Against gold, they are still deep in a slump that has run since the late 2000s. A bull who says “miners are cheap” and a bear who says “miners are expensive” can both be reading real data. The question is which input cost matters more over the next few years.
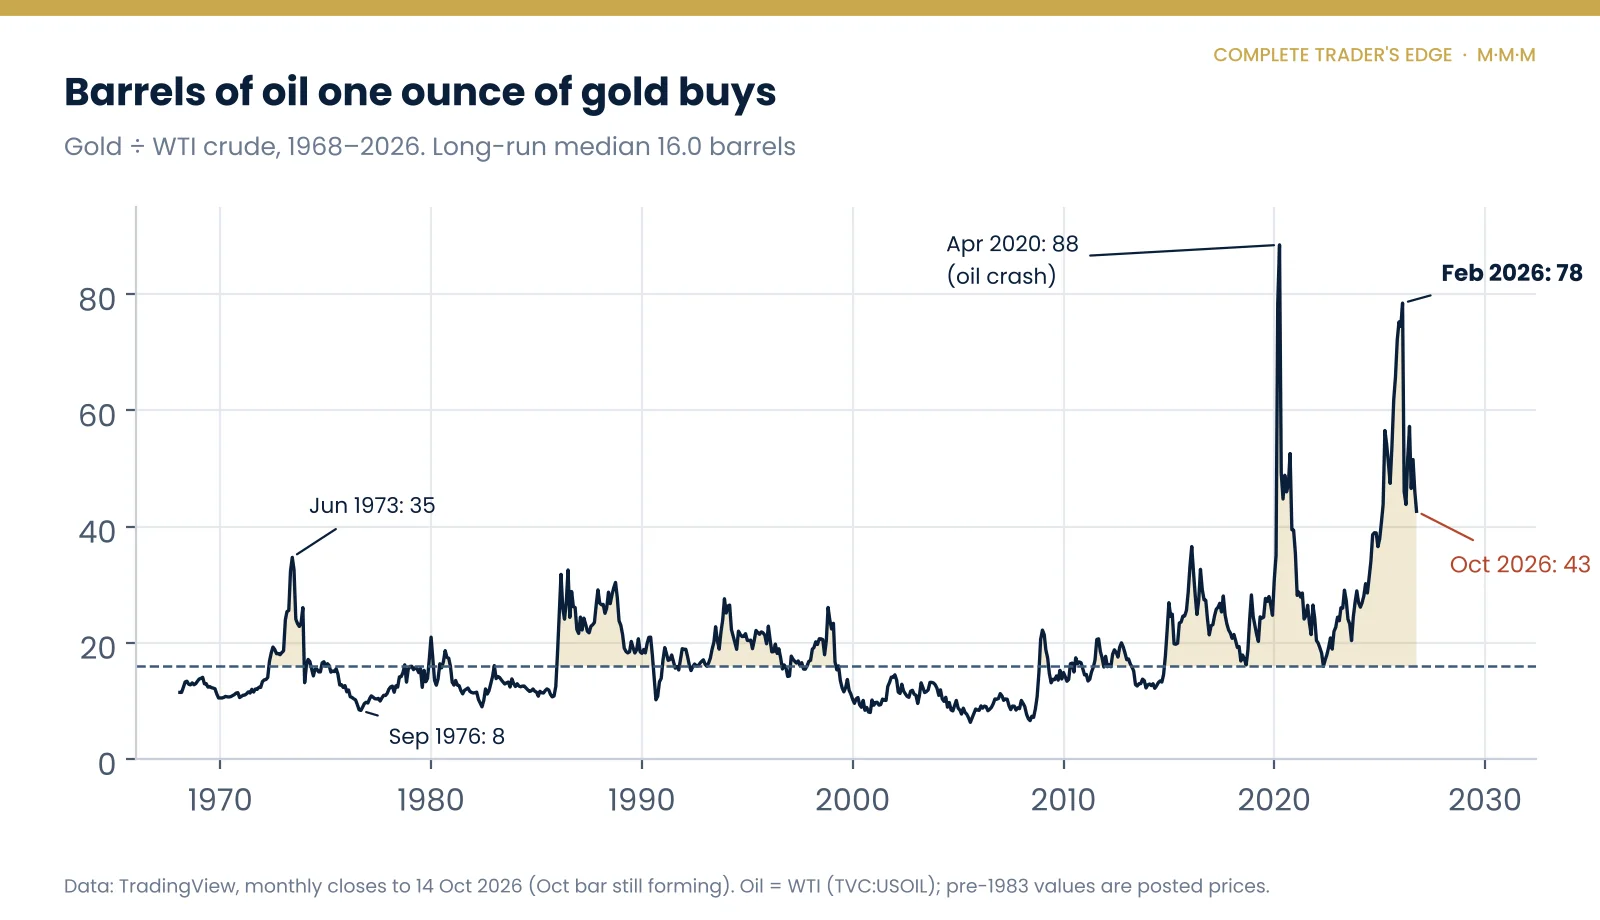
The gold-to-oil ratio makes the same point from the metal’s side. Even after this year’s oil spike, an ounce of gold buys 43 barrels, more than two and a half times its long-run median. In 1973 the ratio peaked at 35 in June and had been cut to 8 by September 1976. If oil stays near $100 and gold drifts, mean reversion in this ratio does not require gold to crash. It only requires the two to keep doing roughly what they are doing.
Where the analog could break
Any honest use of a fifty-year analog needs a list of reasons it may not apply. Here is ours.
The oil price meant something different. Before 1983 the WTI series is a posted price, set rather than traded. The 1973 jump was a policy decision as much as a market move. A modern oil spike can reverse in weeks; oil has already traded back to $70 in June before climbing again.
Miners are different companies. ASA in the 1970s was a fund of deep, labour-intensive South African mines. Today’s large producers operate globally, some hedge part of their fuel costs, and the cost base has changed. Energy matters less to some of them than it did to a Witwatersrand gold mine in 1974.
Mining stocks have their own risks. Dilution, cost blow-outs, political risk and capital spending decisions do not show up in a ratio chart. ASA’s South African concentration carried political risk through the 1980s that no gold or oil chart captures.
The monetary backdrop is not a copy. The 1970s gold bull began with the end of dollar convertibility and deeply negative real interest rates. In 2026 the Fed is still raising rates and long Treasury yields are near their highest in two decades, a backdrop we covered in detail in our Treasury yield breakout piece. That is closer to the 1980 ending than the 1973 beginning.
One episode is not a sample. We are comparing two data points. An analog can illustrate a mechanism. It cannot give you a probability.
Price-only data understates the miners. ASA, XAU and GDX here are price series and exclude dividends. Over decades that matters, and it makes the miners look somewhat worse against the metals than a total-return comparison would.
What it means for traders: Mind, Method, Money
Mind. A chart with “last seen in the 1970s” on it is designed to make you think of January 1980. Remember that the same decade contained a 45% drawdown in gold and an 88% collapse in miners priced in oil. If you had owned the 1970s through those stretches, would you have held? Be honest about which phase you think you are in, and what you would do if you are wrong about it.
Method. Use the ratio as context, not a trigger. The data says the miners-to-oil extreme marked the top of the ratio in both 1973 and 2026, not the top in gold. If you trade gold or silver directly, as we do, the actionable levels are on the metal’s own chart. If you want exposure through futures, our guide to trading futures covers contract sizes and margin before you take a position. A pairs trade, long miners against short oil or the reverse, is a spread with two sources of volatility, and needs its own invalidation level.
Money. Gold is 27% off its high and silver has halved. Volatility in precious metals is running at levels that will stop out normal position sizes on noise. Size from your stop distance, not from conviction, and run the numbers on the position size and drawdown calculators before you add exposure. One per cent of the account at risk per idea is a ceiling, not a target.
The signposts we are watching
Oil. The 1970s analog depends on energy staying expensive. A lasting easing of Gulf supply risk and WTI back towards $60 would undercut the cost squeeze that crushed miner margins in 1974 and turn the ratio back up.
Gold’s reaction to the next oil spike. In 1974 gold rose with oil. If gold starts rising alongside crude again, the 2026 sequence is converging with the 1970s one. If it keeps falling when oil rises, it is not.
Miners against gold. A sustained rise in XAU relative to gold from today’s depressed levels would tell us the market is starting to price margins recovering. That would be the clearest sign that miners, rather than just the metals, have their own leg ahead.
Real interest rates and the Fed. The 1970s gold bull ended when real rates went decisively positive. A Fed that keeps hiking into an oil shock looks more like 1980 than 1974.
Last time miners got this expensive against oil, the metals went on to make history.
The miners, measured against oil, took fifty years to get back.
Go deeper
For 5,000 years of gold as money and as a market, read The History of Gold. For the other side of the ratio, from the 1973 embargo and the 1979 shock to the Strait of Hormuz, see The History of Oil.
This article is educational and is not investment advice. All price data: TradingView monthly closes (TVC:GOLD, TVC:SILVER, TVC:USOIL, NYSE:ASA, NASDAQ:XAU, AMEX:GDX) to 14 October 2026; the October 2026 bar was still forming. Pre-1983 oil prices are WTI posted prices. Share prices are split-adjusted and exclude dividends. Oil price and Strait of Hormuz context: All India Radio News, 9 March 2026. The ratio analysis, analog and conclusions are The Complete Trader’s Edge’s own.
 The Complete Trader's Edge
The full Mind · Method · Money framework. 70 chapters.
View on Amazon →
 Market Mayhem
400 years of bubbles, crashes, and the pattern that keeps repeating.
Buy on Amazon →
 Greatest Companies
How the world's greatest companies were built — and what traders learn from them.
View on Amazon →
 Greatest Traders
Eighty-six lives that explain the markets — Livermore to Madoff, told with the losses left in.
View on Amazon →