One of the clearest markers of an amateur versus a professional trader is whether they trade from a single timeframe or from a structured multi-timeframe analysis. Looking at only one timeframe is like navigating a city with only a street-level map. You can see your immediate surroundings but have no idea of the wider context. A bullish setup on the 15-minute chart could be a pullback entry in a daily uptrend, or it could be a dead cat bounce inside a daily downtrend. The outcome probability is radically different. Only multi-timeframe analysis tells you which one you are looking at.
The Timeframe Hierarchy: Top-Down Analysis
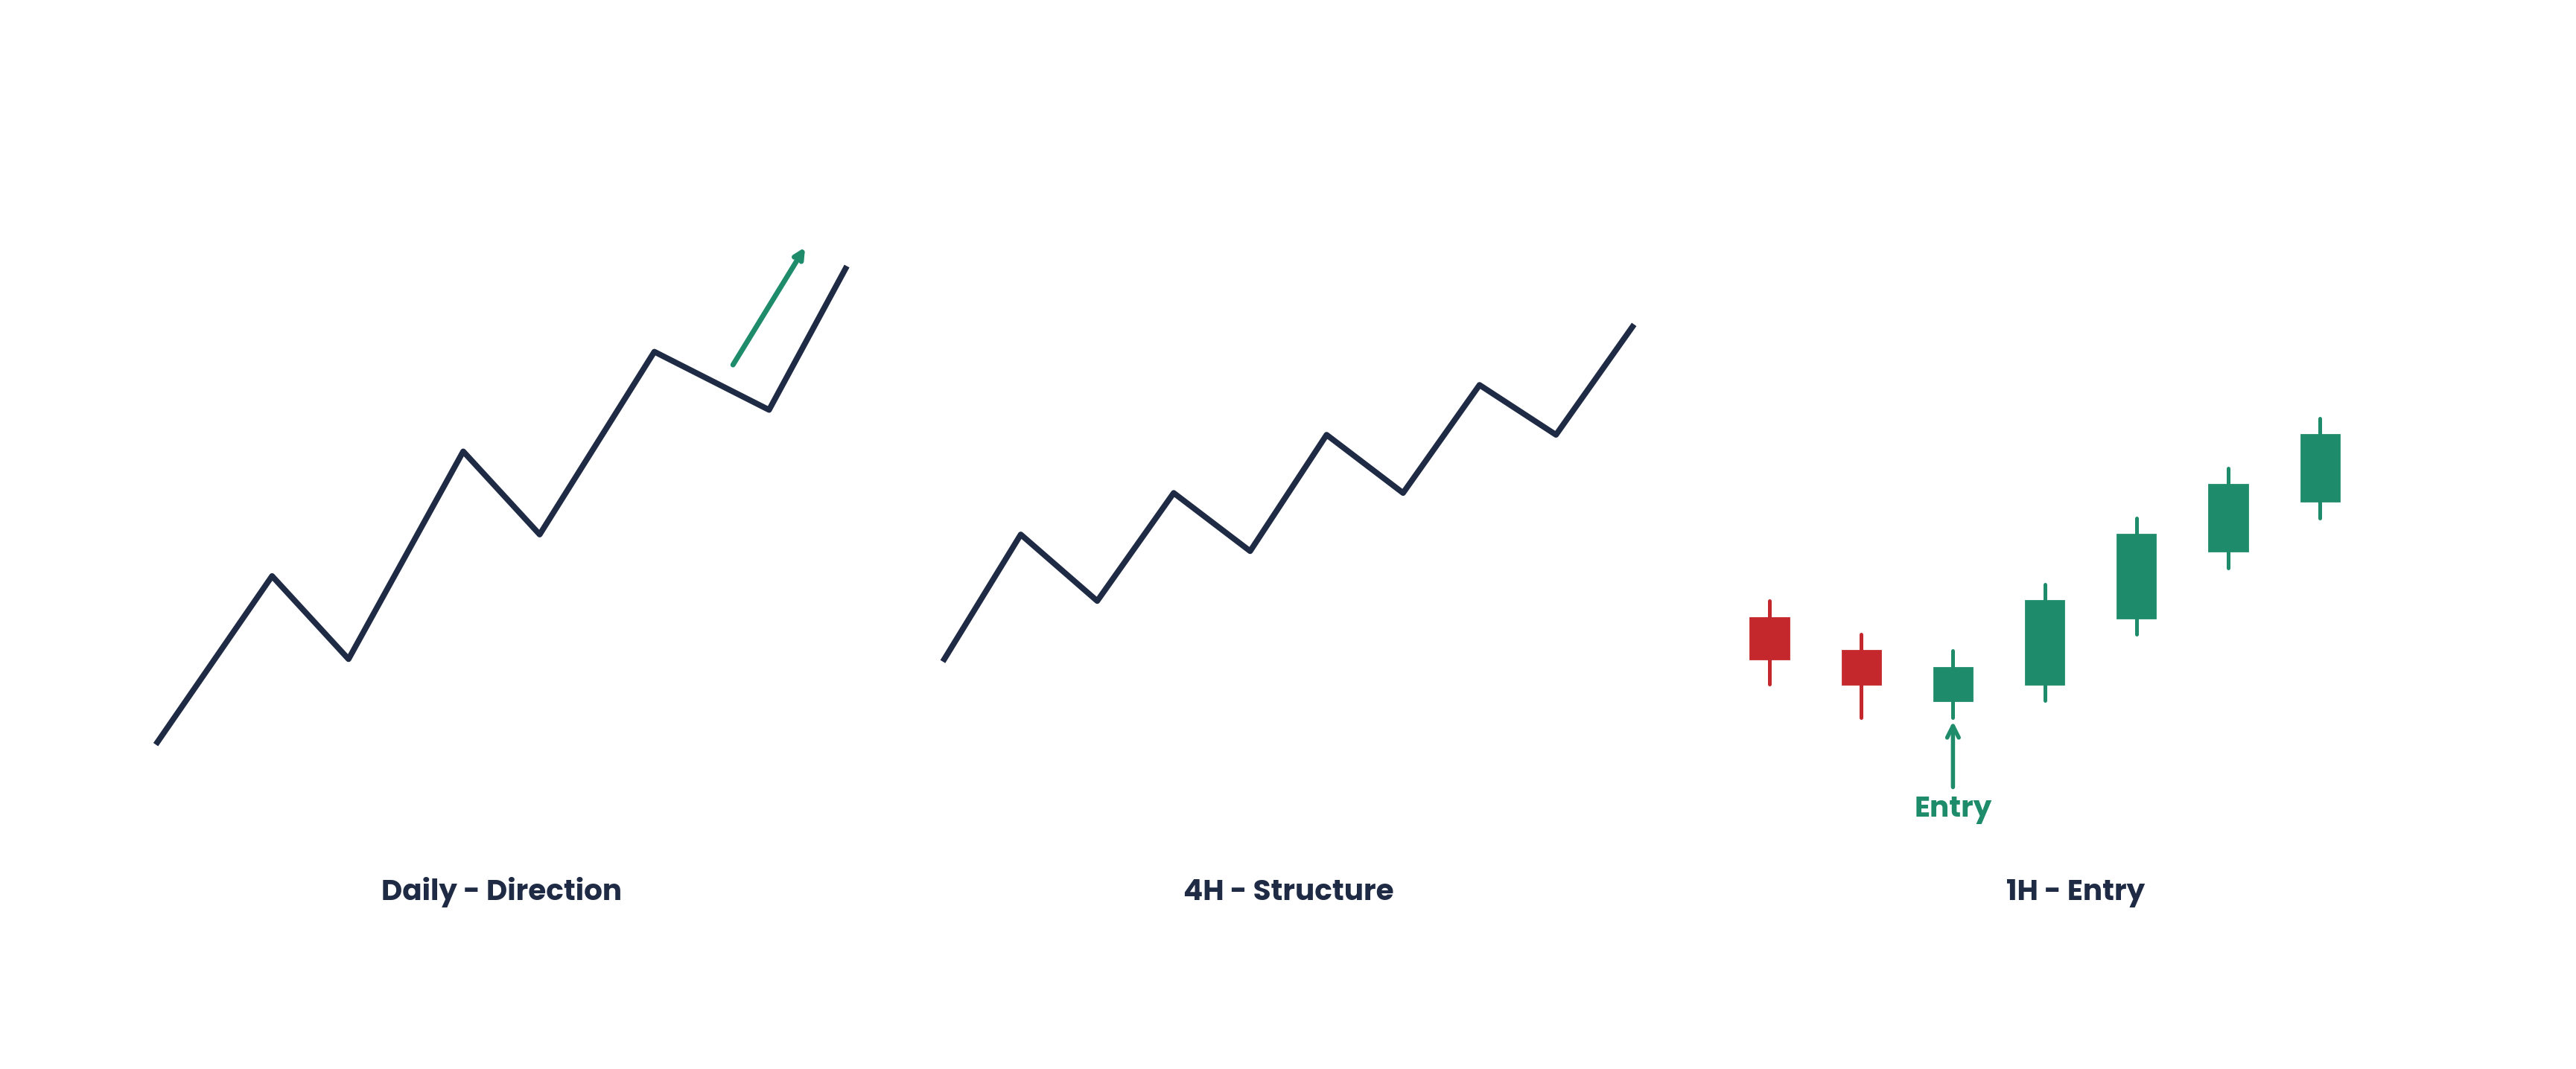
Multi-timeframe analysis uses a top-down approach. Each timeframe serves a specific purpose in the decision chain.
Higher timeframe (HTF): Establishes directional bias. What is the dominant market structure? Bullish, bearish, or ranging? Where are the key structural levels, the swing highs and lows that define the trend? This is the “north star” that governs every decision below it.
Intermediate timeframe: Identifies the specific zones of interest where trade setups might form. Order Blocks, Fair Value Gaps, Fibonacci levels, and Volume Profile zones are marked here. This is where you identify where you want to trade.
Lower timeframe (LTF): Refines entry timing and places precise stops. When price reaches a zone you identified on the intermediate timeframe, the LTF tells you when to enter: a confirmation candle, a Break of Structure, a Change of Character. This is where you identify when to trade.
| Trading Style | HTF (Bias) | Intermediate (Zones) | LTF (Entry) |
|---|---|---|---|
| Swing trader | Weekly | Daily | 4-Hour |
| Day trader (standard) | Daily | 4-Hour | 1-Hour / 15-Min |
| Day trader (ICT approach) | Daily + 4-Hour | 1-Hour | 15-Min / 5-Min |
| Scalper | 1-Hour | 15-Min | 5-Min / 1-Min |
The blended approach taught in The Complete Trader’s Edge uses the Daily and 4-Hour for HTF bias, the 1-Hour for zone identification, and the 15-Minute for entry timing. This combination provides enough macro context for directional confidence while offering enough precision for tight entries with excellent risk-to-reward.
The Power of Confluence: When Timeframes Agree
The highest-probability trades occur when multiple timeframes align. Here is what perfect alignment looks like:
The daily chart shows a clear uptrend (higher highs, higher lows). The 4-hour chart shows price pulling back from the most recent higher high toward a key demand zone (an Order Block that aligns with the 0.618 Fibonacci retracement). The 1-hour chart shows a bullish Change of Character within that demand zone during the New York Kill Zone. All three timeframes are pointing in the same direction. The higher timeframe provides the trend, the intermediate provides the level, and the lower timeframe provides the timing. This is confluence, and it dramatically increases trade quality.
Contrast this with a conflicting signal: the 15-minute chart shows a bullish engulfing at a minor support level, but the daily chart is in a clear downtrend. The 15-minute signal has low probability because the dominant force (daily trend) is working against it. The setup might produce an occasional win, but over 100 trades the negative expectancy of fighting the higher timeframe will be devastating.
The Cardinal Rule: Never Trade Against the HTF
This is the single most important rule in multi-timeframe analysis and the one most frequently violated by developing traders. If the daily structure is bearish, do not look for long setups on any lower timeframe. If the daily structure is bullish, do not look for shorts.
The exception is a genuine Change of Character (ChoCH) on the intermediate timeframe that signals a potential higher timeframe reversal. In this case, the intermediate timeframe is providing early evidence that the HTF trend may be changing. Even then, the correct approach is to reduce size and treat the trade as a higher-risk opportunity, not a standard trend-following entry.
Practical Application: The Daily Pre-Session Workflow
Here is the exact workflow for applying multi-timeframe analysis in your daily trading routine:
Step 1 (2 minutes): Daily chart. Identify the current market structure. Mark the most recent swing high and swing low. Determine bias: bullish, bearish, or ranging. Note any key levels: previous day high/low, major Order Blocks, and the weekly open.
Step 2 (3 minutes): 4-Hour chart. Refine the daily bias. Identify where price is within the daily structure. Mark the 4-Hour Order Blocks, FVGs, and Fibonacci levels that align with the daily direction. These become your trade zones for the session.
Step 3 (2 minutes): 1-Hour chart. Review the most recent 1-Hour price action. Is price approaching any of the zones you marked? Is the 1-Hour structure aligned with or against the daily bias? Write your if-then scenarios: “If price reaches [zone] and I see [confirmation], I will enter [direction] with [size] and [stop].”
Step 4 (during session): 15-Minute chart. When price reaches one of your pre-identified zones, watch the 15-minute for your entry trigger. A ChoCH, a bullish/bearish engulfing, a Break of Structure back in the HTF direction. Enter when the trigger fires. Not before.
This entire pre-session analysis takes 7 to 10 minutes. It prevents the mistake of starting your analysis on the 15-minute chart, getting excited about a pattern, and entering a trade that fights the daily trend.
Key Lessons
- Multi-timeframe analysis is a core separator between amateur and professional traders.
- Use a top-down approach: higher timeframe for bias, intermediate for zones, lower for entry timing.
- Confluence across timeframes dramatically increases trade probability.
- Never trade against clear higher timeframe structure. The odds are against you.
- The pre-session workflow takes 7 to 10 minutes and prevents the majority of bad trades caused by single-timeframe analysis.
Frequently Asked Questions
How many timeframes should I look at?
Three is the standard. More than three creates information overload and conflicting signals. Less than two leaves you without context. The three-timeframe hierarchy (HTF for bias, intermediate for zones, LTF for entry) is used by most professional traders because it provides sufficient context without excessive complexity.
What if the intermediate timeframe disagrees with the higher timeframe?
The higher timeframe wins. If the daily is bullish and the 4-hour is showing a pullback, the 4-hour is providing the entry opportunity within the daily trend. If the daily is bullish and the 4-hour shows a complete Break of Structure to the downside, the conflict is more serious. In this case, the safest approach is to wait until the timeframes realign before trading. Conflicting timeframes = no trade.
Should I analyse multiple instruments on multiple timeframes?
Start with one instrument across three timeframes. Once that analysis is habitual (typically 30 to 60 days of daily practice), add a second instrument. Most professional day traders actively trade 2 to 3 instruments. More than that splits attention and degrades analysis quality. For intermarket analysis (DXY, bonds, correlations), you may monitor additional instruments for context without actively trading them.
Can I skip the higher timeframe analysis if I am only scalping?
No. Even scalpers benefit from knowing the daily and 4-hour direction. A scalper who only takes long scalps when the daily is bullish and short scalps when the daily is bearish will have a significantly higher win rate than one who trades both directions regardless of context. The HTF analysis takes 2 minutes and eliminates a large category of low-probability trades.
How does multi-timeframe analysis work with ICT concepts?
ICT concepts are inherently multi-timeframe. Order Blocks marked on the daily chart are more significant than those on the 15-minute. Fair Value Gaps from the 4-hour are more likely to be filled than those from the 5-minute. Liquidity targets identified on the daily (equal highs, equal lows, previous day extremes) are the most significant. The multi-timeframe hierarchy provides the framework within which all ICT tools are applied.
Continue Reading
▶ Multi-Timeframe Analysis: The Professional’s Complete Framework
▶ Market Structure: The Complete Guide
From The Book
This article covers concepts from Chapter 23 of The Complete Trader’s Edge.
 The Complete Trader's Edge
The full Mind · Method · Money framework. 70 chapters.
View on Amazon →
The Complete Trader's Edge
The full Mind · Method · Money framework. 70 chapters.
View on Amazon →
 Market Mayhem
400 years of bubbles, crashes, and the pattern that keeps repeating.
Buy on Amazon →
Market Mayhem
400 years of bubbles, crashes, and the pattern that keeps repeating.
Buy on Amazon →