

The ADX is the indicator that answers a question most traders forget to ask: not which way is the market going, but is it going anywhere at all? Most tools try to call direction. The ADX measures something more fundamental – the strength of a trend, regardless of whether it is up or down. Used correctly, it stops you from applying trend strategies to a dead, choppy market, which is one of the most common and expensive mistakes a trader can make.
This guide covers what the ADX measures, why it says nothing about direction, the key thresholds, and how to use it as a filter that keeps you out of the wrong trades.
What the ADX Is
The Average Directional Index, developed by Welles Wilder, measures trend strength on a scale of 0 to 100. It usually appears with two companion lines: the +DI (positive directional indicator) and −DI (negative directional indicator). The +DI and −DI show direction – which side is winning – while the ADX line itself shows only how strong that directional movement is. A high ADX means a strong trend; a low ADX means a weak or absent one.
Strength, Not Direction
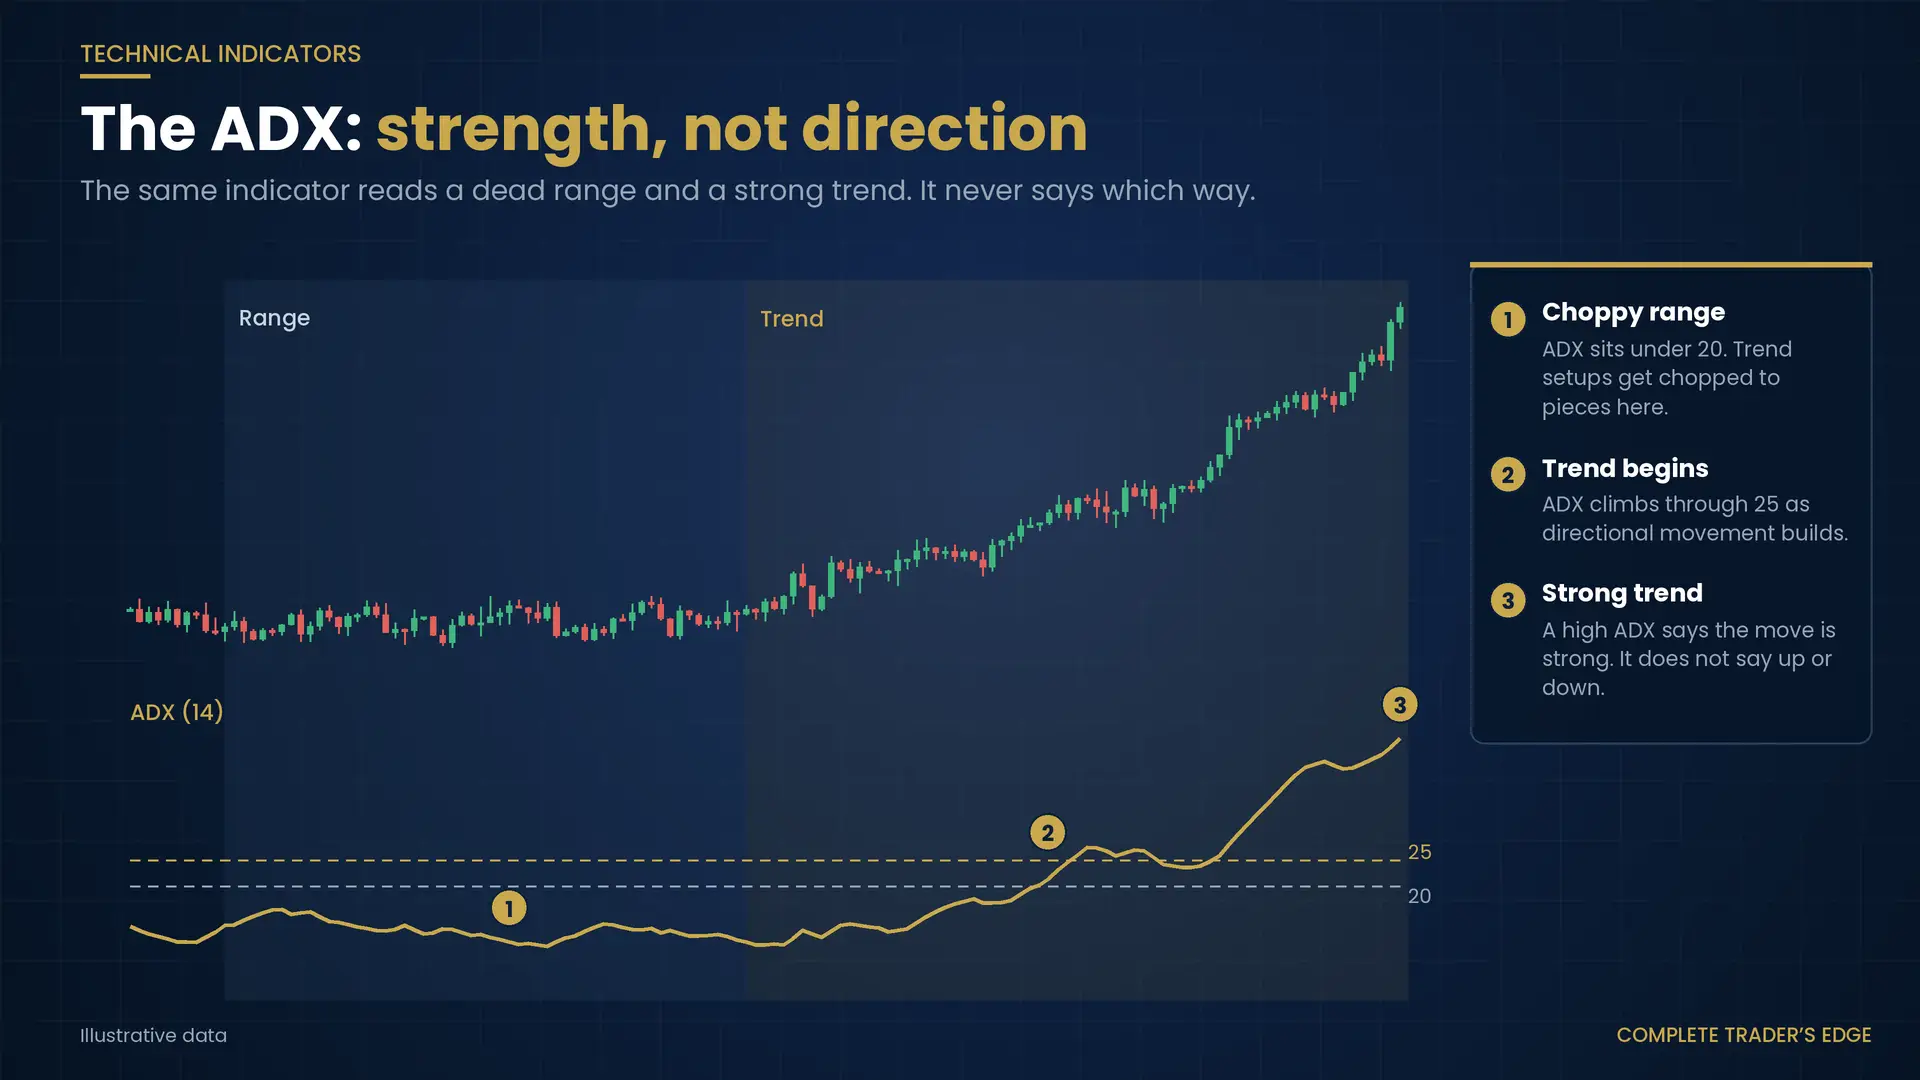
This is the point everyone misses: the ADX line is directionless. An ADX of 40 can occur in a powerful uptrend or a powerful downtrend – it only tells you the move is strong, not which way it is going. For direction, you read the +DI and −DI (or better, you read market structure directly). Confusing ADX strength with direction leads traders to buy simply because “ADX is high,” which is meaningless without knowing the trend’s direction first.
The commonly used thresholds are simple. An ADX below 20 signals a weak, ranging, or choppy market. Above 25 signals a genuine trend is in place. Rising ADX means the trend is strengthening; falling ADX means it is fading, even if price is still drifting in the same direction.
How to Use It Properly
As a regime filter. This is the ADX’s best use. When ADX is above 25, the market is trending, and trend-following approaches – trading pullbacks, riding breakouts – are in their element. When ADX is below 20, the market is ranging, trend trades will get chopped up, and you should either stand aside or switch to range tactics like fading the edges. The ADX tells you which game the market is playing.
To avoid the chop. Most account damage in sideways markets comes from traders forcing trend setups into conditions that cannot support them. A quick glance at a low ADX is often enough to say “not today” – and that discipline alone can transform a results curve.
As confirmation of a breakout. A breakout accompanied by a rising ADX has real momentum behind it. A breakout with a flat, low ADX is more likely to be a false move that fades back into the range.
Match the strategy to the regime. The ADX’s real gift is telling you when to trade trends and when to leave the trend playbook in the drawer. Knowing when not to trade is worth as much as any entry signal.
The Limitations to Respect
The ADX is heavily smoothed, which makes it lag – it confirms a trend that is already underway rather than predicting one, and it is slow to react when a trend turns. It says nothing about direction on its own, and a high reading late in a move can coincide with exhaustion rather than opportunity. Treat it as a background gauge of conditions, and let price, structure, and the trend itself drive your actual entries.
Key Takeaways
- The ADX measures trend strength (0–100), not direction; +DI and −DI show direction.
- Below 20 = weak/ranging; above 25 = trending; rising ADX = strengthening.
- Its best use is as a regime filter: trend tactics when high, range tactics or stand aside when low.
- It keeps you out of the chop – knowing when not to trade is half the value.
- It lags and is directionless; price and structure lead.
Frequently Asked Questions
Does a high ADX mean I should buy?
No – the ADX is directionless. A high reading means the trend is strong, but it does not tell you whether that trend is up or down. You get direction from the +DI and −DI lines or, better, from reading market structure directly. Use the ADX to confirm that a trend exists, then take direction from price.
What ADX level signals a strong trend?
The common convention is that a reading above 25 indicates a genuine trend, while below 20 indicates a weak or ranging market. A rising ADX shows the trend is gaining strength, and a falling ADX shows it is fading. These are guidelines for filtering conditions, not precise entry triggers.
The ADX is covered alongside the core tools in our guide to trading indicators and when they actually help.
Learn where indicators fit within a structure-first method using the Mind · Method · Money framework in The Complete Trader’s Edge by Louw van Riet.
 The Complete Trader's Edge
The full Mind · Method · Money framework. 70 chapters.
View on Amazon →
 Market Mayhem
400 years of bubbles, crashes, and the pattern that keeps repeating.
Buy on Amazon →
 Greatest Companies
How the world's greatest companies were built — and what traders learn from them.
View on Amazon →
 Greatest Traders
Eighty-six lives that explain the markets — Livermore to Madoff, told with the losses left in.
View on Amazon →