

The stochastic oscillator is where a lot of new traders learn a hard lesson about the word “overbought.” It flashes overbought, they short, and price keeps climbing for another twenty candles. The stochastic is not broken and they did nothing wrong with the settings – they simply misunderstood what the tool is telling them. Overbought does not mean sell. It means momentum is strong. Used as confirmation rather than a contrarian trigger, the stochastic earns its place; used to fade trends, it empties accounts.
This guide covers what the stochastic actually measures, why the overbought and oversold levels are a trap, and how to use it the right way.
What the Stochastic Oscillator Is
The stochastic measures where the current close sits relative to the high-low range over a chosen lookback period, on a scale of 0 to 100. If price is closing near the top of its recent range, the reading is high; near the bottom, low. It plots two lines: %K, the main line, and %D, a moving average of %K that acts as a signal line. Readings above 80 are labelled “overbought” and below 20 “oversold.”

Why Overbought and Oversold Are a Trap
Here is the mistake that costs traders money: they treat 80 as “sell” and 20 as “buy.” But in a strong trend, the stochastic can stay pinned in overbought or oversold for a very long time, because price keeps closing near the top (or bottom) of its range – that is what a trend is. A high stochastic reading in an uptrend is not a warning; it is confirmation that the trend is healthy and momentum is strong.
Overbought and oversold are only meaningful in a range, where price is oscillating between support and resistance. In a trend, they are actively misleading. Knowing which environment you are in – trending or ranging – is the difference between the stochastic helping you and hurting you, and that read comes from market structure, not the oscillator.
How to Use It Properly
As confirmation in a range. When price is clearly ranging between two levels, an oversold stochastic turning up at support, or an overbought one turning down at resistance, can confirm a reversal you already see on the chart. The key word is confirm – the level and the price rejection come first; the stochastic agrees.
Divergence. The stochastic’s most respected use is divergence – when price makes a higher high but the oscillator makes a lower high, momentum is weakening beneath the surface even as price pushes on. At a key level, that divergence is a genuine warning worth acting on with confirmation.
As a filter, not a trigger. Let the stochastic add weight to a decision made from structure and location. Never let it be the reason for the trade by itself.
Overbought means strong, not finished. The single most expensive habit with the stochastic is shorting “overbought” in an uptrend. Use it to confirm reversals in ranges and to spot divergence at levels – never to fade a healthy trend.
The Limitations to Respect
The stochastic is a lagging, derivative measure – it reacts to price rather than leading it – and it produces constant false signals in trending markets. It also whipsaws in choppy conditions, firing crossovers in both directions with no follow-through. Like every oscillator, it is a supporting instrument. The primary read is always price itself: where the trend is, where structure breaks, and where the levels sit.
Key Takeaways
- The stochastic shows where price closes within its recent range, via the %K and %D lines (0–100).
- “Overbought” and “oversold” only mean something in a range, not a trend.
- In a trend, a pinned overbought reading confirms strength – it is not a sell signal.
- Best uses: confirming reversals at levels in ranges, and spotting divergence.
- It lags and whipsaws – use it as a filter, never as a standalone trigger.
Frequently Asked Questions
Does overbought on the stochastic mean I should sell?
No. Overbought simply means price is closing near the top of its recent range, which is exactly what happens in a healthy uptrend. Selling every overbought reading in a trend is a fast way to lose. Overbought and oversold are only useful as reversal hints inside a clear range, confirmed by a level and a price rejection.
What is the difference between the stochastic and RSI?
Both are momentum oscillators scaled 0 to 100, but they calculate momentum differently: the stochastic compares the close to the recent high-low range, while RSI compares the size of recent gains to recent losses. They often agree, and both are best used for divergence and range confirmation rather than fading trends.
The stochastic is covered alongside the core tools in our guide to trading indicators and when they actually help.
Learn where indicators fit within a structure-first method using the Mind · Method · Money framework in The Complete Trader’s Edge by Louw van Riet.
 The Complete Trader's Edge
The full Mind · Method · Money framework. 70 chapters.
View on Amazon →
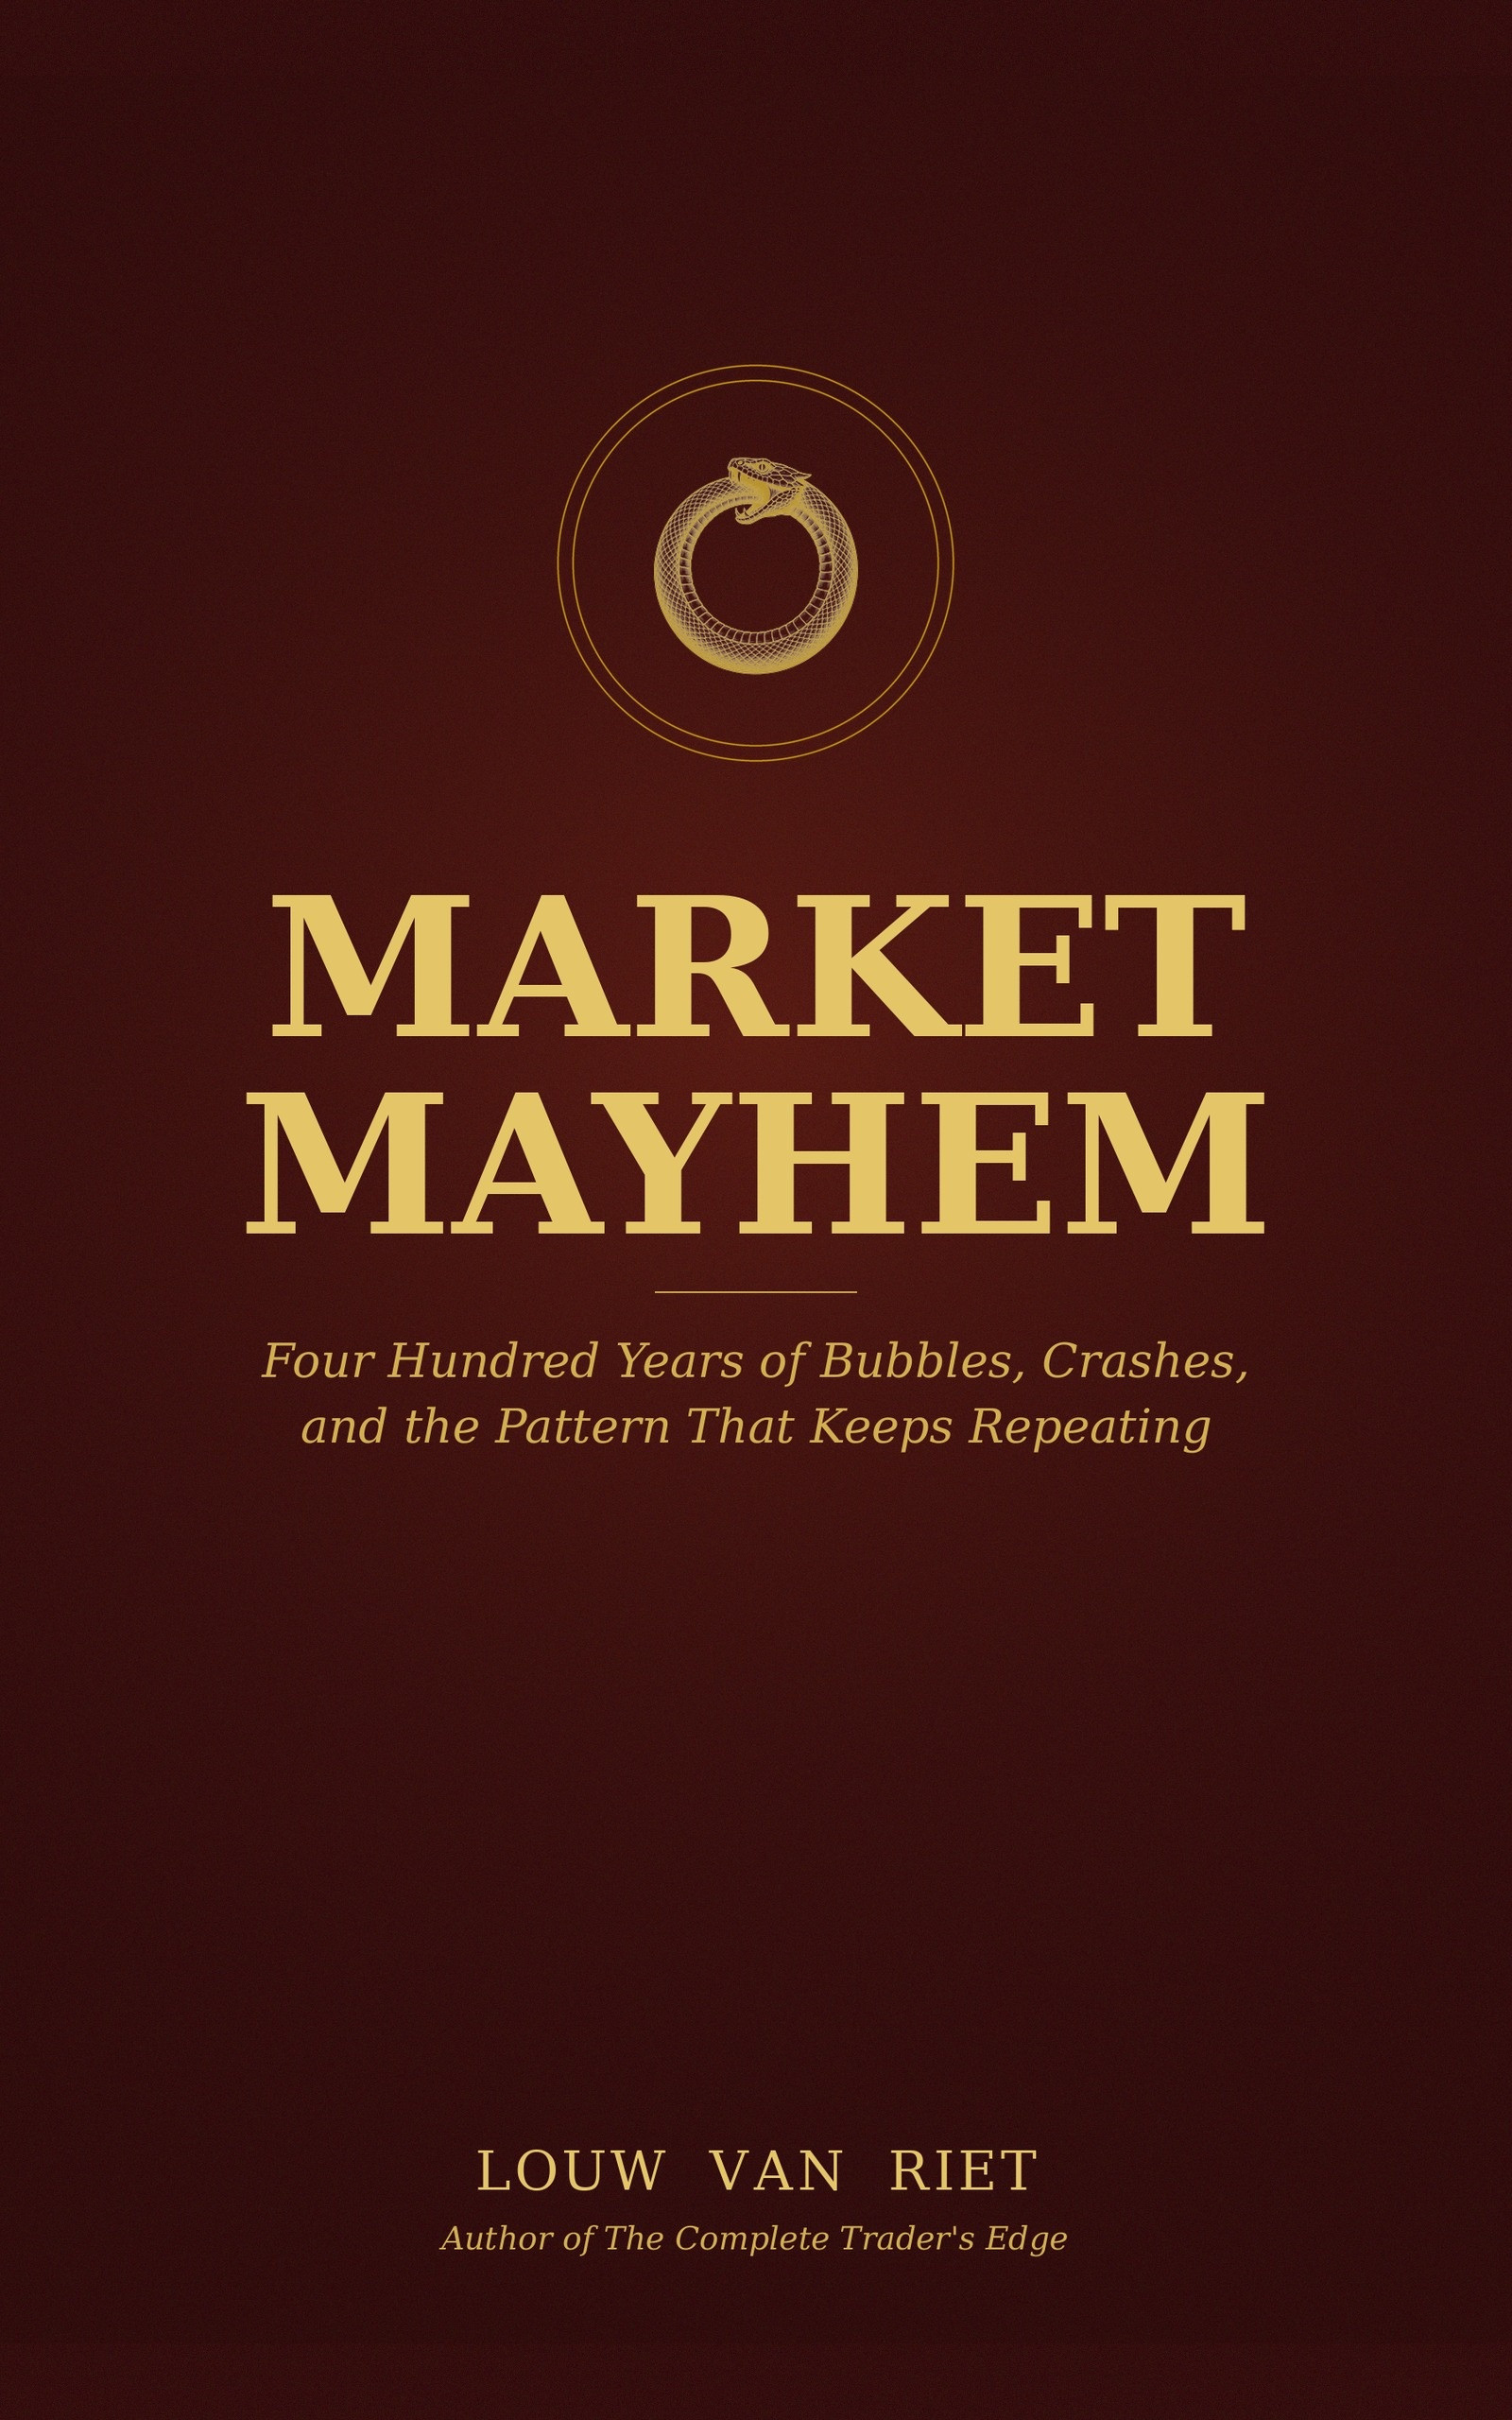 Market Mayhem
400 years of bubbles, crashes, and the pattern that keeps repeating.
Buy on Amazon →
 Greatest Companies
How the world's greatest companies were built — and what traders learn from them.
View on Amazon →
 Greatest Traders
Eighty-six lives that explain the markets — Livermore to Madoff, told with the losses left in.
View on Amazon →