Divergence is one of the most reliable early warning signals in technical analysis. When price moves in one direction and an oscillator moves in the opposite direction, something has changed beneath the surface — the momentum that was driving price is fading, and a reversal or significant pullback may be approaching.
The concept is simple. The application is where most traders go wrong. They spot a divergence, enter immediately, get stopped out as the trend continues, and conclude that divergences do not work. The problem is not the signal — it is the lack of context, confirmation, and proper integration with other tools. This guide teaches divergence trading the way it actually works: as a high-probability confluence tool within a broader framework, not as a standalone entry signal.
What Divergence Actually Means
At its core, divergence tells you one thing: the relationship between price and momentum has broken. In a healthy trend, price and momentum move in the same direction. When they separate — when price makes a new high but the oscillator makes a lower high, or when price makes a new low but the oscillator makes a higher low — the trend’s engine is losing power.
This does not mean the trend will immediately reverse. Trends can continue for extended periods after divergence appears, particularly in strong momentum environments. What it means is that the probability of a reversal or significant correction has increased. The trend is on borrowed time.
Think of it like a car climbing a hill. The car keeps moving upward (price makes new highs), but the engine RPM is dropping (momentum is declining). The car has not stopped yet, but the driver paying attention knows that unless something changes, the car will eventually stall.
The Four Types of Divergence
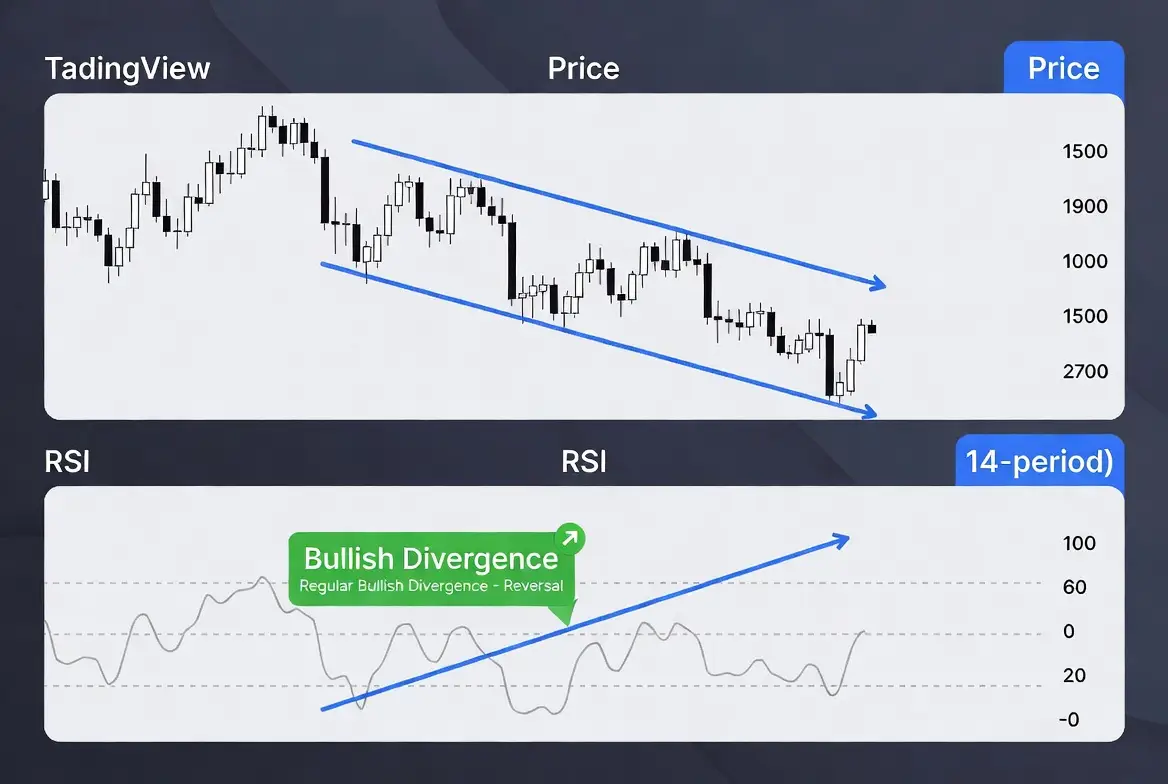
Regular Bullish Divergence
Price makes a lower low, but the oscillator makes a higher low. This signals that selling pressure is weakening even though price continues to fall. It is most reliable at the end of downtrends and near significant support levels.
The trading implication: the downtrend is losing momentum. A reversal or significant bounce is becoming more probable. This is not a buy signal by itself — it is a warning to bears and an alert to bulls that conditions are shifting.
Regular Bearish Divergence
Price makes a higher high, but the oscillator makes a lower high. This signals that buying pressure is weakening even though price continues to rise. It is most reliable at the end of uptrends, particularly when price is approaching significant resistance or is in the late stages of an impulse move.
If you trade the ICT framework, bearish divergence appearing during what looks like a wave 5 or a final push into a premium zone is one of the highest-probability reversal signals you can find.
Hidden Bullish Divergence
Price makes a higher low, but the oscillator makes a lower low. Unlike regular divergence, which signals potential reversals, hidden divergence signals trend continuation. The oscillator has reset (moved to an oversold extreme) while price has held its trend structure. This tells you that the pullback is a healthy correction within an ongoing trend, not the start of a reversal.
Hidden bullish divergence is particularly powerful when it appears during a pullback to a fair value gap or order block in an uptrend. The divergence confirms that institutional buyers are defending the level.
Hidden Bearish Divergence
Price makes a lower high, but the oscillator makes a higher high. This signals that the downtrend is likely to continue despite the apparent momentum spike on the pullback. The bounce was a trap — a stop-hunt above a recent high — and the oscillator is showing that the bounce lacked genuine conviction despite the price action looking bullish.
Which Oscillator to Use
Divergence can be identified on virtually any oscillator, but three are most commonly used and most reliable:
RSI (Relative Strength Index): The most popular choice for divergence analysis. RSI measures the speed and magnitude of price changes on a scale of 0 to 100. Divergence on RSI is clean and easy to read, and the 14-period default setting works well on most timeframes. RSI divergence is covered in depth in our indicators guide.
MACD (Moving Average Convergence Divergence): The MACD histogram is excellent for spotting divergence because it visually represents momentum as bars above and below a zero line. When the histogram makes a lower peak while price makes a higher peak, bearish divergence is forming. MACD divergence tends to be slightly more reliable than RSI divergence on higher timeframes because it filters out more noise.
Stochastic: The stochastic oscillator is more sensitive than RSI, which means it generates divergence signals more frequently — including more false signals. It is best used on higher timeframes (4H and above) or as a secondary confirmation alongside RSI or MACD divergence.
Our recommendation: use RSI (14-period) as your primary divergence tool. It balances sensitivity and reliability well across all markets and timeframes. Add MACD histogram as a secondary confirmation when you want additional confidence.
Why Most Traders Fail with Divergence
The number one reason divergence trading fails is that traders use it as a standalone entry signal. They see bearish divergence forming, immediately short, and get stopped out as the trend continues to make new highs. The divergence was correct — momentum was fading — but the trend still had enough inertia to continue for days or weeks.
Divergence is an early warning system, not a precise timing tool. It tells you what is likely to happen eventually, not what will happen immediately. The gap between “eventually” and “now” is where most traders lose money.
The second reason is trading divergence against a strong trend on low timeframes. A bearish divergence on a 5-minute chart during a strong daily uptrend is noise. The daily trend will overwhelm the 5-minute signal almost every time. Divergence must be read in the context of the larger timeframe trend, not in isolation.
The third reason is ignoring market structure. Divergence that appears while market structure still confirms the trend is a caution flag, not a reversal signal. Divergence that appears alongside a confirmed break of structure (lower low in an uptrend, higher high in a downtrend) is a high-probability setup.
The High-Probability Divergence Trading Framework
Here is how to trade divergence correctly — as a confluence tool within a broader framework:
Step 1: Identify the larger trend. Use the daily or 4H chart to determine the dominant trend direction. You are looking for divergence that either confirms a continuation (hidden divergence with the trend) or signals a reversal at a significant level (regular divergence against the trend at key support/resistance).
Step 2: Wait for divergence at a significant level. Divergence in the middle of nowhere is low-probability. Divergence at a major support or resistance zone, a weekly order block, a daily fair value gap, or a Fibonacci retracement level (particularly the golden pocket) is high-probability. The level provides the “where.” The divergence provides the “why.”
Step 3: Require a structural confirmation. Do not enter on divergence alone. Wait for price to confirm the reversal or continuation through a break of a minor swing high (for bullish setups) or swing low (for bearish setups). This is your timing tool. Divergence tells you the reversal is likely. The structural break tells you the reversal has started.
Step 4: Place your stop beyond the divergence extreme. For a bullish divergence trade, your stop loss goes below the low that formed the divergence. For a bearish divergence trade, your stop goes above the high that formed the divergence. This level is where the divergence thesis is invalidated — if price makes a new extreme that the oscillator confirms with a new extreme, the divergence has been negated.
Step 5: Size based on the distance to your stop. The distance from entry to stop defines your risk per share or per lot. Use your standard position sizing formula (risk amount divided by distance to stop) to determine the appropriate position size. Divergence setups at tight levels with nearby stops allow for larger position sizes relative to account risk.
Divergence and Smart Money Concepts
The ICT framework gives divergence additional context that pure indicator analysis lacks:
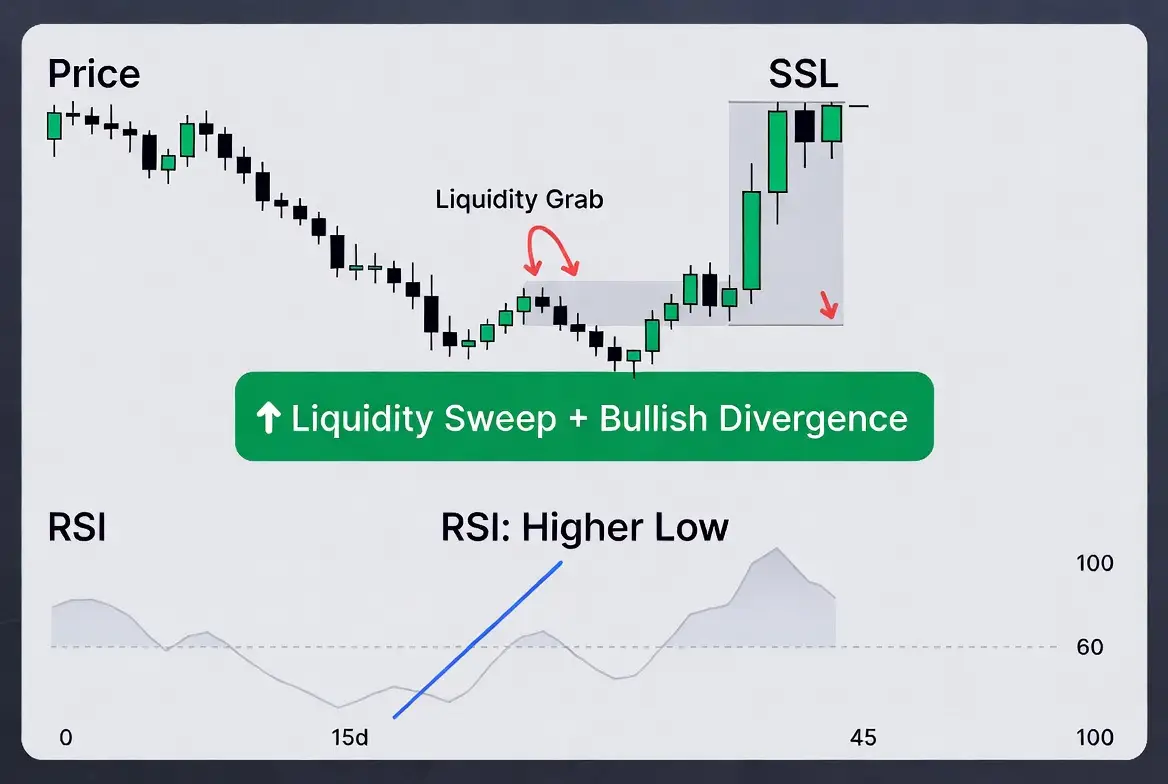
Divergence + liquidity sweep = highest probability. When price makes a new high that sweeps buy-side liquidity (taking out stops above a previous high) while the oscillator makes a lower high, you have the combination of a liquidity grab and fading momentum. This is the classic smart money reversal setup. Institutions have used the liquidity sweep to fill their orders, and the divergence confirms they are not pushing price higher.
Divergence + FVG fill = strong continuation signal. Hidden bullish divergence appearing as price pulls back to fill a fair value gap in an uptrend is one of the cleanest continuation setups available. The FVG tells you where institutions are likely to defend. The hidden divergence confirms they are defending it.
Divergence + order block rejection = precision entry. If price returns to a bullish order block and forms regular bullish divergence on the oscillator while rejecting the level with a pin bar or engulfing candle, you have three layers of confluence: institutional footprint, momentum confirmation, and price action trigger.
Divergence in the Power of 3 context. Bearish divergence during the distribution phase (wave 5 / final push) of an AMD sequence is particularly reliable because it confirms that the trend is exhausting exactly where the market maker model predicts it will.
Timeframe Recommendations
Divergence reliability increases with timeframe. Here is how to use it at each level:
Weekly/Daily: The most reliable divergence signals. A weekly RSI divergence at a major support or resistance level is one of the highest-conviction signals in technical analysis. These setups are rare but extremely powerful for swing and position trades.
4-Hour: The sweet spot for most active traders. 4H divergence provides enough signal quality to be reliable while generating enough setups to keep you active. Ideal for swing trading entries aligned with the daily trend.
1-Hour: Useful as a timing tool within a 4H or daily setup. If you have identified a high-probability zone on the 4H chart, dropping to the 1H to look for divergence can refine your entry and tighten your stop.
15-minute and below: High noise, low reliability for divergence alone. Only use intraday divergence as the final confirmation within a multi-timeframe framework — never as the primary signal. A multi-timeframe approach where the daily provides direction, the 4H provides the zone, and the 15-minute divergence provides the trigger is far more robust than any single-timeframe divergence strategy.
Common Divergence Mistakes to Avoid
Trading every divergence you see. Divergence is common. High-probability divergence at significant levels with structural confirmation is rare. Be selective.
Fighting strong trends. Bearish divergence during a parabolic rally can persist for weeks while the trend continues. Divergence does not mean “short now.” It means “the trend is weakening.” There is a critical difference.
Ignoring the oscillator’s extreme readings. Divergence that forms while the oscillator is in the middle of its range (RSI between 40 and 60) is weak. Divergence that forms at extremes (RSI above 70 or below 30) is much more meaningful because the oscillator is already indicating stretched conditions.
Cherry-picking peaks and troughs. Compare the most recent oscillator peak with the immediately preceding peak. Do not skip back three or four peaks to find a divergence that confirms your bias. The most reliable divergence occurs between adjacent swings.
Using divergence on tick or volume-based charts. These chart types distort the time relationship that oscillators depend on. Stick to time-based charts for divergence analysis.
Key Takeaways
📉 Regular divergence signals potential reversals. Hidden divergence signals trend continuation. Both are valuable in different contexts.
🎯 Divergence is a confluence tool, not a standalone entry. Always combine with a significant price level and a structural confirmation.
🔗 Divergence + liquidity sweep is one of the highest-probability reversal setups in the smart money framework.
⏰ Higher timeframes produce more reliable divergence signals. The 4H chart is the sweet spot for most active traders.
⚠️ Never fight a strong trend based on divergence alone. It tells you the trend is weakening, not that it has reversed.
 The Complete Trader's Edge
The full Mind · Method · Money framework. 70 chapters.
View on Amazon →
The Complete Trader's Edge
The full Mind · Method · Money framework. 70 chapters.
View on Amazon →
 Market Mayhem
400 years of bubbles, crashes, and the pattern that keeps repeating.
Buy on Amazon →
Market Mayhem
400 years of bubbles, crashes, and the pattern that keeps repeating.
Buy on Amazon →
 Greatest Companies
How the world's greatest companies were built — and what traders learn from them.
View on Amazon →
Greatest Companies
How the world's greatest companies were built — and what traders learn from them.
View on Amazon →
 Greatest Traders
Eighty-six lives that explain the markets — Livermore to Madoff, told with the losses left in.
View on Amazon →
Greatest Traders
Eighty-six lives that explain the markets — Livermore to Madoff, told with the losses left in.
View on Amazon →