The double top and double bottom are the cleanest reversal patterns on any chart, and once you understand what actually creates them, they change how you see every equal high and equal low you will ever mark. Because that is the secret the shape hides: those two matching peaks or troughs are not just a pattern. They are a pool of liquidity, and price is drawn to them on purpose.
This guide covers how to identify the double top and double bottom, what is really happening beneath the M and the W, how to trade them, and how to avoid the version that is built specifically to trap you.
What They Are
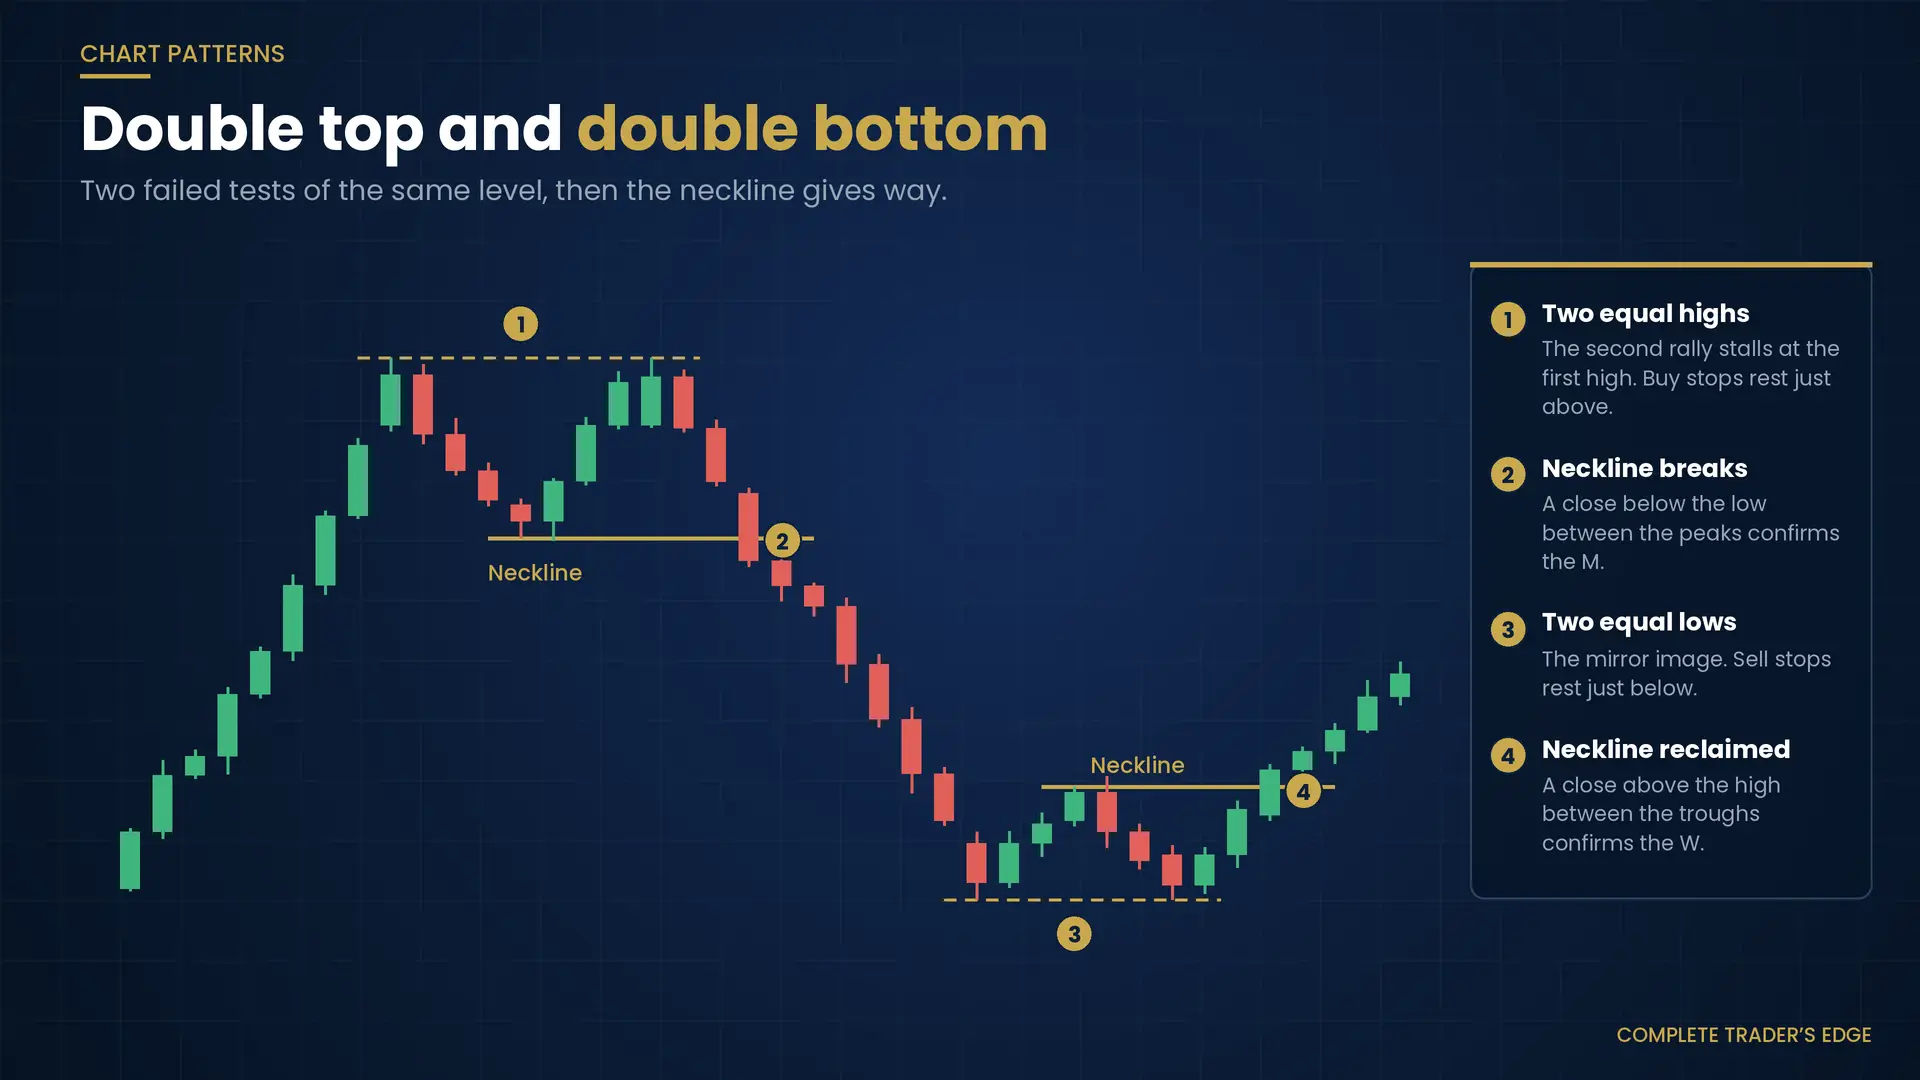
A double top forms after an uptrend when price makes a high, pulls back, then rallies to a second high at roughly the same level and fails. The result is an “M” shape. The low between the two peaks is the neckline, and the pattern confirms a reversal when price breaks below it.
A double bottom is the mirror image at the end of a downtrend – a “W” shape of two roughly equal lows – and it confirms an upside reversal when price breaks above the neckline (the high between the two troughs). Everything here applies to both, inverted.
What They Really Mean
Two highs at the same price are not a coincidence, and they are not just “resistance.” Equal highs are a magnet, because every trader who bought the first high placed a stop just above it, and every breakout trader has an order sitting there too. That cluster of orders is a pool of resting liquidity, and larger players know exactly where it is.
So there are two stories a double top can tell, and knowing which one you are looking at is the whole game. In the honest version, price reaches the second high, genuine sellers overwhelm exhausted buyers, and the reversal begins – a classic top. In the trap version, price is drawn up to those equal highs, sweeps just above them to trigger the stops and the breakout buyers, and only then reverses hard. In both cases the outcome is bearish, but in the second, anyone who bought the “breakout” above the double top is instantly trapped and becomes fuel for the move down.
How to Trade It
The conservative entry is the same discipline as any reversal: wait for a decisive break of the neckline, then enter on the retest of that broken level. Stop above the second high (or below the second low for a double bottom). Target the measured move – the distance from the peaks to the neckline, projected from the break – while managing to real structure and the next liquidity pool.
The advanced entry uses the trap itself. When price sweeps just above the equal highs and then sharply rejects – a liquidity grab followed by a shift in order flow – that rejection is often the highest-probability, lowest-risk entry, because your stop sits just above the sweep and the reversal is already underway. This is the double top read the way institutions actually trade it. Whichever entry you choose, size so your stop risks no more than 1% of your account.
Equal highs are bait, not a wall. The moment you see two matching peaks, mark the liquidity sitting just above them and expect price to reach for it. Whether that sweep becomes a reversal or a continuation is what your entry rules are for.
When It Fails
The double top fails when the “second high” is not the end of the move but a pause. Price sweeps the equal highs, and instead of rejecting, it accepts above them and keeps going – the uptrend was never done, and the pattern was a continuation in disguise. The defence is confirmation: do not short into the equal highs on hope. Wait either for the neckline to break and retest, or for a clear rejection after the sweep. If price closes and holds above the highs with momentum, the double top is invalid.
This is also why a double top at the top of an extended trend, into higher-timeframe resistance, is far more trustworthy than one that appears in the middle of a strong, healthy trend. Location decides reliability.
Key Takeaways
- Double top = two equal highs (M); double bottom = two equal lows (W); confirmed on the neckline break.
- Those equal highs and lows are pools of resting liquidity, not just support and resistance.
- Trade the neckline break and retest, or the sweep-and-reject at the second touch.
- Stop beyond the second peak or trough; target the measured move, managed to structure.
- A sweep that holds and continues means the pattern failed – demand confirmation.
Frequently Asked Questions
What is the difference between a double top and a double bottom?
A double top forms after an uptrend and signals a reversal down (an M shape of two equal highs). A double bottom forms after a downtrend and signals a reversal up (a W shape of two equal lows). They are the same pattern and the same liquidity logic, simply inverted.
How do I know if the level will hold or get swept?
You do not know in advance, which is exactly why you wait for confirmation rather than predicting. Either the neckline breaks and retests, or price sweeps the equal highs and rejects sharply. Until one of those happens, there is no trade – only a level to watch and the liquidity above it to respect.
The double top and double bottom sit alongside every other classic formation in our complete guide to chart patterns through a smart money lens.
Learn to read every classic pattern through the lens of liquidity and structure with the Mind · Method · Money framework in The Complete Trader’s Edge by Louw van Riet.
 The Complete Trader's Edge
The full Mind · Method · Money framework. 70 chapters.
View on Amazon →
The Complete Trader's Edge
The full Mind · Method · Money framework. 70 chapters.
View on Amazon →
 Market Mayhem
400 years of bubbles, crashes, and the pattern that keeps repeating.
Buy on Amazon →
Market Mayhem
400 years of bubbles, crashes, and the pattern that keeps repeating.
Buy on Amazon →
 Greatest Companies
How the world's greatest companies were built — and what traders learn from them.
View on Amazon →
Greatest Companies
How the world's greatest companies were built — and what traders learn from them.
View on Amazon →
 Greatest Traders
Eighty-six lives that explain the markets — Livermore to Madoff, told with the losses left in.
View on Amazon →
Greatest Traders
Eighty-six lives that explain the markets — Livermore to Madoff, told with the losses left in.
View on Amazon →