Legendary Traders · Market Wizards: The Next Generation
Lukas Fröhlich
An Audited 1,132,045% Year, Then Three Different Strategies
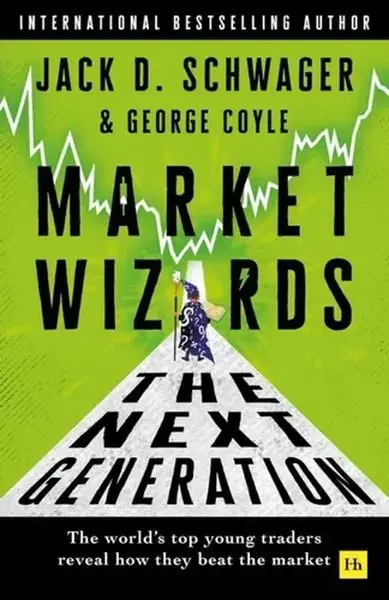
Chapter four of Market Wizards: The Next Generation, “Metamorphosis: Short-Term Short to Long-Term Long”
Last reviewed: September 2026. Every figure below is drawn from chapter four of Market Wizards: The Next Generation unless it is explicitly labelled as our own arithmetic. Where Fröhlich’s public claims and the chapter disagree, we use the chapter and say so. This profile replaces an earlier version of this page that leaned on secondary sources; several figures in that version do not appear in the chapter and have been removed.
Lukas Fröhlich is the trader in Market Wizards: The Next Generation whose record the authors trusted least, checked hardest, and ended up revising upwards. He had publicly claimed an 892,000% return for 2020. Jack Schwager and George Coyle reviewed his statements, tax documents and existing Big Four audit reports, spoke to his brokers, and then commissioned an independent agreed-upon procedure from a top auditing firm because they did not trust their own forensic accounting. The auditors found his claim was wrong. It was too low. On their Modified Dietz calculation his 2020 return was 1,132,045%.
That number is the reason people search for him, and it is the least useful thing about him. What makes chapter four worth reading is that Fröhlich has now run three trading businesses that are close to opposites: intraday shorting of diluting small caps as a teenager, long mid-cap breakouts in a euphoric bull market, and a contrarian, catalyst-driven long book held for months or years. He made money in all three, and he quit the first two while they still worked, because he could see the environment that fed them disappearing. He did all of this before his mid-twenties, having started at thirteen with $500 of birthday money and blown up four or five accounts before he left school.

Lukas Fröhlich at a glance
| Field | Detail |
|---|---|
| Grew up | France in early childhood, then Germany from just before the age of ten |
| Started trading | Age 13, about $500 of birthday and Christmas money, in an account opened in his father’s name |
| Early record | Four or five blown accounts during school, roughly $500 to $1,000 each |
| Full-time from | 2018, after finishing high school |
| 2020 return | 1,132,045% (Modified Dietz, independent agreed-upon procedure) |
| 2020 account growth | 37,127%, lower because profits were withdrawn during the year |
| Jan 2020 to Dec 2025 | 309.3% average annual compound rate, maximum drawdown 35.5% |
| Strategy one | Intraday shorts in small caps gapping up ahead of dilution, to 2020/21 |
| Strategy two | Long mid-cap breakouts, spring 2020 to mid-2021 |
| Strategy three | Contrarian value with catalysts, timed by breakouts and the 200-day average, from 2022 |
| Risk per theme now | Around 5% on average, up to about 10% |
| Stated goal | Grow the account to $1 billion |
| In the book | Chapter 4 of Market Wizards: The Next Generation (2026) |
Lukas Fröhlich’s record: what the audit found, and what it cannot tell you
Almost every mention of Fröhlich online repeats the 892,000% figure he published himself. The chapter replaces it, and the story of how it did so is more informative than either number.
Schwager and Coyle say plainly that scepticism about Fröhlich was so strong that they went to unusual lengths. They reviewed his brokerage statements, his tax documents and audit reports that Big Four firms had already produced. They spoke to his brokers. Then, citing the complexity of the documents and their own lack of forensic accounting expertise, they commissioned an independent agreed-upon procedure from a top auditing firm. An agreed-upon procedure is a narrow engagement: the accountant performs specific tests the client specifies and reports what was found, without giving a broad opinion. It is the right tool for the job, because the question was narrow. Is the return real, and how should it be measured?
| Figure | What the chapter states | What it measures |
|---|---|---|
| 892,000% | The 2020 return Fröhlich claimed publicly | His own figure. The independent review found it understated. |
| 1,132,045% | 2020 return per the independent firm, Modified Dietz method | Performance, adjusted for money moving in and out |
| 37,127% | Ending 2020 balance compared with the beginning balance | Account growth, depressed by withdrawals during the year |
| Factor of seven | Growth in his account since 2020 | Account growth, basis not specified in the text |
| 309.3% a year | Average annual compound rate, January 2020 to December 2025 | Six-year compound performance |
| 35.5% | Maximum drawdown over the same six years | Peak-to-trough decline |
Why the audited number is higher than his own
The gap between 1,132,045% and 37,127% is not an error in either figure. It is what happens when a trader withdraws money from a fast-compounding account.
A simple return compares the ending balance with the starting balance. If you start the year with $10,000, earn a great deal, withdraw some of it in June and end the year with $3.7 million, the simple measure understates what your trading did, because the money you took out stopped compounding the moment it left. The Modified Dietz method corrects for that by weighting every deposit and withdrawal by the fraction of the period it spent in the account. It is a standard way to approximate a time-weighted return, the measure fund managers are expected to report, because it isolates the trader’s skill from decisions about when to add or remove capital.
Our arithmetic, not the book’s: 37,127% growth means the ending balance was about 372 times the starting balance. 1,132,045% as a time-weighted figure corresponds to money multiplying roughly 11,300 times. The difference, a factor of about thirty, is the compounding that the withdrawn profits would have earned had they stayed in. For a trader compounding at that speed, taking money out early in the year has an enormous effect on the ending balance, which is exactly why the time-weighted number is the fairer description of the trading.
Why the six-year numbers need care
The three multi-year figures in the chapter do not reconcile with each other on any single basis we can reconstruct from the text alone, and a reader should know that before quoting any of them.
Our arithmetic, not the book’s. A 309.3% average annual compound rate over six years multiplies money by roughly 4,700. But a time-weighted 2020 on its own multiplied it by about 11,300, and the chapter describes the following years as profitable overall, with a maximum drawdown of 35.5%. Those two things cannot both be true of the same time-weighted series. Separately, if the sevenfold growth the chapter reports since 2020 describes 2021 to 2025, that is about 48% a year compounded, strong but a different planet from 2020. The likeliest explanation is that the six-year compound rate is calculated on a different basis from the single-year figure, and the book’s endnote on the calculation would settle it. We have not reproduced that note and are not guessing at it.
What survives any reading is this. 2020 was an outlier so extreme that it dominates every multi-year average it sits inside, and the years since have been good rather than miraculous. Anyone quoting 309.3% a year as a description of what Fröhlich typically does is making the same mistake as quoting Lance Breitstein’s 263% average without noticing that most of it came from fourteen months. We cover that pattern in our Breitstein profile.
Lukas Fröhlich net worth: the honest answer
No public or verified net worth figure exists, and the chapter does not supply the inputs to estimate one. Unusually for a Market Wizards profile, it gives no dollar figures for his account at all: every number is a percentage. A 1,132,045% year on a $10,000 account and on a $1 million account are the same percentage and completely different fortunes. What the chapter does state is his goal, to grow the account to $1 billion, which he describes as a motivating target rather than something he is fixed on. Any net worth number you see attached to his name has been invented.
A French childhood, a German classroom, and a way out
Fröhlich spent his early childhood in France. His parents had met in Germany but moved to France when his father took a job there. In the aftermath of the global financial crisis, when Lukas was just short of ten, the family moved back to Germany for a better job market. He went to a French-speaking school in Germany for about three years, then his parents moved him to a German-speaking one so he would learn a second language and his heritage. He could not speak, read or write German. The surname means “happy”. The chapter is not a happy account of school.
He describes the transition as brutal: an extreme amount of work just to keep up, few friends, and a feeling of being in a kind of prison. He is careful to say it was challenging rather than unhappy, but the conclusion he drew as a young teenager is the load-bearing fact of his whole story. He wanted out of school, he wanted freedom, and he reasoned that money would buy it. He searched online for the fastest way to make money and trading was at the top of the list. He now calls trading for quick money a terrible idea. Schwager, who has interviewed great traders for several decades, says Fröhlich is the first whose motivation to trade was to get out of high school.
His father settled the argument about leaving school early. Lukas could do whatever he wanted after high school, but he had to finish it first. Later the deal hardened. His father supported the idea of doing what you love, figured his son was young enough to recover from mistakes, and let him make them. But he would not fund the trading account, and the terms were clear: find a way to earn a living from trading, or go on to higher education.
Four or five blow-ups before he could legally trade
He started at thirteen. His father opened an account in his own name, and Lukas traded it. His father, he suspects, assumed he would buy a stock or two and hold them. Instead he went looking for maximum leverage from the first day.
The first account held about $500 of birthday and Christmas money. He started with currencies because they offered the most leverage and lost everything quickly. He moved to stocks, but not real ones: he traded contracts for difference on European stocks and indices, at leverage as high as 50 or 100 to one. A CFD is a derivative settled on the difference between entry and exit prices; you never own the asset, which is what makes that leverage available.
One of his first stock trades doubled the account; the next day it reversed and the account went to zero. Worse was a short in the DAX at 100 to one: the index rose 2% overnight and he lost 200% of the account, which went negative. He paid the deficit by selling his bicycle, one of his favourite possessions, and borrowing from a friend. He says he felt like an absolute failure. Through high school he funded four or five attempts, each of roughly $500 to $1,000, from allowance, gifts and the sale of a PlayStation. He is still comfortable in volatility and chaos, arguing that the more emotional the market, the cleaner the patterns. The instinct was never the problem; pairing it with leverage and no risk control was.
The four mistakes, as Schwager lists them
Schwager’s closing note reduces the early years to a list that doubles as a checklist for anyone starting out: no defined trading method, no risk control, excessive leverage, and no post-trade review. Fröhlich adds his own diagnosis in the interview. Beyond the leverage, he had no real method, he did no post-trade reviews, and he was stubborn about taking losses. The last one, he says, took him the longest to overcome.
What he did have was a habit that most failed traders lack. Every time he blew up an account, he studied what he had done wrong so that he would not make the same mistake again. He never considered quitting, because as long as he could see improvement, however small, he believed he would eventually get where he wanted to be. His description of the job is worth keeping: part investigative journalist, part data analyst, part risk manager and part psychologist. It started as an escape and became a passion.
The two rules that ended the wipeouts
The fix, when it came, was not a strategy. It was a pair of limits: a maximum potential loss he would accept on any single stock, and a maximum loss he would allow across his whole portfolio on any single day.
That is the whole of it, and Coyle singles it out in his closing note as the most important thing in the interview. He admits to being a broken record on cutting losses and says decades of study have convinced him that cutting losses is what lets a trader survive to fight another day, and that survival is the real key to success. It is worth noticing what the rules did and did not do. They did not make Fröhlich profitable. They made him unable to be wiped out, which bought him the time to become profitable. Those are different achievements, and beginners routinely try to achieve the first without the second.
If you have not set these two numbers for your own account, our position sizing guide and our piece on the mathematics of risk of ruin work through how to choose them.
Free videos, Tim Grittani, and research until 3am
After his first blow-ups he could not afford a course, so he watched every free video he could find, for up to ten hours a day. Among them were traders arguing for small-cap stocks, on two grounds. Small caps make much larger percentage moves than large caps. And they contain exploitable inefficiencies because they are too small for most professional traders to bother with. The trader Fröhlich singles out is Tim Grittani, who argued the best way to play small caps was from the short side and who put heavy emphasis on quantifying whatever could be quantified in order to identify patterns. Fröhlich took the second idea and ran with it. From Grittani, he says, he learned the value of deep research, and he calls that another turning point.
Through Twitter he met Miah Lee, a Texas-based trader who became a research collaborator and a good friend. They worked together for a few years and identified opportunities in small caps through research and backtesting. He did the research while still at school by staying up until two or three in the morning.
There was one problem. Most of the opportunities they found were on the short side, and his broker did not have shares available to borrow. The research was sound and he could not implement it.
That changed when he graduated in 2018. He found a broker that could supply borrow on the stocks he wanted to short, and because it operated through a Bahamian entity he could get around the American pattern day trader rule, which requires a margin account making more than four day trades in five days to hold at least $25,000. He received several thousand dollars as a gift for his eighteenth birthday, which became his trading capital. That, he says, was when it came together: the hard lessons, a researched edge, and a broker that let him use it.
Strategy one: shorting the small-cap dilution cycle
The strategy that produced 2020 is the most specific method in the chapter, and it is worth understanding even if you never intend to short a small cap, because it is a clean example of an edge built on knowing who is on the other side of the trade.
Start with the mechanics of a company running out of money. Fröhlich’s illustration: a company has $1 million of working capital and burns $500,000 a quarter. Put those two numbers together and you know it has to raise money within six months if it wants to stay in business. Companies like that typically raise capital through secondary offerings, and secondary offerings in this corner of the market tend to be associated with a big gap up in the stock.
That looks backwards. Secondary offerings are normally priced at a discount to attract buyers, so why would the stock jump? Fröhlich’s explanation is the heart of the edge. The small-cap space has only a handful of underwriters, and they are not the large investment banks. They acquire stock, or instruments such as warrants or convertible bonds, at a low price, and because the companies are desperate for cash they can negotiate very favourable terms. They then need a way to sell at a profit. A press release appears, sometimes recycled old news, sometimes, he says, completely fabricated. The stock rallies in pre-market hours on thin volume, gaps sharply higher on the open, and the underwriters sell into it. Asked whether that is legal, he says he is not a lawyer and cannot judge the financing deals or the news releases. He simply shorted the result.
Schwager summarises it as piggybacking the underwriters. Fröhlich agrees. Repeatable patterns emerged around companies running out of working capital, and plenty of those companies would gap up 100% or more on purported news only to finish the day down 30%.
The fundamental layer: why most small-cap shorts did not do what he did
Most traders who short gapping small caps, he says, do not distinguish between the gaps. He did.
He read SEC filings to identify companies with an impending working capital problem, and he studied the news releases behind each rally to judge whether the news was bogus or might mark a genuine turning point. If the filings suggested the company’s prospects had actually improved, he avoided the short regardless of how extended the price looked. He also researched the underwriters themselves and learned how their deals typically worked, because definite patterns emerged when he studied them one by one. He attributes some of his outsized results to those differentiating factors, which other traders were not analysing.
The technical layer: an average day for every kind of gap
On the chart side he built something closer to a statistical template than a pattern library. A stock that gaps up 50% behaves differently from one that gaps up 300%, so he separated them. He studied intraday behaviour too: if a stock opened 100% higher and then went sideways for the first hour, what typically happened over the next hour, or the rest of the day? With a sample of, say, 250 stocks that followed a similar path, he would aggregate them to build an average of what the trading day should look like. The templates were not foolproof, only a way to trade with the odds in his favour, and the research behind them went back to 2000.
Entries, stops and the three-strikes rule
He did not short simply because a stock matched a template. He waited for a sign of weakness, such as the first red candle or another negative technical signal.
Stops were mental rather than resting orders, and he used four different kinds depending on the situation:
| Stop type | How it worked | What it protects against |
|---|---|---|
| New daily high | Exit if the stock makes a new high for the day | The thesis that the gap is exhausted being plainly wrong |
| Percentage stop | Exit a set percentage above the entry price | A fixed maximum loss per attempt |
| Standard-deviation stop | Exit on a move above the opening price of a set number of standard deviations | Noise, because the stop widens and narrows with the stock’s volatility. His preferred method. |
| Time stop | Exit if the stock has not followed the expected daily pattern by a given time | A trade that is not losing much but is not doing what the template says it should |
On top of the stops sat a rule that deserves more attention than it gets. If he tried to short a stock three times in one day without success, he stopped for the day. That preserved capital, and it left him free to try again the next day if the stock still looked like an attractive short on his analysis. Most traders who fail at this style do so by re-entering the same losing idea over and over, with each attempt made in a worse emotional state than the last. A hard cap on attempts removes the decision.
He always used stops, and he explains why this matters more on the short side of small caps than anywhere else. Trading in these stocks can be halted, and a halted stock can reopen as much as 1,000% higher. He says he has seen multiple people blow up shorting small caps. He was caught short in halted stocks himself several times. What limited the damage was entering with only about half his intended size and adding only if the trade worked. His broker had software that helped him place stops to avoid getting stuck in a halt, but sometimes a stock moved so far so fast that there was no way out, and he covered as soon as it reopened.
Sizing and exits
In those years he was, in his own word, extremely aggressive. Including pyramided additions, he sized so that his average trade returned the equivalent of 10% of his equity, which compounds an account exponentially. The space was uncrowded and the price behaviour predictable: stocks would gap up on the open and grind lower into the close. He usually covered by the end of the day, because his research said the close was the best exit, borrow on small floats was expensive overnight, and a gap against him the next morning was always possible.
Sonnet Biotherapeutics, 14 April 2020
The worked example in the chapter is Sonnet Biotherapeutics on 14 April 2020, and Fröhlich calls it a textbook case of every factor aligning.
SONN appeared on his scanner that morning with a huge gap higher on massive volume. He ran his quantitative analysis, searching for similar historical situations, and found a high probability that the stock would fall substantially that day. He then went to the fundamentals. The company was running out of cash. Its capital structure included various warrants and convertibles, which suggested to him that their holders would use the sharp gap up to convert into shares and sell at the higher price. He expected the extra supply to drive the price back down.
The whole analysis took about twenty minutes. He acknowledges that sounds fast and says that once the process is established it can be done quickly.
He traded around the position rather than shorting once and holding. The first attempt was stopped out for a small loss. The second, near the high of the day, worked, and he covered near the opening range. He shorted again after a small bounce and caught another leg lower. The book’s one-minute chart marks each entry and exit, with split-adjusted prices that look astronomical because SONN has since done several reverse splits. A stopped first attempt, a working second, a cover and a third entry: the three-strikes rule operating in real time, with one idea treated as a series of small, separately risked trades.
“As soon as something becomes too easy”
Does the strategy still work? Fröhlich’s answer is yes, and that it will probably keep working, because risky companies that need capital to survive will keep accepting terrible deal terms, and because capacity constraints make it too small for institutions to bother with. But it has changed.
“As soon as something becomes too easy or a consensus trade, the game changes.”
That line is Fröhlich’s, and Schwager picks it out in his closing note. At one time you could short small caps that gapped up sharply on the open, hold until the close and make money. Once everyone worked that out, the timeframes shifted and the timing of the entry had to become more strategic. The opportunity count fell with it. In 2020 and 2021 he saw as many as two or three setups a day. After the Covid boom it dropped to about two or three a week. He rarely trades them now, and when he does, he says, it is to join in the fun with friends who trade faster than he does.
Strategy two: mid-cap breakouts in a euphoric market
He shifted away from small caps during 2020 and 2021 and into something almost opposite: buying mid-cap breakouts on the long side. He describes it as a strategy that works in strong bull markets and outperforms almost anything in the seventh to ninth innings of a bull market, during the euphoria phase. The difficult part, he says, is that you have to believe the bubble will continue. He was young and naive enough not to be scared, and he thinks that was the mindset the strategy required.
He had three reasons for the switch. The environment: quantitative easing, rate cuts, stimulus cheques and people stuck at home produced a flood of new market participants who could not go short, which he calls a long-only trader’s paradise. Capacity: his account had grown to the point where he needed a strategy that could handle more capital, and he believed larger moves in mid-caps could make more money. And risk: he wanted to get away from shorting small caps because it was too dangerous.
The criteria, as the chapter lays them out:
| Element | What he looked for |
|---|---|
| Size | Market capitalisation of $1 billion to $5 billion, the range that tends to move the most |
| Float | Smaller floats preferred, for more explosive upside |
| Theme | In 2020, stories being hyped on social media, such as electric vehicles. Fundamentals barely mattered. |
| Catalyst | Any positive news, but what mattered was the reaction: a 40% to 100% price move plus a significant increase in volume |
| Consolidation | A pause after the burst, ideally holding the upper half of the range before breaking out |
| Entry | On the breakout, or earlier inside the upper part of the range, especially in a cup-and-handle or when price converged just above the 20-day exponential moving average |
| Initial size | About two-thirds of the intended position |
| Timeframe | Daily charts |
The consolidation was the part he cared about most. His reading is that a tight pause after a catalyst means larger institutions are accumulating stock and absorbing the supply, which sets up a much larger move. Short sellers also tend to use lulls to short stocks that have run hard, so when the price breaks out they get squeezed, which adds fuel. He often bought before the breakout rather than on it, for a practical reason. In the best setups the price would fly upward so fast on the breakout that there was not enough liquidity to build a meaningful position.
The pyramiding rule nobody else states
This is the section of the chapter that Coyle says was new to him, and it is the most useful idea for any trader who adds to winning positions.
Fröhlich’s initial position had to be large enough to act as a price anchor, because he expected his first entry to be his best price. After that, he describes himself as very aggressive about pyramiding, because he needs big wins to pay for the small losses, and the trades with the largest pyramided positions are the ones that generate exponential profits. He added in three places: on the breakout itself when his first entry had been pre-breakout, on pullbacks to the 20-day EMA, and inside a new consolidation that formed after an upswing.
The rule is what governs those additions. Every addition had to be a setup he would have considered attractive on its own. He would not add simply because a trade was working. There needed to be a second setup that would qualify as an initial entry if he had no position at all. And if an addition did not work in short order, he treated the whole trade as dead and got out.
How much to add
The sizing rule for additions is exact. He added an amount such that, if the stop on the combined position was hit, the loss on the new shares would exactly offset the open profit remaining on the earlier position. In his words, he would risk turning his existing open profit into a scratch trade in exchange for the chance at exponential profits.
Our worked example, not the book’s. Suppose you bought 1,000 shares at $20, the stock is now $30, and a new consolidation gives you a valid second setup with a logical stop at $27. If the stop is hit, your original shares still show a profit of $7 each, or $7,000. Fröhlich’s rule says add enough shares that a fall from $30 to $27 costs exactly $7,000 on the new shares: $7,000 divided by $3 is about 2,330 shares. If the trade fails, the whole position comes out at roughly breakeven. If it works, you now hold 3,330 shares instead of 1,000, bought with the market’s money.
| Scenario | Original 1,000 shares | Added 2,330 shares | Net result |
|---|---|---|---|
| Stop hit at $27 | +$7,000 | −$6,990 | About breakeven |
| Stock runs to $40 | +$20,000 | +$23,300 | +$43,300 |
| Stock runs to $60 | +$40,000 | +$69,900 | +$109,900 |
His stops moved with the trade. Buying inside a consolidation in anticipation of a breakout, the stop sat below the consolidation. Buying the breakout, it sat below the low of the breakout day. Once the trade was well ahead, the stop trailed below the 20-day EMA, and if the move turned parabolic he tightened to the 9-day EMA. Schwager observes that the approach needs a stock to behave in a very specific way to be profitable: the outcome is a small initial loss, a scratch, or a home run. Fröhlich agrees.
That shape is the idea Coyle develops in his note. He has long believed that some traders can skate on thin ice and produce outstanding results with strategies that most people cannot stomach. He has simulated strategies with brutally low win rates, as low as 5% winning trades, that still produce strong aggregate returns, and he has met a few systematic traders who run them. Fröhlich’s mid-cap strategy is a discretionary version: he willingly accepted that most trades would be small losses or scratches because the few that lined up correctly allowed for exponential account growth. For the maths of why that works and why it is so hard to live with, see our pieces on why the edge is in the exits and on the difference between adding to a thesis and adding to a price.
GrowGeneration, 2020 to 2021
The mid-cap example in the chapter is GrowGeneration, a cannabis stock, traded from late 2020 into early 2021.
The catalyst was an exceptional earnings report in August 2020, which set off a rally of more than 100% the following week. The cannabis sector was also getting heavy attention on social media. That combination put GRWG on his list as a breakout candidate. The stock then spent the next few months consolidating, until price pulled back and converged with its 9-day and 20-day EMAs. That convergence was his trigger for the initial position.
He added on a second catalyst, another strong earnings report. He added again on a pullback to the 20-day EMA. And he exited when the stock showed the signs of hysteria he watches for. The book’s daily chart marks five points: the first catalyst, the initial entry, the second catalyst with a sizable add, the second add, and the exit. It notes that Fröhlich also traded around the core position with small entries and exits that are not shown.
Measuring hysteria, and knowing when a strategy is finished
He took profits on these trades in three situations: market hysteria, a wide upside excursion from a moving average, and a stock reaching a resistance area. The first is the one he describes in detail, and it is a useful checklist for anyone who struggles to sell a runner.
Stocks that follow his pattern often have a third act, in which the price goes parabolic. He calls that third wave typically lethal to the uptrend, because it signals complete capitulation by the shorts and a need for a retracement. He measures it by how far the price has stretched from its 9-day and 20-day EMAs, by the number of consecutive up days, by expanding volume, and by increases in the average daily true range. When the stretch from the averages gets too big, he treats it as a cue to start looking for the exit.
He traded the strategy from spring 2020 to mid-2021 and then stopped, because it only suits strongly advancing bull markets. It worked until the bull market stalled in mid-2021 and was, in his words, a disaster for the following couple of years. Most traders using it or anything similar would have blown up. His estimate is that 99% of traders using this kind of strategy will fail, not because they apply it badly, but because they keep using it when the environment no longer suits it. They lack the patience to stop trading it for years at a time.
Strategy three: a contrarian with a trend-follower’s trigger
After the mid-cap strategy he moved to a value-oriented, long-term approach, which is the part of the chapter title that reads “long-term long”. The 2022 bear market gave him the idea: timing looked ideal for identifying companies that were both undervalued and had strong growth prospects, stocks that would make good long-term holdings. He also wanted an approach that could carry his goal of growing the account to $1 billion. He says he is not fixed on hitting that figure, but having it as a target keeps him motivated.
He describes his current approach as having a lot in common with Stanley Druckenmiller and George Soros, a blend of investing and trading, and of being a contrarian and a trend follower at the same time. The contrarian part is where he looks. The trend-following part is how he gets in.
The process starts with visualising what the next year or two will look like and trying to anticipate the most significant unexpected developments, because stocks that experience surprises tend to have the biggest moves. He has found the best results in markets and sectors that are out of favour. The target is a significant valuation discount combined with a probable, high-impact catalyst that the market is not pricing. That anticipated catalyst is the “surprise”. The best trades have both a margin of safety from the low valuation and a catalyst from the expected news.
He calls the ideal setup a golden goose, and the chapter lets us assemble its parts:
| Component | What it means in practice |
|---|---|
| Neglected or hated | A strong company trading at a discount because of risks he believes are external or overblown |
| Strong fundamentals | A viable long-term business model, ideally with exposure to one or more growth themes |
| Attractive valuation | A genuine discount, not just a lower price than last year |
| High short interest | Listed among the ideal features of a candidate |
| Consolidating chart | A base forming rather than a price still in free fall |
| Catalyst | Expected or realised, and not priced by the market |
| Uncorrelated | Ideally unrelated to what is already in the portfolio, which diversifies it and lets him carry more leverage overall |
The 200-day moving average as the gate
Technical analysis decides when he commits. He enters when a stock breaks out of a recent range, or when it reclaims its 200-day moving average after trading below it. He may start a small position below the 200-day, but he will not build a substantial one until the price is back above it. He calls the 200-day average critical to his current style.
Schwager presses him on an obvious tension. Buying below the 200-day or on a reclaim implies buying stocks far below prior highs, which works after a bear market like 2022. But how does he find candidates after several years of bull market? His answer is that a stock does not have to be far below its highs to offer value. With strong return prospects and a low valuation, he might enter on a major multi-month or multi-year breakout, even well above the 200-day. And even in the strongest markets there are always depressed corners. Chinese stocks were at multi-year lows in early 2024 while US indexes were making new highs. Healthcare stocks were near multi-year lows earlier in 2025 while US indexes rallied sharply to records.
Alibaba: six failed attempts, then more than twenty times the losses
Alibaba is the chapter’s main example of the current style, and the process matters more than the result.
By 2024 Chinese stocks, including high-quality companies, were at record-low valuations. Alibaba was trading on a P/E ratio near 10, was still growing earnings at a low double-digit rate, had the growth potential of its cloud business, and was executing major buybacks. The Chinese market as a whole faced severe headwinds: weak GDP growth, high domestic unemployment, a continuing housing crisis and deflationary pressure. Based on how China had responded to similar crises in the past, he felt confident that a large government stimulus package was a matter of time. That was the surprise.
He says Alibaba checked every box. But getting into it was not smooth. He first probed the long side in 2022 with small starter positions and tight stops. He describes this exploratory phase as difficult: six failed trades, with a combined loss of more than 2% of his equity. Once his core thesis began to be validated, he scaled in and pyramided. He ultimately made more than twenty times what he had initially lost on the stock.
He did not simply hold. When one of his long-term positions goes parabolic, as several Alibaba rallies did in 2025, he may take profits in anticipation of a correction and a better re-entry price. He reinstates or adds if the stock reclaims its 200-day average from below, or if it is above the average and pulls back to test it, which is what happened in Alibaba in 2025. The book reproduces a daily Alibaba chart from 2021 to 2025 with his 2024 and 2025 entries and exits marked.
Centene, and a surprise the market was not pricing
The second example is more recent, and the chapter gives the reasoning but not the result, so we do not supply one.
In the summer of 2025 healthcare came under heavy selling pressure because of government-led regulatory and funding changes. Companies exposed to government funding were hit hardest. Centene, heavily exposed to Affordable Care Act subsidies, crashed. Fröhlich believed the market was overestimating the risk to healthcare in general and to Centene in particular. The surprise he anticipated was political: that Democrats, and even Republicans, would ultimately protect healthcare funding by extending ACA subsidies and reversing Medicare cuts, because these are critical benefits for their voters. The market, he felt, was pricing a catastrophic outcome, while he saw a high-probability political resolution.
5% to 10% per theme, and the Kelly argument
This is where Fröhlich and most risk-management advice part company, and he knows it.
Asked how much he will risk on an investment theme, he says he has no exact number but somewhere around 5% to 10% of his account sounds right. Schwager calls that aggressive. Fröhlich’s reply is that new traders tend to oversize but experienced traders often undersize, and that if successful traders took the time to work through the Kelly criterion, they would find their ideal size is probably three or four times what they trade, even assuming half-Kelly sizing because full Kelly is too risky. He considers 5% on a single position too low relative to what he should be trading, but he sticks to around 5% on average for the peace of mind it gives him.
In our own words: the Kelly criterion gives the fraction of capital to bet that maximises long-run compound growth, given a known probability of winning and a known ratio of the average win to the average loss. Written simply, the fraction equals the probability of winning minus the probability of losing divided by the win-to-loss ratio. If wins and losses are the same size and you win 60% of the time, Kelly says bet 20%. If your wins are twice your losses and you win half the time, Kelly says 25%.
The warnings are the point. Betting beyond the Kelly fraction hurts growth faster than betting below it. Half Kelly gives up about a quarter of the compound return; double Kelly gives up all of it; beyond that, compound returns turn negative even with a genuine edge. Overestimating the correct size does twice as much damage as underestimating it by the same amount. And the formula assumes you know your win rate and payoff ratio precisely, which is true at a casino table and almost never true in markets. Schwager notes that Ed Thorp, faced with that uncertainty when he traded a trend-following system, estimated he was using less than a tenth of Kelly, so little that he did not bother using the formula at all.
Our reading, not the book’s. If Fröhlich’s 5% is a third to a quarter of what half-Kelly would allow him, his implied half-Kelly is 15% to 20%, and full Kelly 30% to 40%. To get a full-Kelly figure of 30% you need something like a 47.5% win rate with winners three times the size of losers. That is plausible for a strategy with the shape he describes. It is also exactly the kind of estimate that is easy to get wrong after a run of success, which is when traders tend to calculate it. His decision to run at a fraction of his own estimate is the more important part of the answer.
He adds one more sizing input: recent performance. Following the approach he attributes to Soros and Druckenmiller, when he is doing well he pushes to go for a huge year. For the arithmetic in more detail, see our Kelly criterion guide for traders and our profile of Edward Thorp, who did more than anyone to bring the formula into markets.
The 40% drawdown of 2022
Asked for his worst trading mistake, Fröhlich names underestimating how long bear markets can last.
In 2022 he bought stocks on the way down because they were cheap and he was eager to take advantage. That was a mistake. So was the size: he took positions that were too large and added to losing positions. The drawdown was around 40%, and he calls it painful.
There is a small inconsistency worth flagging. The chapter’s introduction gives a maximum drawdown of 35.5% for January 2020 to December 2025, while Fröhlich himself puts the 2022 decline at around 40%. The likeliest explanation is that the audited figure uses month-end values while his recollection is of the intra-month trough, or simply that his figure is a rounded memory. The chapter does not reconcile them, so we present both.
He lists the lessons. Do not trade your entire net worth. Wait for a bottom to form before buying, and use the 200-day moving average to help: waiting until price is back above it reduces the chance of getting into serious trouble. Pay attention to the broader market cycle rather than just to individual valuations. And analyse what could go wrong, with a plan for the worst case, while not assuming the worst case will happen, because optimism is essential in trading.
How did he recover? His view is that large drawdowns usually come from being early rather than wrong in a longer-term sense. He held on, and when the market had discounted the Federal Reserve’s rate hikes and the AI boom began, the growth stocks he held took off.
Notice how directly the 2022 lesson produced the 2024 Alibaba process. The 200-day gate, the small probes with tight stops, and the refusal to build size until the market agreed are all answers to the specific mistakes of 2022: buying falling stocks, too large, and adding to losers. It is one of the clearest examples in the book of a drawdown being converted into a rule. Our pieces on managing drawdowns professionally and the psychology of losing cover how to do the same with your own.
Still a trader underneath
For all the long-term language, Fröhlich is candid that he cannot stop trading. It is almost impossible, he says, for him to sit in a position for years without pressing buttons. He knows the big money is made by holding core positions for years, so he sometimes takes trades that may not be strictly optimal, because they satisfy the craving for activity without tinkering with the core book. These are intuition trades on extremes he expects to revert, such as going short gold in October 2025 after ten consecutive up weeks, something he says had never happened before. The chapter does not report the outcome.
What he would do if starting today
Asked in April 2025, he says that restarting from zero he would probably trade crypto, not as an enthusiast but because it resembles small caps fifteen years ago in inefficiency and volatility. On whether to trade alone, join a hedge fund or go to a prop firm, he thinks going solo is best in the long run but a prop firm is the best option for most new traders.
Prop firms, he says, teach the basics, provide structure that prevents beginner mistakes, and have groups or pods that act as sounding boards and help with psychology. He has friends who recently joined one and are learning a lot. He also thinks traders should eventually leave to go solo, because once you know yourself, the noise of a prop firm can hurt. If you are weighing that route, our guide to prop firm trading covers how the model works and what it costs.
Advice to the trader who keeps blowing up
His answer is blunt, and he says so. If you do not have the willpower to fight through the pain, you should not be a trader. You have to want it so much that you keep going when the evidence and the people around you say stop, because anyone who makes it has been through years of grind and pain. He names his own two motivators: a fear of not amounting to much, and a fear of having someone above him dictating his life.
That is honest, and it is also the survivor speaking. We return to it in the counterweight.
Mind, Method, Money
Fröhlich is an unusual fit for the three pillars because his Method changed completely three times while his Money rules and his Mind habits carried across every switch.
How Fröhlich maps to the three pillars
| Pillar | What he did | Where it broke |
|---|---|---|
| Mind | Studied every blow-up. Never considered quitting while he could see progress. Willing to abandon a working strategy when its environment ended. Built a trading habit into a long-term book rather than fighting it. | Stubbornness about taking losses, the flaw that took longest to fix. In 2022, eagerness to buy cheap stocks overrode patience. |
| Method | Three different edges, each built on research: SEC filings and gap templates back to 2000, catalyst-plus-consolidation breakouts, and valuation-plus-catalyst investing with a 200-day gate. | Each method only works in its environment. The small-cap edge decayed as it became known; the mid-cap edge became a disaster after mid-2021. |
| Money | Maximum loss per stock and per day. Half-size entries, independent-setup pyramiding, additions sized to risk only open profit, three-strikes rule. | 2022: positions too large and additions to losers, the one period where his own pyramiding discipline was reversed. |

Eighty-six lives read through Mind · Method · Money, from Livermore reading a chalkboard in 1892 to the traders still working from those ideas today. Told as they happened, with the losses left in, and every quotation traced to a source.
The counterweight
Five things need to sit beside the record, and two of them come from the authors themselves.
The famous number has no dollar base. The chapter verifies percentages, not amounts, and a 1,132,045% year says nothing on its own about how much money was involved. The early account was funded with several thousand dollars of birthday money. Extreme percentage returns are far easier on small capital, where a trader can use illiquid instruments and concentrated size that would be impossible at scale. Fröhlich says as much himself: he left small caps partly because his account had outgrown them. That does not diminish the achievement, which is real and audited. It does mean the percentage should not be compared with the returns of a fund running hundreds of millions.
2020 came from an environment that no longer exists. By his own account, the small-cap shorts were more predictable then because the space was uncrowded, and the setups fell from two or three a day to two or three a week after the Covid boom. The mid-cap strategy depended on a stimulus-driven euphoria he describes as a long-only paradise. Both edges were real, and both were products of a specific moment. Anyone trying to reproduce 2020 now is reproducing a market, not a method.
The early path is the one that usually ends a trading career. Four or five blown accounts, 100-to-one leverage, an account driven negative, a bicycle sold to pay the broker. Fröhlich survived that because the stakes were small, his parents housed and fed him, and he was young enough to recover, a point his father made explicitly. His advice to keep going through the pain is sincere, and it is also advice from the one person in the room for whom it worked. The trader reading this with a mortgage and borrowed money does not have his runway.
Both authors tell you not to copy him. Coyle calls the radical shifts in strategy a significant anomaly. Most successful traders find one or two methods and hone them to fit their goals and temperament, and most traders who adopt a style that does not suit their temperament in pursuit of a money goal end up with disastrous results. His advice is the old warning against trying this at home. Fröhlich himself declines to say whether he has an unusual ability to adapt, and leaves it to others to judge. The fair reading is that his adaptability is part of his edge, and adaptability is not something a reader can decide to have.
The public figure and the chapter disagree, in his favour, and that cuts both ways. The chapter corrects his published 892,000% upwards. But the fact that it had to correct his number at all shows how loosely performance figures travel online, including figures attached to him that do not appear in the chapter. Earlier versions of this page repeated win-rate and expectancy statistics from secondary write-ups that the chapter does not contain. We have removed them. If you see precise statistics about his trading anywhere, ask where they came from.
What actually transfers
Set two loss limits before you set a strategy. A maximum loss per position and a maximum loss per day ended Fröhlich’s blow-ups. They did not make him profitable; they kept him alive long enough to become profitable. Of everything in the chapter, this is what Coyle says matters most.
Cap your attempts, not just your loss. Three failed tries at the same idea in one day and you stop. It removes the most dangerous decision in trading, the one made immediately after being wrong.
Treat every addition as a new trade. Add only when a second setup appears that you would take with no position on, and size the addition so that a failure costs you your open profit and nothing more. If the addition does not work quickly, the whole trade is over. This single rule would fix most pyramiding.
Put a strategy down while it still works. Fröhlich stopped the mid-cap strategy in mid-2021 because its environment was ending, not because it had started losing. Write down, in advance, the market conditions your method needs, and check them monthly. For the review habit that makes this possible, our trading journal system is the place to start.
Probe small, then size. Six small losses on Alibaba bought him the right to a position that returned more than twenty times those losses. The probes were the price of being early without being ruined by it.
Free research sheet
Lukas Fröhlich: The Complete Research Sheet
Seven pages covering the audited record and what it cannot tell you, the career arc and the two loss limits that ended the blow-ups, the small-cap dilution short with its four stop types, the mid-cap breakout criteria and the independent-setup pyramiding rule with a worked example, the Alibaba and Centene theses, the counterweight, and a printable seven-question pre-trade check.
The nine traders in Market Wizards: The Next Generation
- Kristjan Kullamägi
- Lance Breitstein
- Simon Russo
- Lukas Fröhlich
- Phil Goedeker
- Kelvin Chiu
- Jason Berry
- Kenny Sharkness
- Rick Bandazian Jr.
Profiles for the remaining traders are in production. Our full review of the book covers the cohort, the lessons that carry across all nine, and where the book falls short.
Frequently asked questions
Who is Lukas Fröhlich?
Lukas Fröhlich is a trader and investor profiled in chapter four of Market Wizards: The Next Generation (2026) by Jack Schwager and George Coyle. He grew up in France and Germany, started trading at thirteen with about $500, blew up four or five small accounts during school, and began trading full-time in 2018. He is known for an independently verified 1,132,045% return in 2020 and for switching successfully between three very different strategies before his mid-twenties.
What is Lukas Fröhlich’s net worth?
There is no public or verified figure. The chapter reports his returns only as percentages and gives no dollar amounts for his account, so a net worth cannot be estimated from it. It does state his goal of growing his account to $1 billion. Any specific net worth attached to his name online is a guess.
Was Lukas Fröhlich’s 892,000% return real?
The independent review commissioned by the authors found the 892,000% figure he had published for 2020 was wrong because it was too low. On a Modified Dietz calculation, which adjusts for money moving in and out of the account, the 2020 return was 1,132,045%. Because he withdrew profits during the year, the ending balance was 37,127% above the starting balance. The authors reviewed statements, tax documents, Big Four audit reports and his brokers before commissioning the independent procedure.
What was Lukas Fröhlich’s trading strategy in 2020?
Intraday short selling of small-cap stocks that gapped up sharply, typically companies running short of working capital whose underwriters needed to sell stock into a rally. He combined SEC filings and underwriter research with statistical templates of how stocks behave after gaps of different sizes, entered on the first sign of weakness, used mental stops, stopped after three failed attempts in one stock per day, and usually covered by the close. During the same period he also traded long mid-cap breakouts.
What is Lukas Fröhlich’s pyramiding rule?
He only adds to a winning position when a second setup appears that he would take as a brand-new trade, and he sizes each addition so that if the stop on the combined position is hit, the loss on the new shares exactly cancels the open profit on the earlier shares. If an addition does not work quickly, he closes the whole trade. George Coyle says he had not heard the independent-setup rule stated before this interview.
Is Lukas Fröhlich The Short Bear?
The Short Bear is the name attached to him online and to this page’s address. The chapter itself does not use the handle, so we have kept to what the chapter documents throughout.
Which Market Wizards book is Lukas Fröhlich in?
Market Wizards: The Next Generation (Harriman House, 2026), where he is chapter four, “Metamorphosis: Short-Term Short to Long-Term Long”. The book also profiles Kristjan Kullamägi, Lance Breitstein and Kelvin Chiu. Our review of the book covers the full cohort.
Sources and further reading
Primary source: Jack D. Schwager and George Coyle, Market Wizards: The Next Generation (Harriman House, 2026), chapter four, “Metamorphosis: Short-Term Short to Long-Term Long”, including the Kelly criterion insert and the closing notes from both authors. All figures, trades and dates above are drawn from that chapter. Calculations and worked examples explicitly labelled as ours are our own derivations or illustrations, not figures the book publishes. Complete Trader’s Edge has not audited any of the underlying trading statements, and the chapter’s calculation endnotes are not reproduced here.
Continue Learning
- Lance Breitstein: $46 Million at Trillium, $71 Million on His Own
- Kristjan Kullamägi (Qullamaggie): The $105 Million That Lasted a Few Days
- Kelvin Chiu: The Commodities Trader Who Made Asymmetry His Edge
- Market Wizards: The Next Generation Book Review (2026)
- Stanley Druckenmiller: 30 Years, Not One Losing Year
- Jesse Livermore: The Boy Plunger
- Richard Dennis: The Turtle Trader Experiment
- The Kelly Criterion for Traders
- Position Sizing: The Most Important Decision in Every Trade
- The Three Pillars: Mind, Method, Money
- The Complete Trader’s Edge — The Book
 The Complete Trader's Edge
The full Mind · Method · Money framework. 70 chapters.
View on Amazon →
The Complete Trader's Edge
The full Mind · Method · Money framework. 70 chapters.
View on Amazon →
 Market Mayhem
400 years of bubbles, crashes, and the pattern that keeps repeating.
Buy on Amazon →
Market Mayhem
400 years of bubbles, crashes, and the pattern that keeps repeating.
Buy on Amazon →
 Greatest Companies
How the world's greatest companies were built — and what traders learn from them.
View on Amazon →
Greatest Companies
How the world's greatest companies were built — and what traders learn from them.
View on Amazon →
 Greatest Traders
Eighty-six lives that explain the markets — Livermore to Madoff, told with the losses left in.
View on Amazon →
Greatest Traders
Eighty-six lives that explain the markets — Livermore to Madoff, told with the losses left in.
View on Amazon →