The wedge is the pattern most traders get backwards, and the mistake is expensive. A rising wedge – price grinding higher and higher – feels bullish, so people keep buying it. A falling wedge feels bearish, so people keep selling it. Both instincts are wrong. The rising wedge is a bearish pattern and the falling wedge is a bullish one, and once you understand why, you stop fighting the reversal and start trading it.
This guide covers both wedges, what the narrowing structure really tells you, how to trade the break, and how to avoid the false move that catches the crowd.
What the Wedges Are
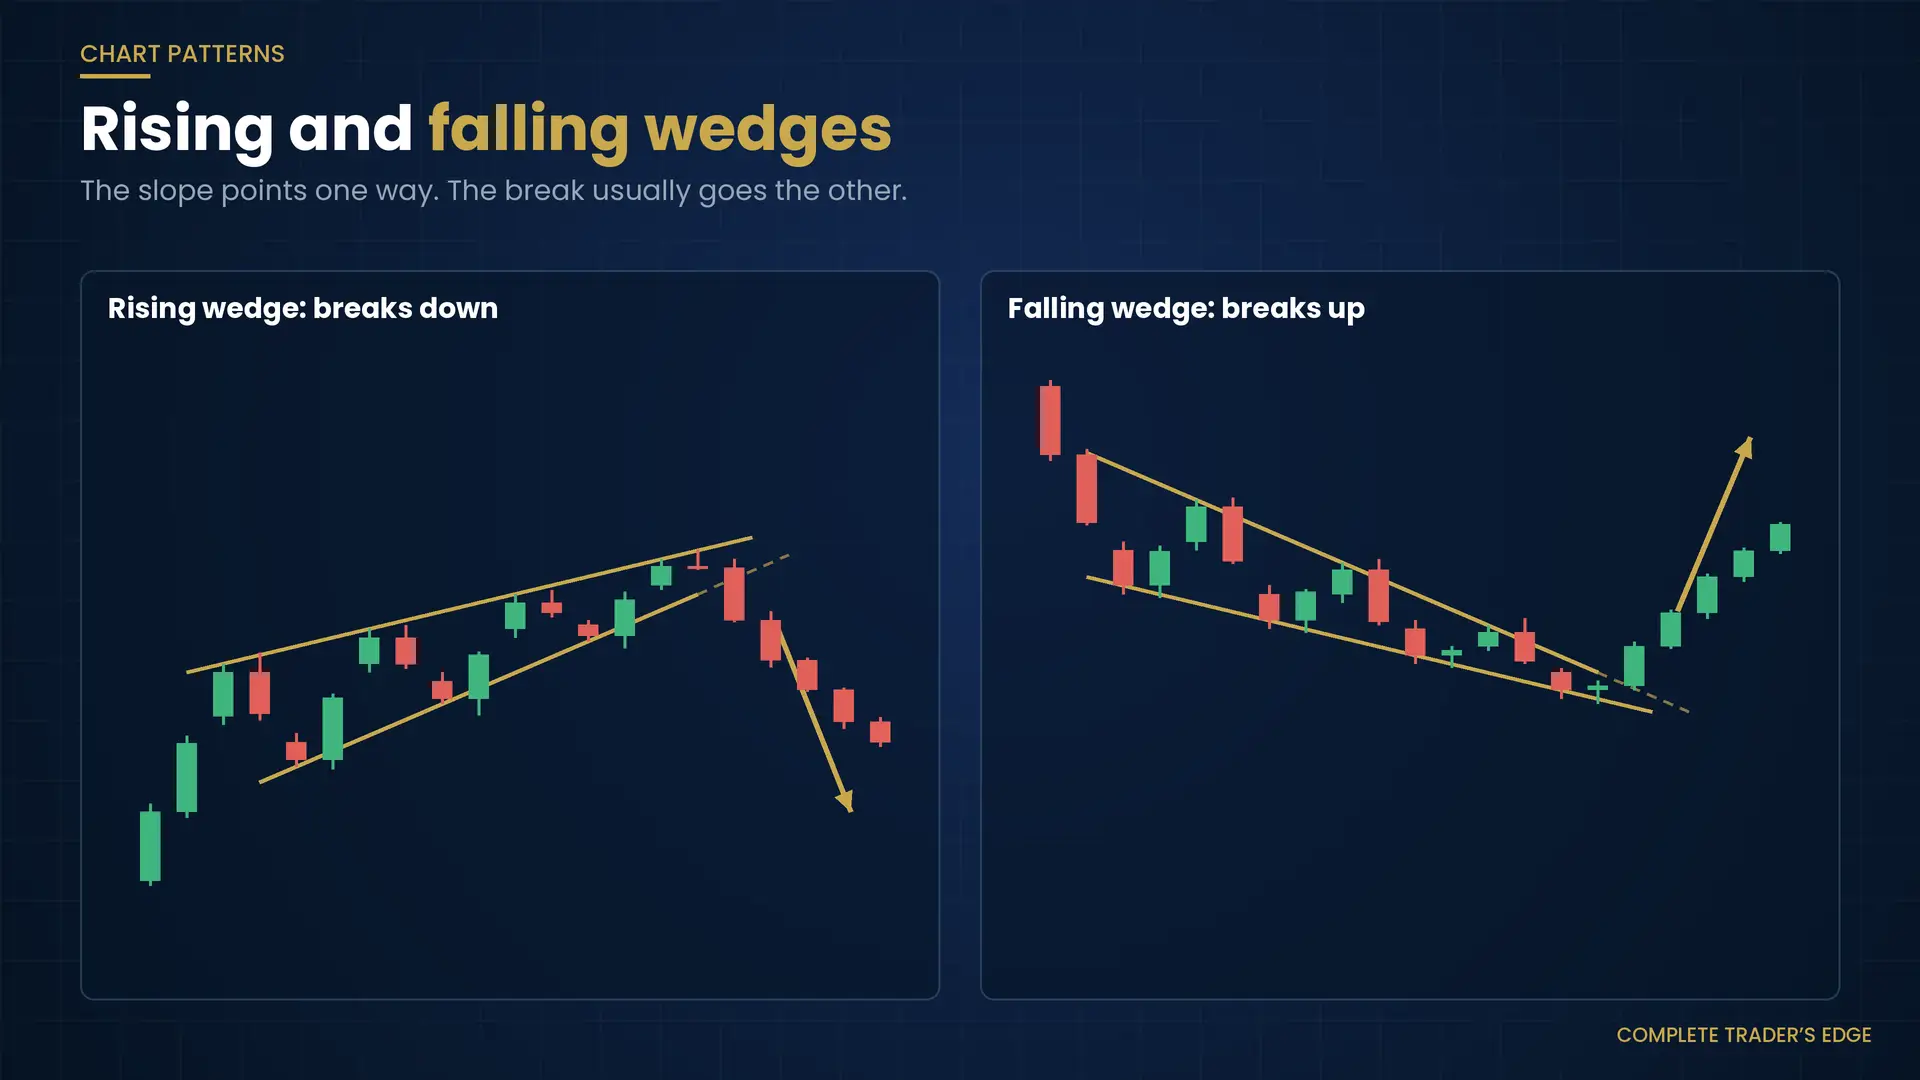
A rising wedge has two upward-sloping lines converging – both the highs and the lows are rising, but the lows rise faster, so the range narrows as it climbs. Despite pointing up, it is a bearish pattern that usually resolves downward.
A falling wedge is the inverse: two downward-sloping lines converging, with the highs falling faster than the lows. Despite pointing down, it is a bullish pattern that usually resolves upward.
Wedges appear both as reversals at the end of a trend and as continuations within one. Either way, the direction of the eventual break is what matters, and it is usually against the way the wedge is sloping.
What It Really Means
A wedge is a picture of momentum dying. In a rising wedge, price is still making higher highs, but each push is weaker than the last – the gap between the highs and the lows is shrinking because buyers are running out of strength even as they keep nudging price up. It is the look of a rally on fumes. The falling wedge is the same exhaustion in reverse: sellers keep pressing, but each new low comes with less force, and the selling is fading.
Through a smart-money lens, the converging structure funnels attention onto two obvious lines and concentrates liquidity as the wedge narrows – much like a triangle. The grinding, weakening pushes toward the wedge’s apex are often a distribution (in a rising wedge) or accumulation (in a falling wedge) taking place while the crowd is lulled by the trend that is quietly running out of fuel.
How to Trade It
Entry. Wait for the decisive break of the wedge – downward for a rising wedge, upward for a falling wedge – and enter on the retest of the broken line. As with any converging pattern, the sweep-and-reclaim is often the cleanest signal: price pokes beyond the line, traps the breakout crowd, then reverses into the real move.
Stop. On the opposite side of the wedge, or beyond the swing that produced the break. If price climbs back inside and keeps going, the break has failed.
Target. A common approach projects the height of the wedge’s base from the breakout point, but manage to real structure and the next liquidity pool. Risk no more than 1% of your account.
The slope lies; the break tells the truth. Never assume a rising wedge will keep rising or a falling wedge will keep falling. Trade the confirmed break against the slope, and let the ones that keep going without breaking pass you by.
When It Fails
Wedges are drawn by hand, which makes them subjective – two traders can see slightly different lines on the same chart. That looseness means false breaks are common, especially the premature poke that reverses. The defence is confirmation: demand a decisive close through the line and, ideally, the retest before committing. And as always, context rules. A rising wedge at the top of an extended trend into higher-timeframe resistance is far more trustworthy than one drawn in the middle of a strong, healthy move.
Key Takeaways
- Rising wedge = bearish; falling wedge = bullish. The break is usually against the slope.
- The narrowing range shows momentum dying – a rally or decline running out of fuel.
- Trade the confirmed break and retest, or the sweep-and-reclaim; never assume the slope continues.
- Stop on the opposite side of the wedge; target the base height, managed to structure.
- Wedges are subjective, so false breaks are common – demand a decisive close.
Frequently Asked Questions
Why is a rising wedge bearish?
Because the narrowing range shows that each higher push is weaker than the last – buyers are exhausting themselves even as price nudges up. The rising slope is momentum fading, not strengthening, which is why a rising wedge typically resolves with a break downward rather than a continuation up.
How is a wedge different from a triangle?
Both are converging patterns, but a wedge is slanted – both trendlines slope in the same direction – and carries a directional bias against that slope. A triangle usually has one flat line (ascending or descending) or symmetrically converging lines with no built-in slope bias. The trading approach is similar: wait for the confirmed break rather than predicting.
Wedges are one family of formations in our complete guide to chart patterns through a smart money lens.
Learn to read every classic pattern through the lens of liquidity and structure with the Mind · Method · Money framework in The Complete Trader’s Edge by Louw van Riet.
 The Complete Trader's Edge
The full Mind · Method · Money framework. 70 chapters.
View on Amazon →
The Complete Trader's Edge
The full Mind · Method · Money framework. 70 chapters.
View on Amazon →
 Market Mayhem
400 years of bubbles, crashes, and the pattern that keeps repeating.
Buy on Amazon →
Market Mayhem
400 years of bubbles, crashes, and the pattern that keeps repeating.
Buy on Amazon →
 Greatest Companies
How the world's greatest companies were built — and what traders learn from them.
View on Amazon →
Greatest Companies
How the world's greatest companies were built — and what traders learn from them.
View on Amazon →
 Greatest Traders
Eighty-six lives that explain the markets — Livermore to Madoff, told with the losses left in.
View on Amazon →
Greatest Traders
Eighty-six lives that explain the markets — Livermore to Madoff, told with the losses left in.
View on Amazon →