

Bollinger Bands are one of the most popular indicators on the planet, and one of the most consistently misused. Traders see price touch the upper band and sell, touch the lower band and buy, and wonder why they keep getting run over in trends. The problem is that they are treating a volatility tool as a signal generator. Bollinger Bands do not tell you where price will turn. They tell you how stretched price is relative to its recent range, and used that way – as context, not a trigger – they become genuinely useful.
This guide covers what the bands actually measure, what ten years of daily data on four markets says about trading band touches, and how to use the bands properly alongside structure and liquidity.
The data in brief
- Price closed outside the bands on 11–14% of days across the S&P 500, gold, EUR/USD and Bitcoin – far more often than the textbook implies.
- Shorting a close above the upper band was in profit 10 days later 36–50% of the time, and lost money on average in all four markets.
- Buying a lower-band close only beat a coin flip when the market was already in an uptrend.
- After a squeeze, band width roughly doubled within 20 days – but the direction of the break was close to random.
What Bollinger Bands Are
Bollinger Bands consist of three lines: a middle band, which is a simple moving average (usually 20 periods), and an upper and lower band placed a set number of standard deviations away from it (usually two). Because standard deviation is a measure of volatility, the bands widen when the market is volatile and contract when it is quiet. That is the entire mechanism – a moving average with a volatility envelope wrapped around it.
- Middle band = 20-period simple moving average of the close.
- Upper band = middle band + (2 × 20-period standard deviation).
- Lower band = middle band − (2 × 20-period standard deviation).
John Bollinger also built two companion readings from the same lines. %B tells you where the close sits relative to the bands: 1.0 is the upper band, 0 is the lower band, and readings above 1 or below 0 mean price has closed outside. BandWidth is the distance between the bands divided by the middle band, and it is the cleanest way to measure a squeeze.
What They Really Show
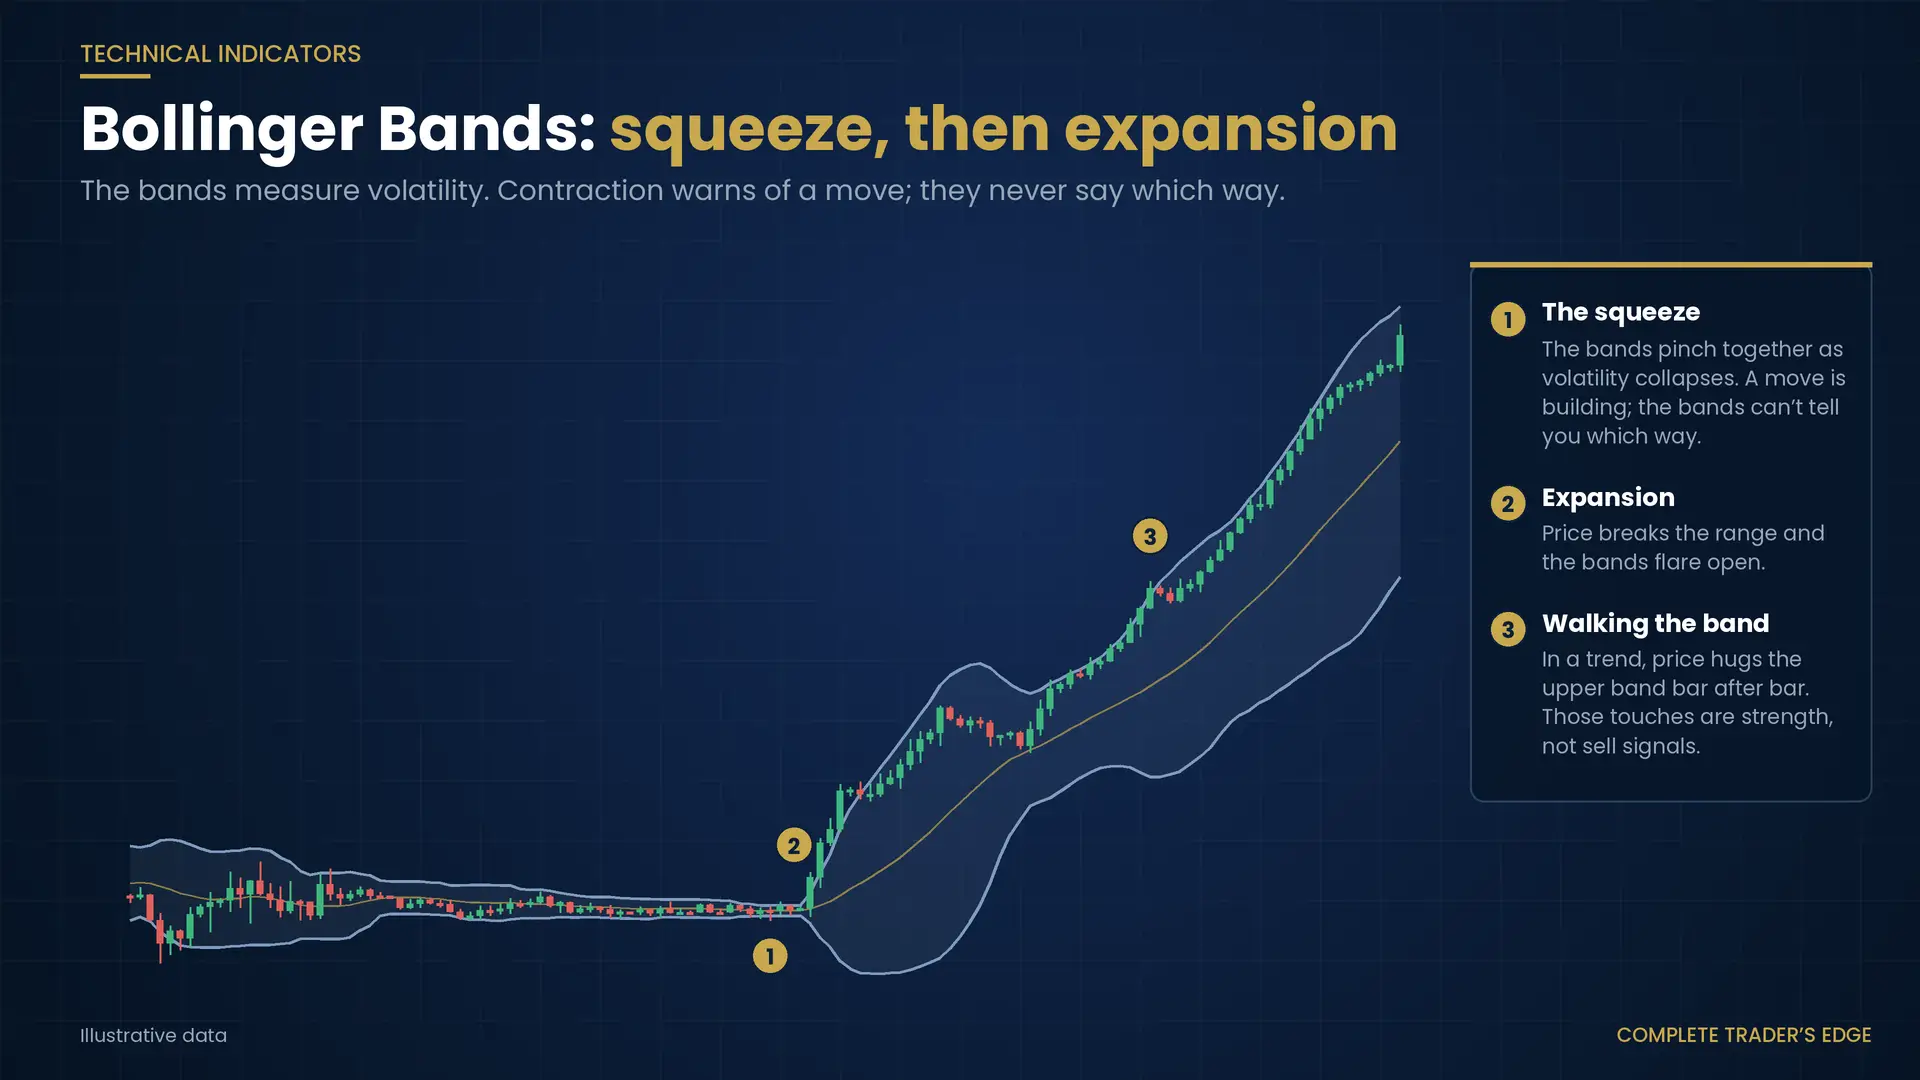
The bands measure how far price has stretched from its average in volatility terms, not whether it is about to reverse. This distinction is everything. In a strong trend, price will “walk the band” – hugging the upper band for candle after candle as it climbs, or the lower band as it falls. A trader fading every band touch in that environment is fighting the trend and losing repeatedly.
Bollinger himself is blunt about this. His own published rules describe band tags as “tags not signals”, and state that a tag of the upper band is not a sell signal in itself.
The most valuable signal the bands give is the squeeze. When the bands contract tightly, volatility has collapsed and the market is coiling – the same compression you see in an inside bar. Contraction precedes expansion, so a squeeze is a heads-up that a significant move is building. The bands do not tell you which way it will break; that comes from structure and the liquidity around the range.
What Ten Years of Data Says
Opinions about band touches are cheap, so we tested them. We pulled daily data from TradingView for four very different markets – the S&P 500 ETF (SPY), gold, EUR/USD and Bitcoin – from October 2016 to October 2026, applied standard 20-period, 2-deviation Bollinger Bands, and measured what happened 10 trading days after each close outside the bands.
| Daily, Oct 2016 – Oct 2026 | S&P 500 | Gold | EUR/USD | Bitcoin |
|---|---|---|---|---|
| Days closing outside the bands | 10.9% | 13.9% | 12.3% | 12.9% |
| Short an upper-band close: in profit after 10 days | 36% | 49% | 40% | 50% |
| Short an upper-band close: average 10-day result | −0.5% | −0.5% | −0.3% | −3.2% |
| Buy a lower-band close in an uptrend: in profit | 71% (35) | 70% (20) | 56% (18) | 45% (31) |
| Buy a lower-band close in a downtrend: in profit | 53% (19) | 57% (28) | 51% (47) | 48% (40) |
| Any random day held 10 days: in profit | 66% | 57% | 50% | 55% |
| Another upper-band close within 5 days | 56% | 69% | 58% | 68% |
| Longest run of closes above the upper band | 5 days | 7 days | 6 days | 9 days |
Source: TradingView daily data (AMEX:SPY, TVC:GOLD, FX:EURUSD, BITSTAMP:BTCUSD). Signals counted at most once per 10 bars so one move is not counted repeatedly; sample sizes in brackets. Uptrend/downtrend = close above/below the 200-day moving average. No costs, stops or targets.
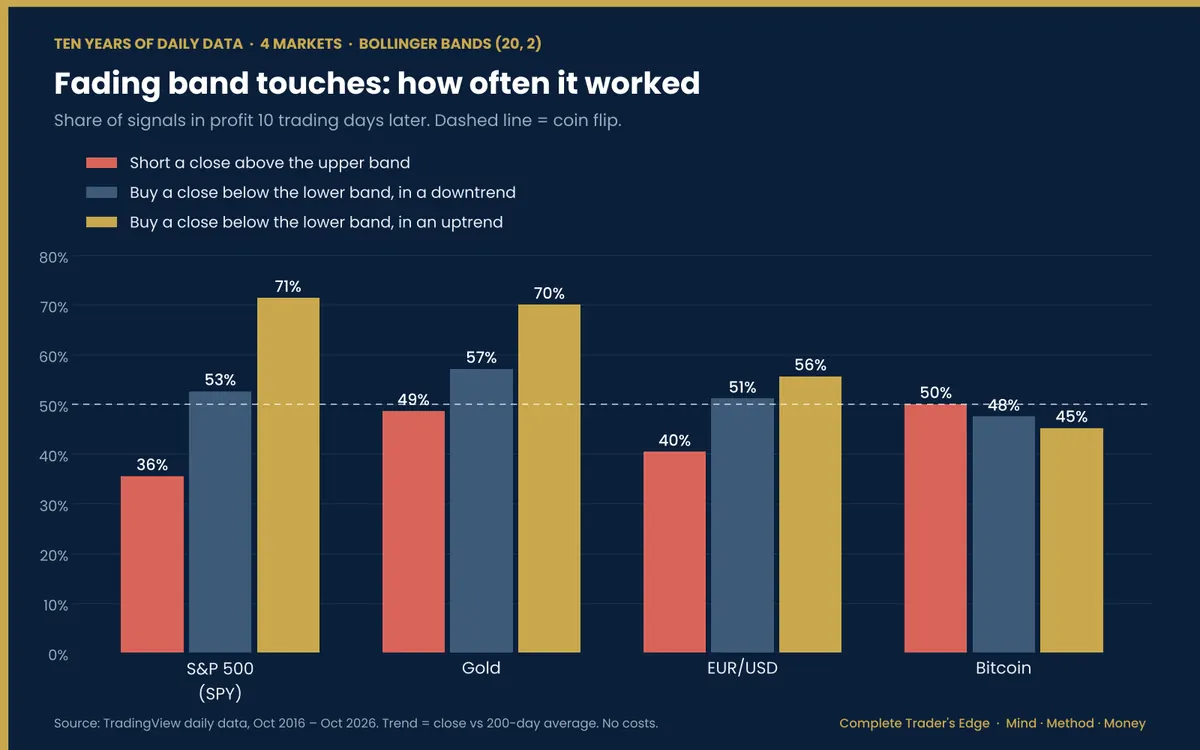
Outside the bands is not rare. If price changes were normally distributed, roughly 5% of closes would land beyond two standard deviations. In practice price closed outside the bands on more than one day in ten in every market tested. Markets have fat tails, and a 20-bar window adapts slowly. A band touch is a routine event, not an extreme one.
Fading the upper band lost money everywhere. Shorting a close above the upper band was in profit after 10 days between 36% and 50% of the time, and the average result was negative in all four markets. Worse, once price closed above the upper band it closed there again within five days 56–69% of the time. That is the band walk showing up in the numbers.
Buying the lower band depended on the trend. In an uptrend, buying a lower-band close worked 70–71% of the time on the S&P 500 and gold. In a downtrend, the same signal hovered around a coin flip. Here is the honest counterweight: some of that uptrend result is simply the market’s upward drift. On the S&P 500, a random day held for 10 days was already in profit 66% of the time, so the lower-band buy added only a few points on top. Gold showed a wider gap; Bitcoin and EUR/USD showed none. The band touch did not create an edge on its own – trend context did most of the work.
The Squeeze in Real Markets
The squeeze holds up better, with one important caveat. We flagged a squeeze whenever band width fell to its lowest level in 120 trading days (roughly six months). Across 90 squeezes in the four markets, the median band width 20 days later was 1.8–2.1 times wider than at the squeeze. Quiet markets reliably got louder.
The direction, though, was close to random. Price was higher 20 days after a squeeze 65% of the time on the S&P 500 (in line with its normal upward drift), 45% on gold, 47% on EUR/USD and 31% on Bitcoin. And the typical move was only slightly larger than an ordinary 20-day move – for example 3.0% versus 2.8% on the S&P 500. The squeeze tells you volatility is likely to rise from a low base. It does not promise a big trend, and it does not tell you which way.
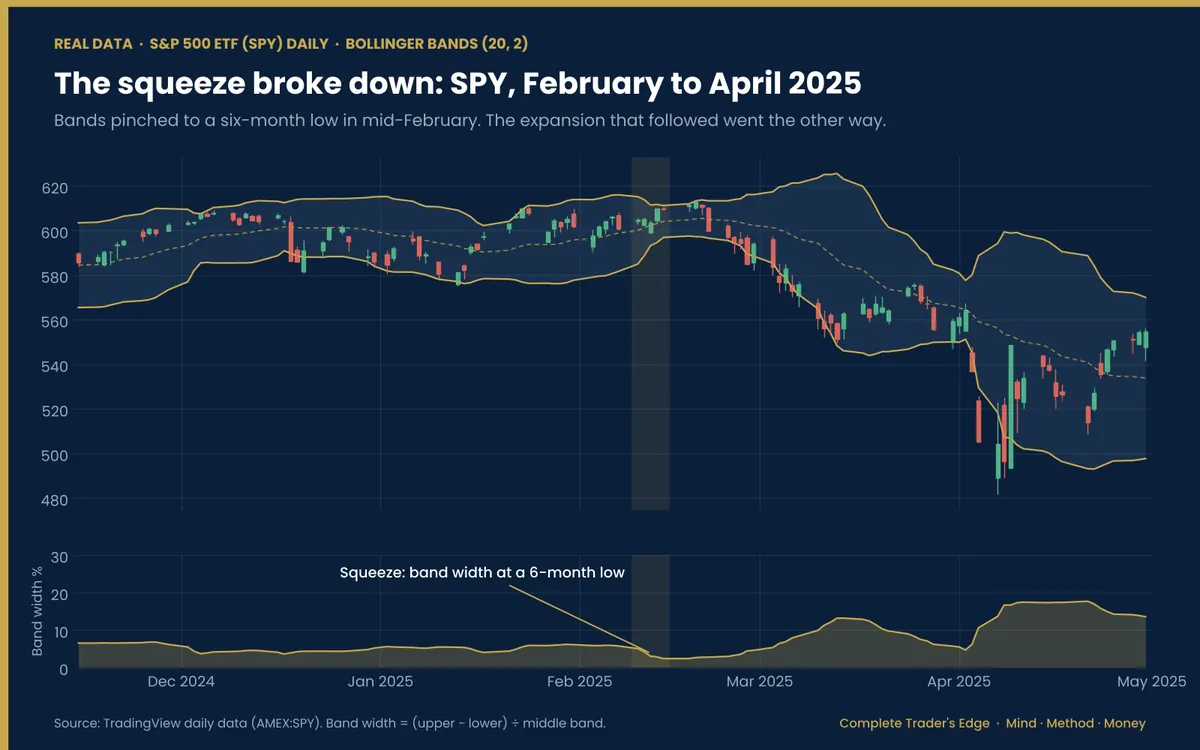
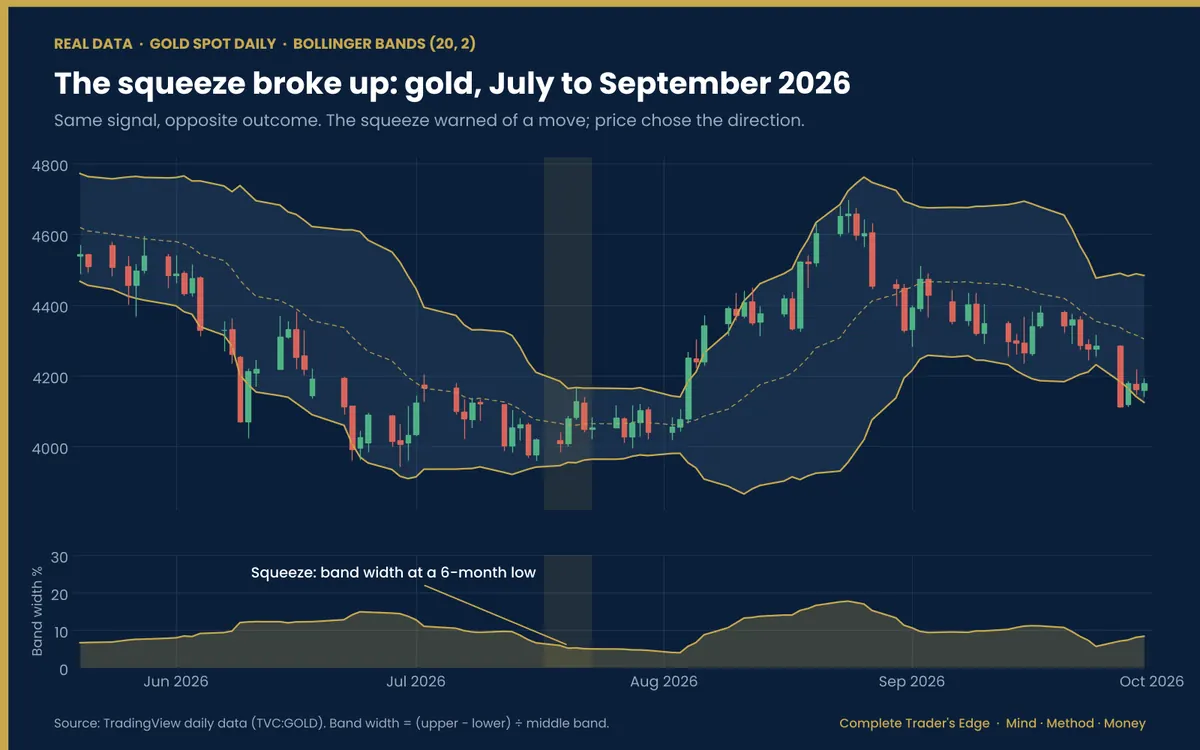
Put the two charts side by side and the lesson is obvious. Both squeezes did their job – volatility exploded afterwards – but one broke down and one broke up. A trader who had decided the direction in advance would have been right once and wrong once.
How to Use Them Properly
As context, not a signal. A band touch tells you price is stretched; it becomes tradeable only when it coincides with something real – a key support or resistance, a swept liquidity pool, a clear rejection. A touch of the lower band at a demand zone after a sweep, in an uptrend is a confirmation of an idea you already have. A touch of the lower band in open space in a downtrend is nothing – the data above says so.
The squeeze as a heads-up. When you spot a squeeze, prepare for expansion. Mark the range highs and lows, note where the liquidity sits, and trade the confirmed break in the direction the market chooses – not the direction you guessed. Expect your stop to need more room once volatility returns.
The middle band as a trend gauge. Price holding above the middle band (the moving average) reflects bullish control; below it, bearish. It works as a simple trend filter, not an entry.
The band is not a wall. “Overbought” at the upper band can stay overbought for the entire length of a trend – Bitcoin closed above its upper band nine days running in our sample. Never fade a band touch on its own – use it only to confirm a setup you already have from structure and location.
Which Settings to Use
The 20-period, 2-deviation default is the right starting point for most traders on most timeframes, and it is what every statistic in this guide uses. If you change the length, Bollinger’s own rules say to adjust the deviation with it:
| Period | Standard deviations | Character |
|---|---|---|
| 10 | 1.9 | Faster, tighter, more touches |
| 20 | 2.0 | The standard setting |
| 50 | 2.1 | Slower, wider, fewer touches |
Source: John Bollinger’s Bollinger Band rules.
Resist the urge to optimise settings until the backtest looks good. The bands are a volatility lens; tuning the lens does not create an edge that the underlying setup does not have.
The Limitations to Respect
Bollinger Bands are built on a moving average, which means they lag – they describe what price has already done. They generate constant false “overbought” and “oversold” readings in trends, and band touches alone showed no reliable edge in ten years of data across four markets. Like every indicator, they are a derivative of price, and price itself – where structure breaks, where liquidity sits – is always the primary read. Treat the bands as a lens on volatility, and let price action lead.
The test above has limits too. It uses daily closes only, ignores costs and slippage, and uses simple 10-day holds rather than real stops and targets. Several of the trend-split samples are small (18–47 signals), so treat the exact percentages as directional rather than precise.
Key Takeaways
- Bollinger Bands are a moving average with a volatility envelope – they measure stretch, not direction.
- Closes outside the bands happened on 11–14% of days in our test. A touch is routine, not extreme.
- Shorting upper-band closes lost money on average in all four markets; price often walked the band instead.
- Buying lower-band closes only helped in uptrends – trend context did the work, not the band.
- The squeeze reliably led to higher volatility, but the direction of the break was close to random.
- The bands lag; price, structure, and liquidity lead.
Frequently Asked Questions
Should I buy when price touches the lower Bollinger Band?
Not on its own. In ten years of daily data, buying a lower-band close in a downtrend was roughly a coin flip in every market tested, while in an uptrend it worked more often on the S&P 500 and gold. The touch only becomes tradeable when it lines up with the trend, a real level, a liquidity sweep, or a clear rejection.
What is a Bollinger Band squeeze?
A squeeze is when the bands contract tightly together, signalling that volatility has collapsed and the market is coiling. In our test, band width roughly doubled within 20 days of a six-month low in band width. It does not tell you the direction – you get that from structure and the break itself.
What are the best Bollinger Band settings?
For most traders, 20 periods and 2 standard deviations. If you shorten the period to 10, Bollinger suggests 1.9 deviations; if you lengthen it to 50, 2.1 deviations. Changing settings does not fix a weak setup.
Do Bollinger Bands work on forex and crypto?
The maths works on any market, but the behaviour differs. In our sample, Bitcoin walked the bands for longer and punished upper-band shorts hardest (an average loss of 3.2% over 10 days), while EUR/USD showed almost no edge in either direction. Use the same rules everywhere: context first, band second.
What does %B mean on Bollinger Bands?
%B shows where the close sits within the bands. A reading of 1.0 means price is on the upper band, 0.5 is the middle band and 0 is the lower band. Readings above 1 or below 0 mean price has closed outside the bands.
Bollinger Bands are covered alongside the core tools in our guide to trading indicators and when they actually help.
Learn where indicators fit within a structure-first method using the Mind · Method · Money framework in The Complete Trader’s Edge by Louw van Riet.
 The Complete Trader's Edge
The full Mind · Method · Money framework. 70 chapters.
View on Amazon →
 Market Mayhem
400 years of bubbles, crashes, and the pattern that keeps repeating.
Buy on Amazon →
 Greatest Companies
How the world's greatest companies were built — and what traders learn from them.
View on Amazon →
 Greatest Traders
Eighty-six lives that explain the markets — Livermore to Madoff, told with the losses left in.
View on Amazon →